IBB Vs. XBI: Which Biotech ETF Has A Better Chart?

The SPDR S&P Biotech ETF (NYSE: XBI) is trading below an important resistance level, but the iShares Nasdaq Biotechnology ETF (NASDAQ: IBB) has broken out.
Resistance is a large group of sellers who are all trying to sell their shares at the same price. When stocks or ETFs reach resistance levels, rallies pause or end.
When a stock trades above a level that had been resistance, it means the sellers who created the resistance are gone. With this supply taken off of the market, buyers will need to pay higher prices. This results in a rally and it's called a breakout.
See Also: 14 Biotech Stocks To Watch Over The Next 6 Months
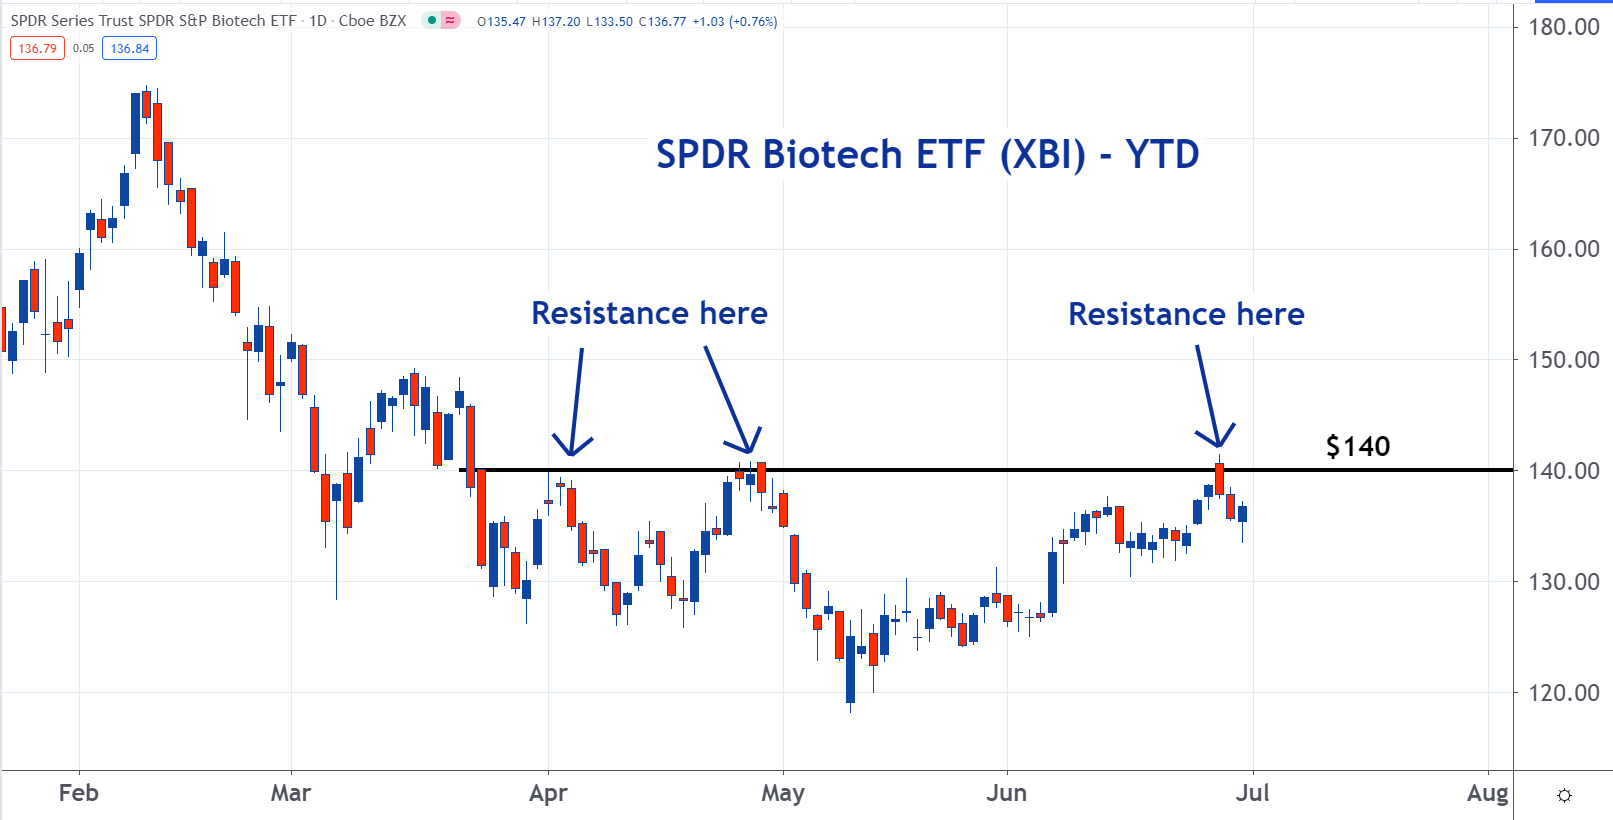
XBI is trading below important resistance at the $140 level.
But the chart of XBI looks better. It has broken out above the resistance at the $158 level.

© 2021 Benzinga.com. Benzinga does not provide investment advice. All rights reserved.
Posted-In: Biotech Sector ETFs Technicals Trading Ideas ETFs General Best of Benzinga