What's behind Formula 1's latest Driver Performance graphic
Formula 1's rollout of data graphics on its coverage has delivered a bit of a Marmite reaction from fans. Viewers either love them or hate them.

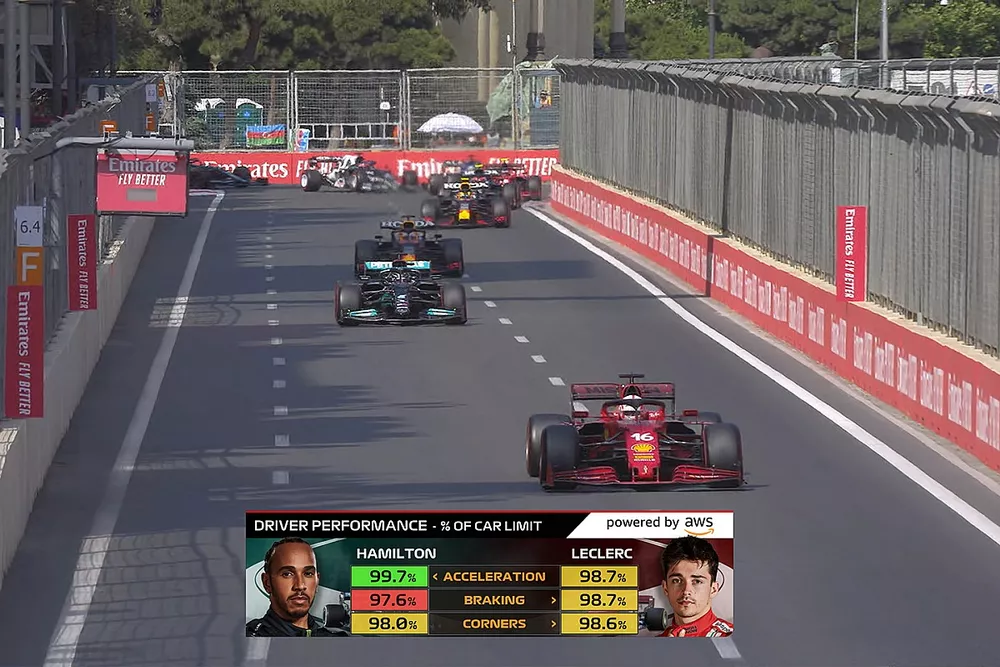
That was exactly the reaction that a new AWS 'Driver Performance' graphic got when it first appeared on screen at last weekend's French Grand Prix.
The data, suggesting things like Max Verstappen's driver performance was 98.7% of the car limit in corners, whereas Lewis Hamilton was only 97.1%, drew short shrift from some commentators, including Sky's Martin Brundle.
Reacting to some chatter about the graphic, Brundle said: "Yes. That is certainly some data. No idea where it comes from, but that's what it says."
While sceptics have long questioned the validity of a host of F1's data graphics, most especially a tyre performance one, key figures behind it say that actually the numbers are much closer to reality than some think.
As respected engineer Rob Smedley, F1's director of data systems who is central to guiding the graphics, said recently, teams have been impressed with what's been laid out to fans.
"It was quite interesting actually, because when we first started this, there were a lot of comments of: just how can they do that, come on?" Smedley told Autosport.
"But then what started to happen after these tyre performance graphics starting pinging up was, and obviously I've got lots of mates, and especially technical mates who work in the teams, I started getting quite a few messages saying 'How did you do that then? Because when we've looked back on it, that's pretty accurate!'
Judging the drivers
But while evaluating car components and tyres is one thing because they can be properly measured, the labelling of a driver's performance is something slightly different as it can be more much subjective – and so much more complicated.
AWS and F1 are clear that the aim of the graphic is to offer an insight into how each driver is exploiting the performance of their car.
So the ultimate idea is to find out if, for example, George Russell qualifying 10th in a Williams is regularly doing as good a job as Max Verstappen when he takes pole position.

George Russell, Williams FW43B, Kimi Raikkonen, Alfa Romeo Racing C41, and Lance Stroll, Aston Martin AMR21
Photo by: Mark Sutton / Motorsport Images
For that to be properly judged, a full data set needs to be drawn up to evaluate the performance of the Williams and the performance of the Red Bull so the role of the car can be removed from the equation.
Smedley explained in a recent AWS Blog Post about the data is drawn up for the Driver Performance graphic.
"Let's look at a simple example: if driver X at the front of the grid in the best car is able to complete a lap time of 1m30s by extracting 100% of the performance of his car then if he extracts less than the maximum performance his lap times will be slower," he said.
"In this simple example we will say that drive X extracts only 91% of the maximum performance and the result in lap time will be three seconds slower and therefore a 1m33s lap.
"Now we take driver Y who is in the slowest car on the grid. In this case, driver Y is only able to attain a 1m32s lap time even when exploiting 100% of the performance of his car. On the other hand, when driver Y exploits only 91% his lap time drops to 1m35s.
"Let's take an example of the face value qualifying result of drivers X and Y as being lap times of 1m31.1s and 1m32.3s respectively. If we use a simple linear interpolation of the numbers given above then this would result in the following:
"Driver X is exploiting his car to 96.7% of the maximum. Driver Y is exploiting his car to 99.1% of the maximum.
"We therefore end up with the situation where on face value driver Y is 1.2 seconds behind driver X on the grid where is in reality the slower driver has exploited his car to a much higher degree (99.1% versus 96.7%)."
Car performance factor
The only way the numbers can work is if the baseline data is strong enough to work out what the maximum performance of each car is.
This is where AWS's expertise in picking through the myriad of data sensor comes in – which has helped construct a complex car and simulation model.
The main driving factor is the front and rear grip available to a driver, as that then provides the performance envelope of the car. A driver operating closer to that limit will have a higher percentage figure in terms of his Driver Performance.
Corners have also been broken up into three areas: braking, turning and exit phase – with each part having its own data sets.
As Smedley explains: "The modelling starts from reconstructing the tyre forces from the available telemetry signals that we use in in-car camera images (accelerometers, speed sensors, etc).
"We then fit a parametric tyre model to the data and from this we can calculate the maximum force that each tyre is capable of generating in all the various car conditions."

AWS data graphic
Photo by: Amazon
The data inputs can be seen above.
It is the culmination of how close the driver is to the car's grip limit, across the three phases of the corner, over a whole lap that provides the final numerical figure that is broadcast as a percentage.
But, as Smedley explains, the numbers should certainly not be taken as gospel as there are elements of performance that go far beyond anything that can be taken from car data.
"We should always remember that F1 is a blend between human and technical excellence and therefore we cannot discount the car's contribution to the result," he said.
"It is hugely insightful however to understand how close each driver can get towards the limit of their respective machinery."
Related video

Previous article
How Ferrari is staying calm over an F1 tyre problem it can't yet solve
Next article
F1 Styrian GP: Verstappen fastest from Gasly in opening practice session


How F1's biggest crisis helped trigger its exciting 2021 season
Formula 1's return to Austria this weekend comes under exceedingly different circumstances to its last Spielberg visit, when F1 took its first tentative steps out of the global COVID shutdown. But the tightrope F1 walked in 2020 has ultimately led to the most exciting season of the hybrid era

Can Red Bull really win anywhere now it’s toppled a Mercedes F1 stronghold?
OPINION: Red Bull team boss Christian Horner reckoned Max Verstappen winning the French Grand Prix – an event where Mercedes had previously been dominant – would signal “we can beat them anywhere”. Here’s how that claim stacks up looking at the rest of the 2021 season

The IndyCar feature that Paul Ricard desperately needs in F1
OPINION: The French Grand Prix offered a surprisingly interesting spectacle, despite the headache-inducing nature of the circuit. But IndyCar's Road America race offered far more in terms of action - and the increased jeopardy at the Elkhart Lake venue might be something Paul Ricard needs in future...

French Grand Prix Driver Ratings
The French GP was a weekend decided by tiny margins both at the front of the field, as Red Bull inflicted a comeback defeat on Mercedes, and in the battle for the minor points places. That's reflected in our driver ratings, where several drivers came close to a maximum score

How Red Bull took French GP "payback" on a day of Mercedes mistakes
The French GP has been a stronghold for Mercedes since Paul Ricard's return to the calendar in 2018. But that all changed on Sunday, as a clever two-stop strategy guided Red Bull's Max Verstappen to make a race-winning pass on the penultimate lap - for once leaving Mercedes to experience the pain of late defeat it has so often inflicted on Red Bull

The new age of sponsorship facilitated by F1’s relevancy push
The age of the high-profile title sponsor is over, says JONATHAN NOBLE, but Formula 1’s commitment to technological innovation is attracting high-tech partners

How Britain’s lost Ferrari star epitomised a bygone F1 era
The 1956 Italian Grand Prix was over for Juan Manuel Fangio, along with his hopes of winning the world championship – until his Ferrari team-mate (and title rival) voluntarily surrendered his own car so Fangio could continue. NIGEL ROEBUCK recalls Peter Collins, a remarkable sportsman

The 'surprise' Mercedes time that puts F1's victory fight back on a knife-edge in France
Red Bull led the way after the first two practice sessions for the 2021 French Grand Prix, but only just ahead of Mercedes. There was all the usual practice skulduggery complicating the performance picture, but one aspect seen at the world champion squad gave it a ‘surprise’ lift, as it looks to leave its street-circuit struggles firmly in the past


