
Image credit:
Depositphotos.com contributor/Depositphotos.com via MarketBeat
Q1 FY 2021 Earnings Release
On May 4, 2021, Corsair released its fiscal first-quarter 2021 results for the quarter ending March 2021. The Company reported an earnings-per-share (EPS) profits of $0.58 beating analyst estimates for $0.33, by $0.25. Revenues rose 71.6% year-over-year (YoY) to $529.4 million beating $443.27 million consensus analyst estimates. Gamer and creator peripherals segment net revenue was $175.9 million, up 131.9% YoY. The Gaming components segment grew 51.9% YoY to $353.5 million. Gross profit rose 103.9% YoY with gross margin of 30.3% YoY. The Company reduced debt by $28 million with net debt remaining of $177.3 million and outstanding principal at $299 million. Corsair CEO Any Paul stated, “We are thrilled with our first quarter financial performance and strategic progress. End demand remained strong for our products and our new products such as the K65 mini RGB keyboard and Elgato’s new accessories debuted well. We introduced 29 new products in the first-quarter, and we expect this blistering pace of new product introduction to continue throughout the year with several brand mew products still to come.” He noted that key component supplies are still “tight” and continued, “As a result of our stronger-than-expected first quarter performance and our current views for the rest of the year, we raised our 2021 annual guidance.”
Upside Guidance Raise
Corsair Gaming raised its full-year 2021 revenues to come in between $1.9 billion to $2.1 billion versus $1.91 billion consensus analyst estimates. The Company raised its adjusted operating income to come in between $235 million to $255 million, up from $205 million to $220 million earlier guidance. The Company raised it adjusted EBITDA to a range between $245 million to $265 million, up from $215 million to $230 million.
Conference Call Takeaways
CEO Paul set the tone, “We saw continued growth on buying and building $2,000 plus gaming PCs, which we believe indicates expected heavy PC game playing over the next few years, and subsequent accessory purchases. Q1 estimate advantage shipment mixes high-margin products, leading to record high gross margins in both our segments, a 39.1% on Gaming segment and 25.9% in our Component segment.” He did caution not to expect these margins every subsequent quarter, despite high conviction that it can be met and surpassed. He set the bar high then lowered it a bit. He also added, “We’re very pleased to see that in Q1, we were the number one market share position in every gaming components category that NVD monitors in the U.S., which is our largest market.” The growth in home broadcasting has driven Corsair to become the market leader in video capture cards and lighting in addition to its Wave microphone gaining market share. The Company has gained a 28% market share in gaming PC cases. The Company had “rapid sales” of its pre-built PC systems including both the ORIGIN PC and CORSAIR VENGEANCE PC. He concluded, “… we’ll be adding significant resources to the company this year, both in marketing and R&D as well as infrastructure as we move towards a $2 billion revenue number.”
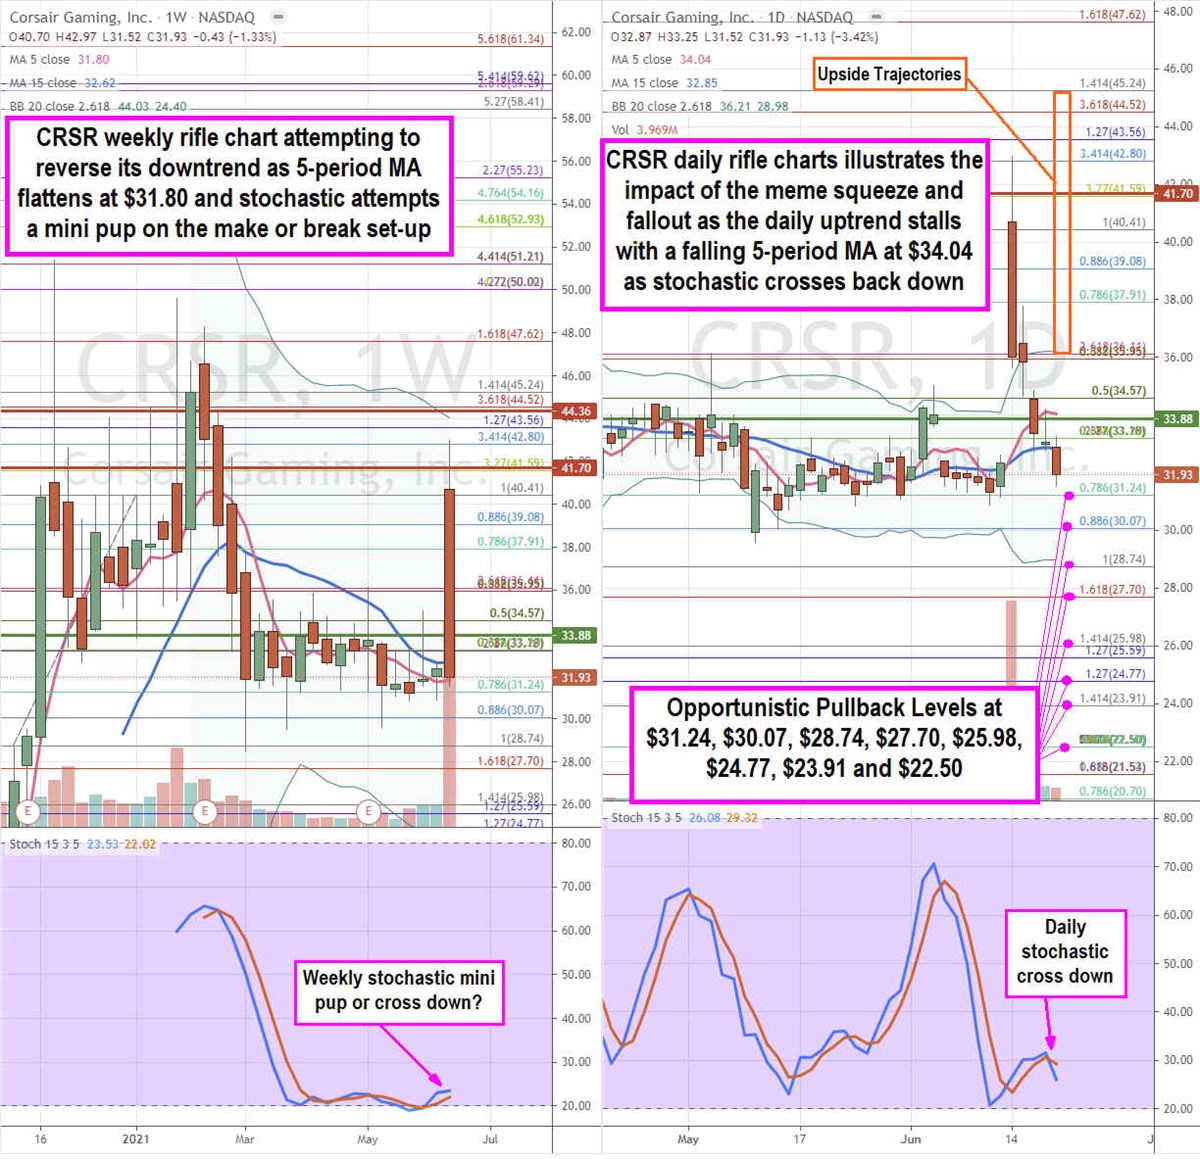
CRSR Opportunistic Pullback Levels
Using the rifle charts on the weekly and daily time frames provides a broader view of the playing field for CRSR shares. The weekly rifle chart shows the extreme spike that caused shares to short-squeeze and peak back under the $42.80 Fibonacci (fib) level. This paused the weekly downtrend as the 5-period moving average (MA) went flat at $31.80 along with the 15-period MA at $32.62. The weekly stochastic crossed up and is stalling on the price pullback. From here it can form a bullish mini pup above the weekly 5-period MA or breakdown if it crosses back down. The weekly also formed a market structure high (MSH) sell trigger with shares fell under the $44.36 level. The weekly upper Bollinger Bands sit at $44.03. The daily rifle chart was uptrending until the steep price collapse that trigger a daily MSH sell trigger under $41.70. The daily market structure low (MSL) buy triggers $33.88. The daily stochastic has crossed down under the 30-band as recent upside momentum reversed sharply as shares fell under the daily 5-period MA support at $34.04 and 15-period MA last support at $32.85. Prudent investors can monitor for opportunistic pullback levels at the $31.24 fib, $30.07 fib, $28.74 fib, $27.70 fib, $23.91 fib, and the $22.50 super fib. The upside trajectories range from the $36.11 fib up towards the $45.24 fib level.
Featured Article: What is meant by a buy rating?