Kavita Jain, Sr Equity Research Analyst, Arihant Capital Markets Ltd thinks the Nifty, which has been on a record-smashing spree, is not done yet. After going past its previous high of 15,431 on the weekly chart, it formed a bullish continuation rounding bottom formation, which leads to the projection of the 16,600-mark on the index, Jain says.
In an interview to Moneycontrol’s Kshitij Anand, she says if the Nifty manages to hold above 15,700 in the coming week, then 15,850-15,930 will be the immediate resistance and a sharp increase will take it to the next resistance mark of 16,000. Edited excerpts:
It was a historic week for Indian markets as the Nifty surpassed the crucial 15,700 level intraday. What led to the price action?
In the previous week, equity benchmark Nifty50 scaled up to a fresh new lifetime high of 15,733.60 and settled at 15,670.25—a gain of more than 1.5 percent on a week-on-week basis.
It is the sixth consecutive week where the Nifty closed higher except a week in between. The broader market outperformed the benchmark—the Nifty midcap 100 rose 3.3 percent and the smallcap 100 was up by 2.4 percent.
FII turned positive and were net buyers of Rs 7,998.96 crore in the past week and the RBI policy delivered what the economy needed for now, which is to continue pumping in liquidity in the market.
Companies like Motherson Sumi and Bharat Forge reported a strong set of numbers. PNB Housing deal with the Carlyle Group fuelled up the entire housing sector.
Nifty realty (+6.7 percent), metal (+5.6 percent), and CPSE (+4.9 percent) were the top three sector gainers, whereas Nifty IT was on the back foot as it closed marginally lower by (-0.5 percent).
After hitting a record high of 15,733 on June 4 the Nifty saw profit-booking after the RBI policy. Can we say that we might have hit a top? Are there any signs on the chart?
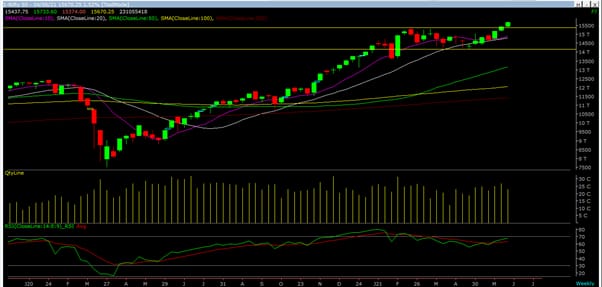
On a weekly chart, the Nifty50 witnessed a breakout above its previous high of 15,431 and formed a bullish continuation rounding bottom formation, which leads to the projection of 16,600-mark on the index.
The target could well be achieved in the next quarter. The leading indicator RSI is at 67.99. On a daily chart, a small red candle was formed that signifies profit-booking in June 4 trading session.
The Nifty50 continues to hold its major uptrend of higher high-higher bottom formation, and any decline should be taken as buying opportunity in the next week as long as the Nifty50 holds above its 15,430 support level.
Sectorally, BSE realty and consumer durables were the top gainers. What led to the price action?
In the wake of decreasing coronavirus new cases and massive vaccination drive underway, economic activity is expected to gain momentum.
Also, with the announcement of unlocking in a staggered manner by the various states, there is the hope of an increase in pent-up demand in the realty and consumer durable sectors. However, growth will not be that phenomenal that people start stocking the things as in the case of the previous unlock.
If we look at the BSE realty index, it is already underperforming and in the long consolidation phase of the last 10 years.
More companies are expanding their remote working policies and continue work from home. This will lead to more space requirement, whereas a spike in summer temperature will aid in sales of cooling products.
Which are the important levels to track in the coming week on the Nifty?
On the derivatives front, the Nifty50 holds the highest OI in call options at a strike of 15,700 followed by 15,800-15,900 and in the put options at the strike of 15,500 followed by 15,400.
Thus, in the coming week if the Nifty50 manages to hold above 15,700 levels then 15,850-15,930 will be immediate resistance levels, and any sharp increase will lead up it to the next resistance mark of 16,000.
On the downside, 15,437-15,374 will act as immediate support levels, and any sharp decline will lead it up to 15,250 levels.
Small & midcaps have outperformed. What is fuelling the rally in the broader market space?
The rally between the years 2018 and 2020 was largely driven by largecaps and the fall was ferocious among smallcaps, which were down by 80-90 percent. Fast forward to 2021—small & midcaps are playing catch-up.
Also, the first part of the rally was majorly contributed by the pharma and chemical sectors. Now in the hope of an increase in pent-up demand and government support sectors like real estate, metals, infra, and capital goods have also started contributing.
Top three-five trading strategies for the next three-four weeks?
Here is a list of stocks for the next 3-4 weeks:
Tata Chemical: Buy| LTP: Rs 746| Target: Rs 790-820| Stop Loss: Rs 700| Upside 10%
The counter is witnessing a breakout above its downward sloping channel resistance on the daily chart amid rising volume.
Leading indicator RSI is placed at 60 which is showing further price strength. On a higher time frame, a counter formed a Morning Star pattern, which is a bullish reversal candlestick pattern.
The support for the stock is heading towards its previous highs of Rs 790-820.
The counter is witnessing a breakout from its downward sloping channel resistance on the daily chart.
On a higher time frame, the counter has formed a base towards its previous support of 2440 and closed above the 10-weeks period SMA. Leading indicator RSI is standing at 58.52 levels and MACD Histogram is also showing strength.
NMDC: Buy| LTP: Rs 193.30| Target: Rs 204-212| Stop Loss: Rs 179| Upside 10%
On the weekly chart, the counter is placed above all its moving averages after two weeks of correction from the highs of 212.
It has formed a Morning Star with rising volume and long built-up with rising price and OI in the derivative segment, too. One can add NMDC on decline up to 185 for the possible target of 204-212 in the next two weeks.
Disclaimer: The views and investment tips expressed by experts on Moneycontrol.com are their own and not those of the website or its management. Moneycontrol.com advises users to check with certified experts before taking any investment decisions.