2 Stocks Nearing The End Of A Pattern: Technicals To Watch For Next Week

Carlotz Inc. (NASDAQ:LOTZ) and Peloton Interactive Inc. (NASDAQ:PTON) both made big moves Wednesday.
Carlotz closed up 7.23% at $7.05 and Peloton closed down 6.14% at $99.96. Peloton stock lost ground amid a class action lawsuit filed in a California federal court.
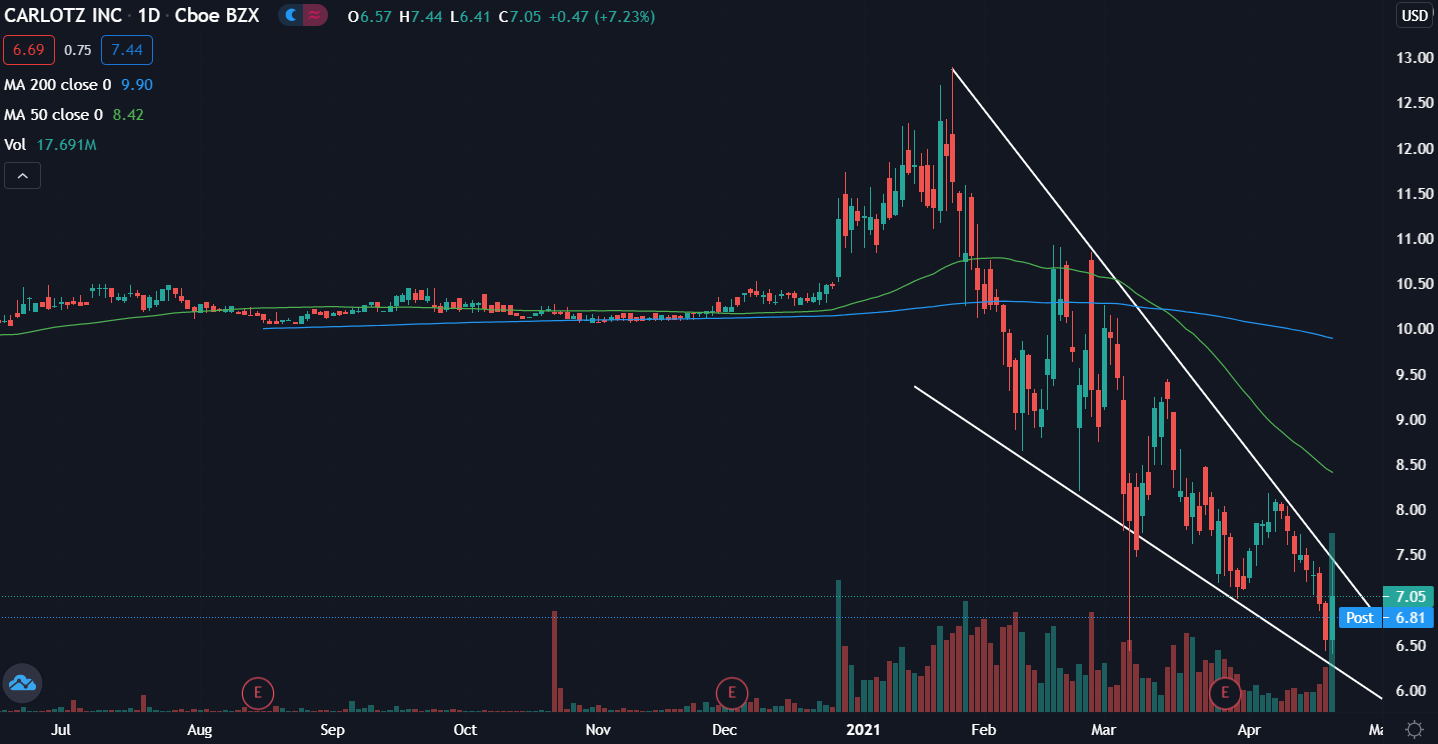
Carlotz Daily Chart Analysis
- Carlotz is nearing the end of what technical traders would call a falling wedge pattern.
- The stock is trading below both the 50-day moving average (green) as well as the 200-day moving average (blue), indicating sentiment in the stock has been bearish recently.
- These moving averages may both hold as a resistance level in the future.
Key Carlotz Technical Levels To Watch
- The stock has been falling in recent months, forming what technical traders call a falling wedge pattern.
- This pattern is considered a bullish reversal pattern as connecting the highs shows a much steeper drop compared to connecting the lows of the chart, forming a wedge.
- A break above the line connecting the highs may signal the stock is changing trends and ready to start heading back up.
- A break below the line connecting the lows could bring about a stronger downward push.
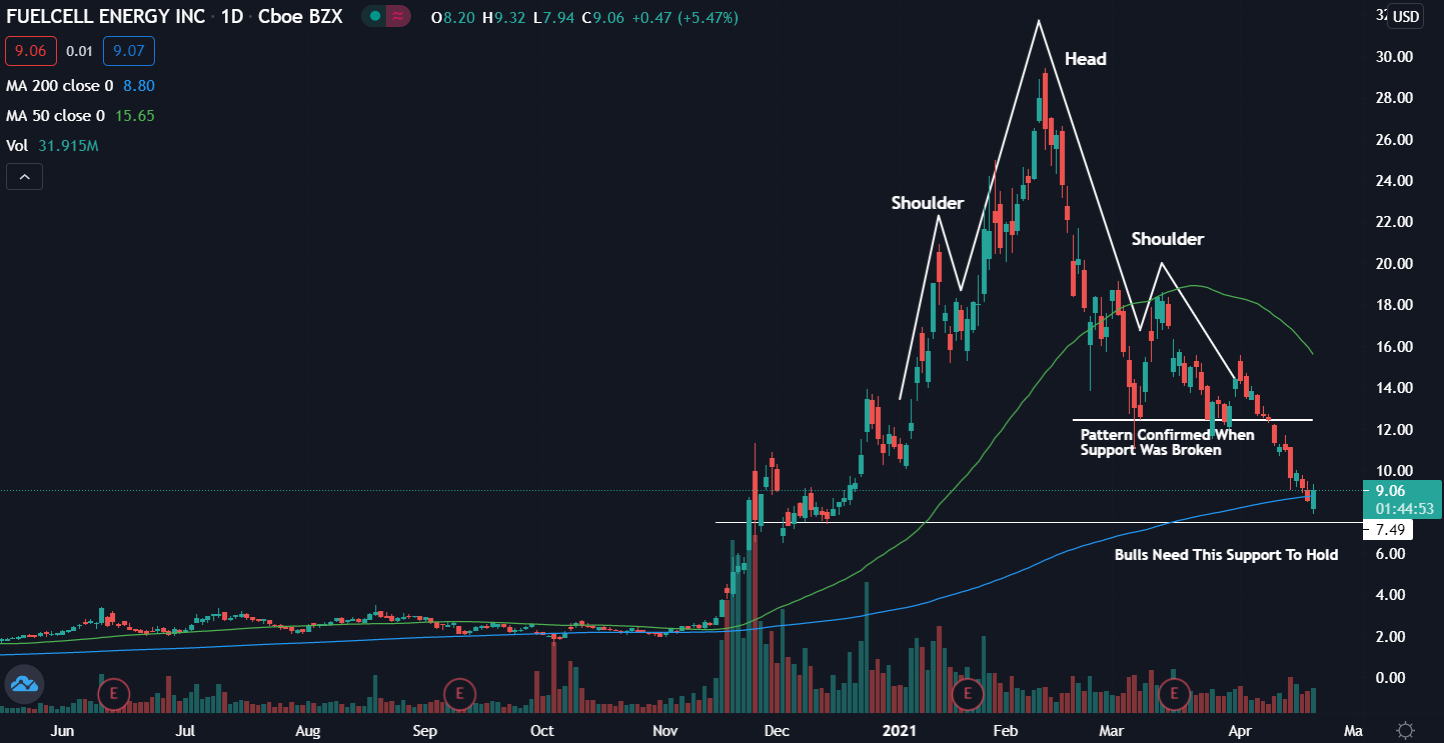
Peloton Daily Chart Analysis
- Peloton looks to be forming a head-and-shoulders pattern and is now nearing another key support level.
- The stock is trading below both the 50-day moving average (green) as well as the 200-day moving average (blue), indicating sentiment in the stock has been bearish recently.
- These moving averages may both hold as a resistance level in the future.
Key Peloton Levels To Watch
- The head-and-shoulders pattern occurs after the stock pulls back steeply and buyers are unable to push the price to new highs.
- This bearish reversal pattern can be confirmed when the price is able to cross below the support levels previously formed by buyers. This line may be considered the dropoff line.
- The $100 level is an area where the stock has been able to find buyers. Bulls are looking to see the price bounce here and move higher.
- Bearish traders would like to see this support level fail to hold.
Photo courtesy of Peloton.
© 2021 Benzinga.com. Benzinga does not provide investment advice. All rights reserved.