
The iShares Silver Trust ETF is trading under pressure and the instrument has lost more than 17% of its value since August 10th, 2020.
However, irrational exuberance in stock markets, a negative unemployment trend in the U.S., and an alarming surge in U.S. money supply could help SLV to break above prior highs.
As a potential breakout trigger, we will be watching the $24 level because we think that a sustained bullish move here could extend into a much wider rally heading into 2021.
Since August 10th, 2020, the iShares Silver Trust ETF (NYSEARCA: SLV) has traded under pressure and the ticker has lost more than 17% of its value in less than four months. In many ways, these bearish trends might be surprising for investors, given the broader coronavirus-related uncertainties that still exist throughout the global markets.
Historically, precious metals assets have shown clear safe-haven properties during times of macroeconomic turmoil. Of course, this is why it might be difficult to see why instruments like the iShares Silver Trust ETF could be falling amidst the backdrop of a devastating pandemic.
But while it seems that the rest of the market has taken a bullish view on the market at large (i.e. equities and other risk assets), we think that the current trend cycle is running out of steam and that SLV should start outperforming the S&P 500 (once again) as we start trading in 2021.
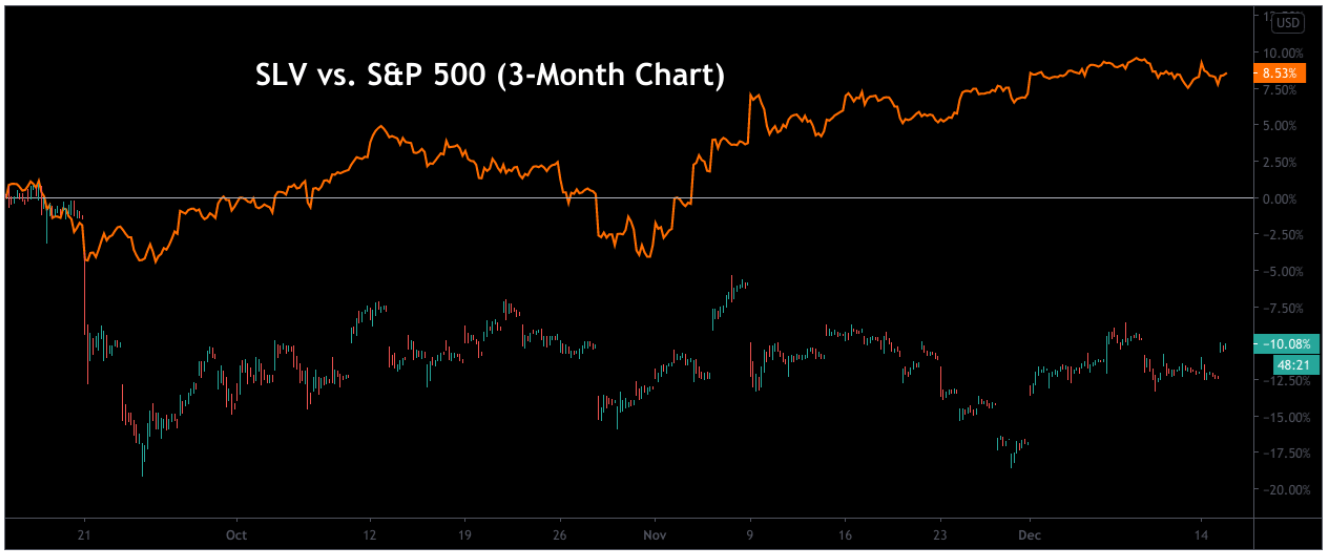
Source: Author via TradingView
Price chart activity displayed above shows us how widely these trends have unfolded during the last three-month period. In mid-September, the iShares Silver Trust ETF began to diverge sharply as earnings optimism.
Additionally, a decline in coronavirus deaths brought the market’s attention right back to equities markets. Since then, the iShares Silver Trust ETF has traded sideways to lower while most of the major stock benchmarks are surging near record highs.
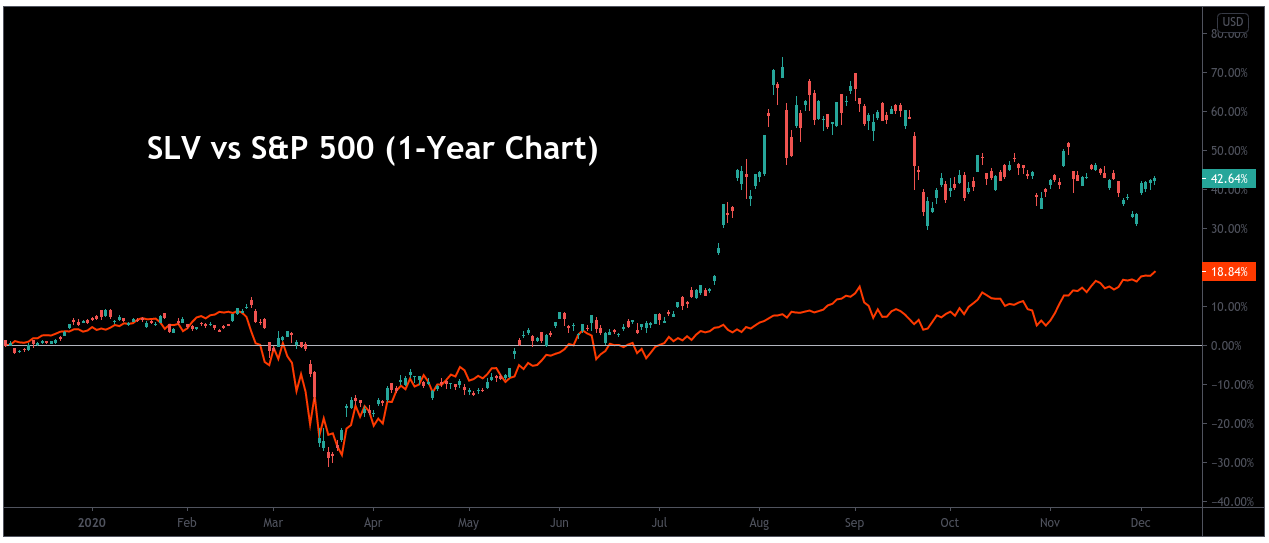
Source: Author via TradingView
However, we think this is a situation in which time frames really matter. If we pull out to a one-year chart history, we can see that an even wider divergence becomes visible (and actually works in the opposing direction).
In our view, this perspective is much more accurate in terms of the ways it highlights the true market trends that have emerged as a result of the coronavirus pandemic (and its significant impact on the economy).
Valuations in the iShares Silver Trust ETF really began to surge in June, and here we can see that the recent declines (post-August) actually make up a somewhat insignificant portion of the broader rally.
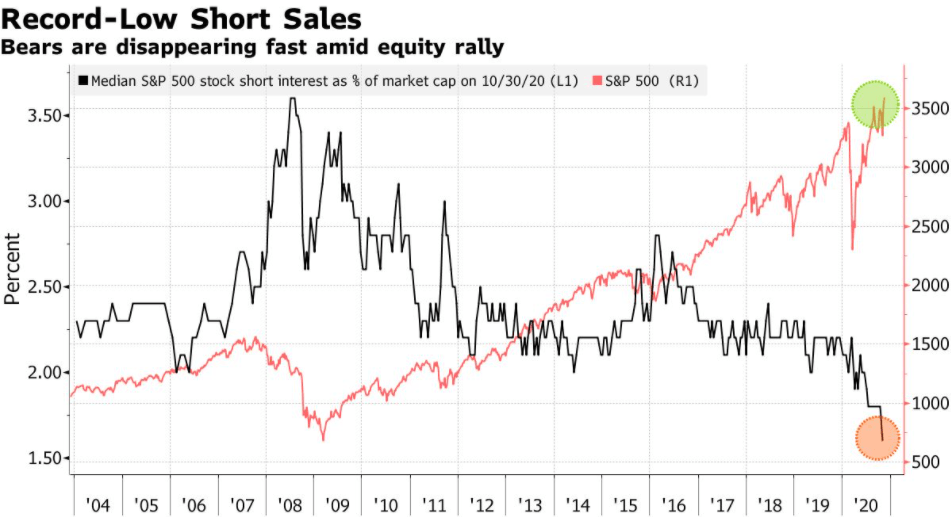
Source: Bloomberg
However, we think that there are fundamental reasons which explain why these trends are unlikely to continue much longer. Specifically, we can see that the number of short sellers in equities markets has recently reached record-low levels.
Since 2016, the median S&P 500 short stock interest as a percentage of market-cap has fallen to levels that are far below the averages posted during the Trump administration and this is significant because the stock market traded strongly in bullish territory for most of this period.
In most cases, one might not expect to see short sellers emerge at a time when the national unemployment rate trended below 4%. Yet, in spite of all of these negatives, market sentiment remains largely bullish.
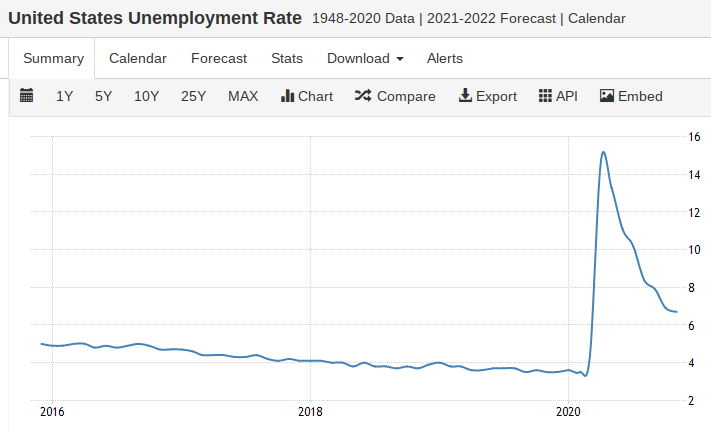
Source: Trading Economics
In this chart, we have a clear visual example of how economics and the financial markets will inevitably intersect with the rest of the natural world once a paradigm-shifting event has occurred.
After the initial spike in unemployment in the United States, we have settled at levels that are far above what we saw during the pre-coronavirus period.
Source: Trading Economics
In response to the changes that are present in the nation’s long-term unemployment rate, it seems that we can reasonably expect some sort of stimulus legislation at some stage and it’s hard to see how this wouldn’t have a deflationary impact on the underlying currency.
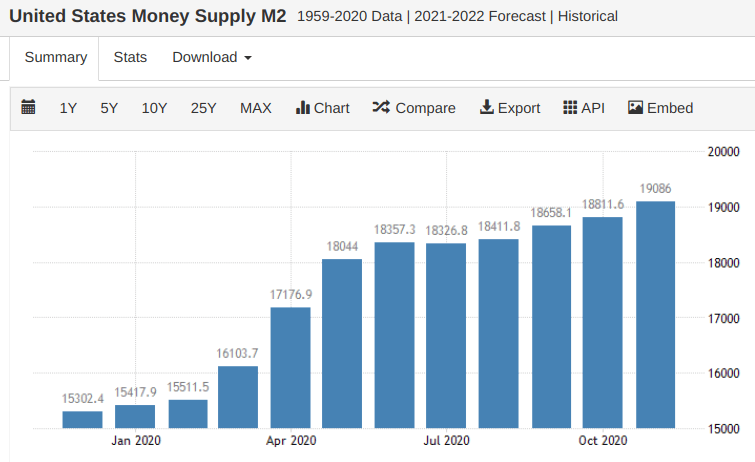
In the chart above, we can see yet another example of the ways this coronavirus pandemic has had a clearly definable impact on the U.S. economy. In November, M2 money supply in the United States rose to over $19 trillion in a trend that has expanded dramatically in 2020.
Source: ETFdb
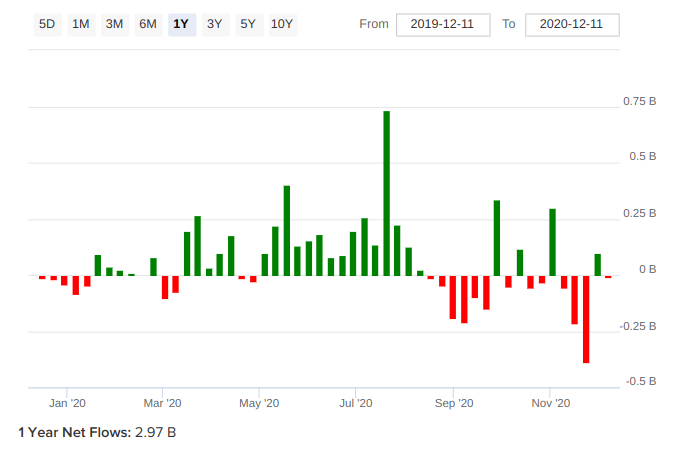
Not surprisingly, these trends have had an effect on valuations in precious metals assets and this largely explains why the iShares Silver Trust ETF has seen net flows of $2.97 billion over the last one-year period.
Of course, we do see selling pressures that are weighted after the September trading period, but we think these activities could be related to profit-taking by investors that are trimming positions following incredible gains.
Remember, even with these recent declines, the iShares Silver Trust ETF is still sitting on 2020 gains of more than 36% and this more than doubles the 2020 results seen in the S&P 500 (13.6% gains).
Source: Author via TradingView
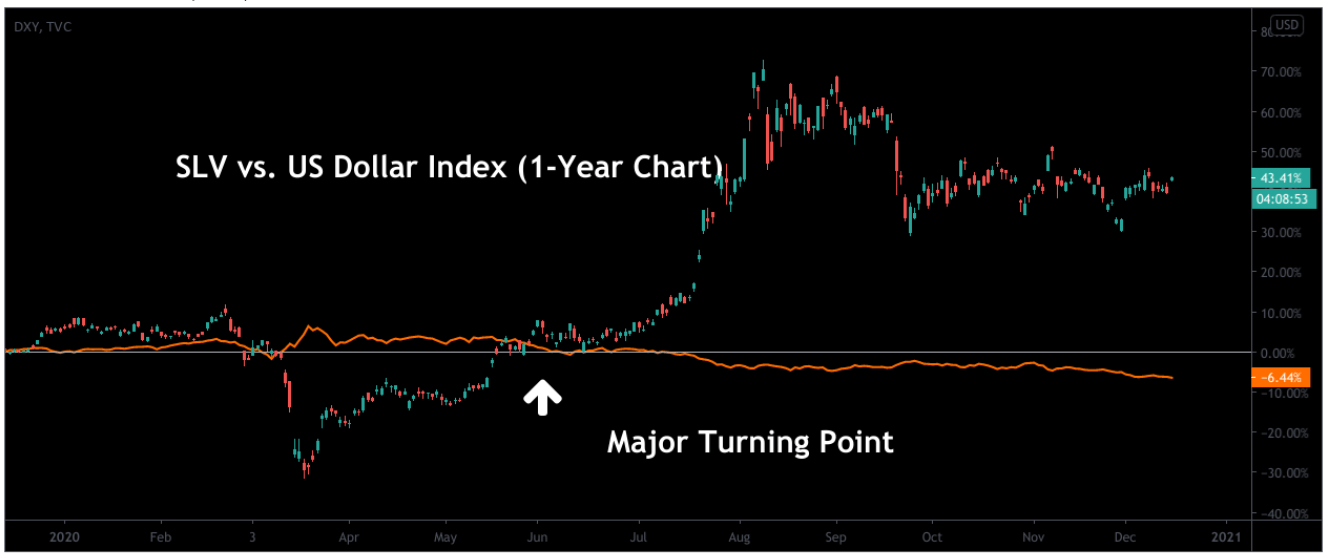
Finally, we’d like to look at the major turning point in the relative trend activity of the U.S. Dollar Index and the iShares Silver Trust ETF. Currency markets have also been influenced by all of this year’s events, but relative valuations in these areas have been ignored while many important asset classes (even bitcoin) have reached their new record highs.
Specifically, trends in the U.S. dollar are what directly determine valuations that we use to base trades. As we can see, even with SLV’s recent declines, trend activity has decisively changed in ways that clearly favor the iShares Silver Trust ETF and these lower valuations might be viewed as a highly attractive entry point for new positions.
Source: Author via TradingView
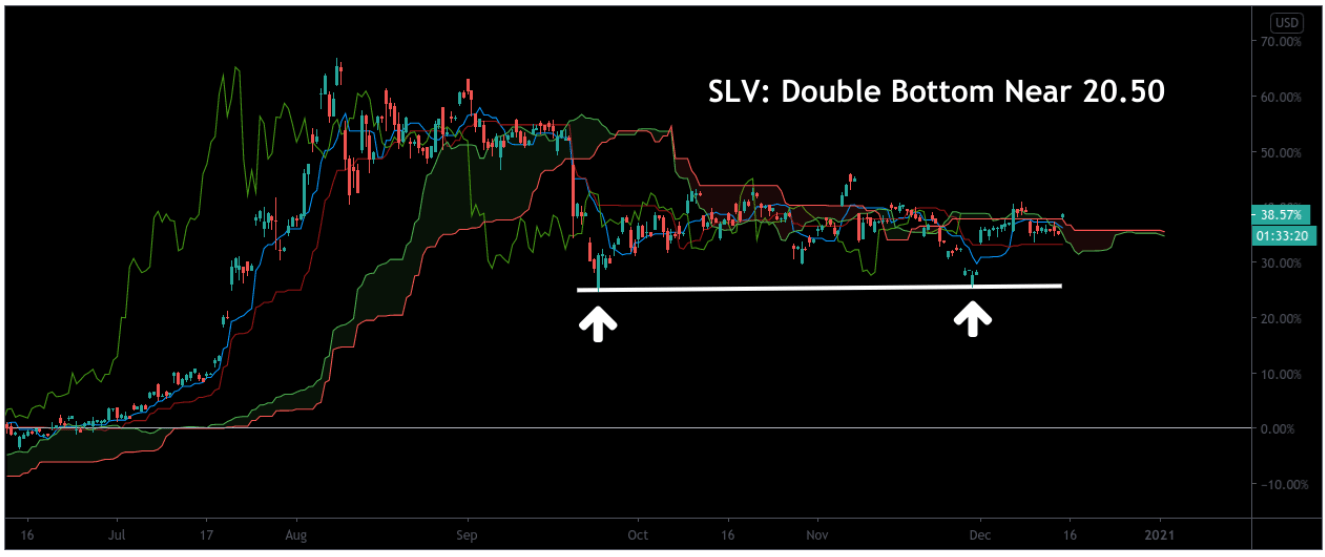
As a potential breakout trigger, we will be watching the $24 level because we think that a sustained bullish move here could extend into a much wider breakout. To the downside, we are watching support levels at $20.50 as an area that can be used when placing stop loss orders (due to the fact that a negative break here would change the outlook and favor the bearish direction).
Now that markets have managed to find a clear psychological foothold above the 20-handle, any build in upward momentum shouldn’t find much difficulty extending into the 30-handle. If this occurs, we think it could have a major impact on broader sentiment. For these reasons, we are very bullish on SLV and we think a clear breakout above $24 could be followed by an acceleration in upward momentum heading into 2021.
Thank you for reading. Now, it's time to make your voice heard.
Reader interaction is the most important part of the investment learning process. Comments are highly encouraged! We look forward to reading your viewpoints.
Disclosure: I am/we are long SLV. I wrote this article myself, and it expresses my own opinions. I am not receiving compensation for it (other than from Seeking Alpha). I have no business relationship with any company whose stock is mentioned in this article.
