iShares MSCI USA Value Factor ETF: Exploring Its Value Credentials

The value score of VLUE's tracking index is flawed, incomplete, and lacks ample disclosure.
The valuations of the top-10 are expensive from a P/E basis, but not so from a P/BV, EV/CFO, and Dividend yield basis.
The overall weighted average P/E does not justify the earnings potential of these companies.
On the charts, the ETF is close to hitting a key resistance zone.
Introduction
Value-factor investing has been around in some shape or form for decades now, but financial research professionals cannot disregard the role of this seminal paper (published in 1992) by Eugene Fama and Kenneth French, which helped bring some structure and greater adoptability within the investment world; since then, considerably more value factor-based investment vehicles have proliferated the investment landscape. Unfortunately, the last decade has been quite brutal for those following this form of factor investing, with the value-factor producing negative alpha in nine out of the last ten years. Personally, I believe single-factor investing methodologies are fraught with significant risk, and I would rather gravitate to a multi-factor model. Alternatively, investors may also be better served by pursuing time diversification - varying the factor exposures according to the investment time horizon. Regardless, I acknowledge that many value-factor-based investment enthusiasts are exploring suitable options, and this article - which will primarily focus on the iShares MSCI USA Value factor ETF (BATS:VLUE) - is meant for them.
Profile
VLUE is the largest ETF in the US value-factor space with an AUM of over $9bn. With regards to the other big ETF players (Vanguard, Fidelity), it is also the oldest, having been around since 2013 (smaller names such as FAB have been around since 2007). An investment in this ETF will give you exposure to more than 150 large- and mid-cap US stocks with relatively lower valuations. Access to this ETF is comparatively cheap with an expense ratio of 0.15%, which is cheaper than the Fidelity alternative - FVAL, but just falls short of the Vanguard option - VFVA, which has an expense ratio of 0.14% (What's interesting is that VFVA's expense ratio is lower despite it being an actively managed fund, whilst VLUE and FAB are passively managed). With VLUE you also get a useful yield of 2.44%, which is higher than what FVAL (1.7%) or VFVA (2.07%) offer. Dividends for VLUE have grown at 17% CAGR over the last five years, although do note that this year, the payouts have been cut over the last two quarters (Q2:-33% YoY, Q3: -13% YoY).
Ascertaining VLUE's value credentials
After studying the prospectus provided by iShares, I have to admit that there are some flaws with regards to the methodology followed by VLUE/MSCI to determine value; there are also some disclosure gaps (explained below).
VLUE tracks the MSCI USA Enhanced Value Index (which is known as the underlying index) which is, in turn, a derivative of another called the MSCI USA Index (the parent index). This parent index is a market-cap weighted index that tracks the performance of the top 85% (by market-cap) stocks listed on stock exchanges in the US. The underlying index - MSCI USA Enhanced Value Index - picks out stocks from the parent index that exhibit value style characteristics. The value style is a function of a value score, which measures securities in the parent index based on three parameters - 1) Price-to-book value (P/BV), 2) Price to forward earnings (Fwd. P/E), and 3) Enterprise Value to Cash Flow from Operations (EV/CFO). The value score is then multiplied by the component's market cap to determine the respective weight in the index.
Here are some of the problems I have with the methodology, the disclosures, and perhaps even the timing of considering an entry now:
1) Firstly, it remains questionable if a market-cap-oriented base index is the best way to determine value, as prima facie, the top-tier firms here, are those that have already seen a significant expansion in the market cap (thus reducing the scope of further outsized value).
2) There is no disclosure with regards to the weight allocated to each value parameter; for instance, are these parameters equally weighted, or is there more weight for one multiple based on the sector in question? If it is equally weighted, then there are serious flaws here, as a multiple such as the EV/CFO is quite pointless whilst measuring the value of financial stocks (which constitutes 10% of VLUE's holdings), as EVs will be bloated on account of the elevated debt in the capital structure. In contrast to this, the way FVAL goes about its value score makes more sense, and there is also better disclosure at Fidelity. FVAL uses four components of value for normal stocks with equal weights of 25% for all - FCF Yield, EBITDA/EV, Tangible book value/price, and Forward 12m earnings/price. For banking stocks, value is determined separately, based on equal weights for Tangible book value/price and the Forward 12m earnings/price yield.
3) There is no clarity on whether the ranking of these value multiples are based on a comparison to the sector median/average, a comparison to historical averages, or on an absolute basis.
4) The dividend angle is a central tenet of value factor investing, and any methodology that fails to consider this aspect feels incomplete. VLUE/MSCI makes no consideration of dividends in determining their value score.
5) MSCI mentions that it uses an algorithm to determine the "number" of constituents that make up the underlying index relative to the parent index. But there is no clarity on what drives this algorithm and how they determine if the number of holdings should be 140 in any given year or 150, etc.
6) Weights in the index are rebalanced semi-annually and from what I can glean from the prospectus, the rebalancing was last done four months back, on July 31st, implying that the next rebalancing will be carried out sometime before Jan 31st (no specific date has been mentioned on the website or the prospectus). Since the start of August, several stocks and sectors have seen significant expansion in their market caps (with fundamentals yet to keep pace) and I remain doubtful if the portfolio weights of VLUE as they stand currently represent the best indication of value. For instance, the tech sector in VLUE has an outsized weight of 29%, almost twice that of the next largest sector - healthcare at 15%. Perhaps a better time to consider an entry in VLUE would be once the annual rebalancing is done.
The top-10 stocks of VLUE hold quite an important weight of c.35% of the overall portfolio, and some of these major holdings have moved up quite a bit over the last 3-4 months (the likes of MU, GM, etc. are up by 36%-62% over the last three months). In light of this, I also thought it would make sense to get some sense of value relative to the historical multiples. In addition to VLUE's standard value measurements of P/E, PBV, and EV/CFO, I've also looked at the current yield relative to historical standards.
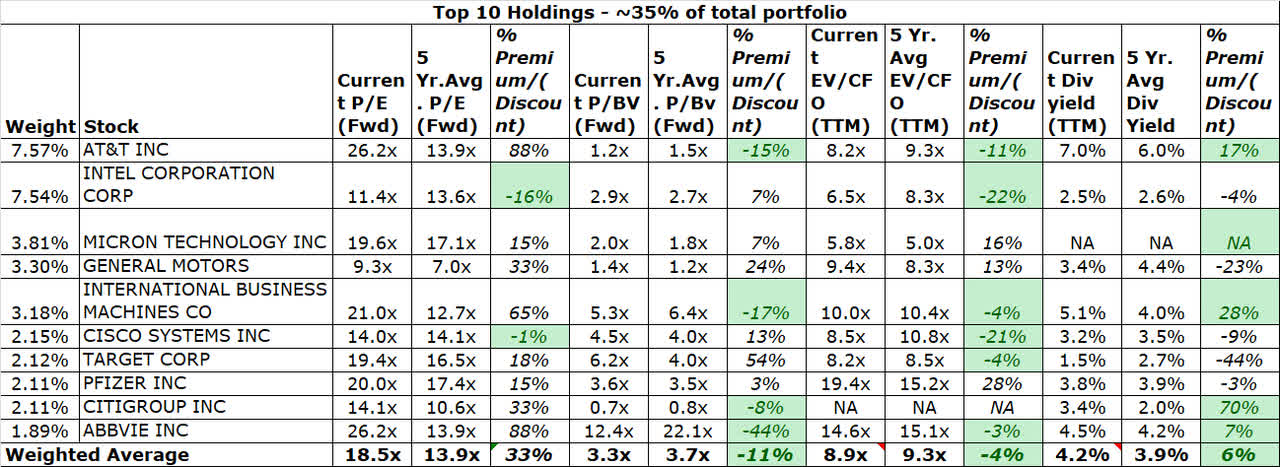
Source: Prepared by the writer using data from YCharts and Seeking Alpha
As you can see from the table above, on a forward P/E basis, most of these stocks are trading at a premium to historical averages (INTC and CSCO are the only exceptions) with the weighted average multiple of the top-10 trading at a c.33x premium to its historical average. From a P/BV perspective, things are less expensive, with the weighted average multiple coming in at a discount of 11% to its historical average. On an EV/CFO basis too, more stocks are trading at a discount, taking the overall multiple to 8.9x, c.4% lower than the historical average. Finally, on the dividend yield front too, things are looking fairly attractive, with the majority of these stocks seeing higher yields currently relative to history. To sum up, the P/E situation does not look ideal, but with regards to the other metrics, I don't think one can have too many complaints.
Looking beyond the top-10, I also looked at the weighted average P/E of the whole ETF; as per YCharts, this currently stands at 17x P/E. Relative to the benchmark indices which are trading at 38-42x, this sure does look cheap, but you also have to consider that the average earnings of VLUE's constituents for the next year are forecasted to decline by 2.5%, and forecasted to only grow by 7.5% over the next five years (Source: YCharts). I'm not sure paying 17x P/E for stocks that are only expected to grow earnings by c.7.5% in the foreseeable future is a great option.
Price action and closing thoughts
On the charts, from 2014 to 2017, VLUE had been trending up in the form of an ascending channel; then there was some accumulation at the higher levels until March-2020 where it fell below its multi-year channel boundary below the $78 levels. After a few months of consolidation at the lower levels ($70-$76), VLUE managed to bounce back into its old channel last month, but there is a major hurdle ahead (yellow highlighted area) which will not be easy to breach, as this zone has served as a resistance point multiple times over the last three years (Jan-2018, Sept-2018 and Jan-2020).
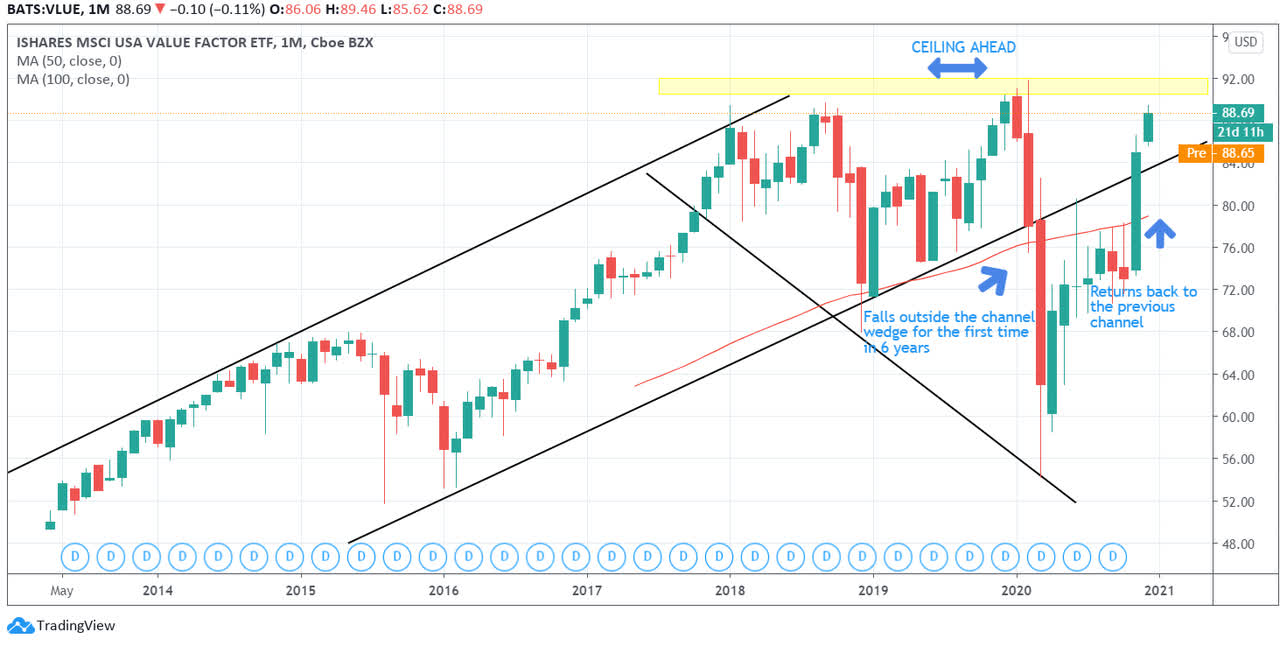
Source: Trading View
As mentioned in the introduction section, value factor investing has been a great source of distress for investors over the last decade. If you are still adamant about getting into this segment, VLUE is not something I would advise you to pursue; there are some flaws with regards to how VLUE's value score is computed, and its disclosures too are sub-par. I also believe the current timing for an entry is not ideal. Alternatively, investors may consider FVAL or VFVA, but please do your own due diligence before pursuing an investment, as the latter too has some significant disclosure issues with regards to how it calculates its value score.
Disclosure: I/we have no positions in any stocks mentioned, and no plans to initiate any positions within the next 72 hours. I wrote this article myself, and it expresses my own opinions. I am not receiving compensation for it (other than from Seeking Alpha). I have no business relationship with any company whose stock is mentioned in this article.
