
186/5
(20.0) RR 9.3


Australia beat India by 12 runs
India beat Australia by 6 wickets


03:30 IST - Wellington
09:30 IST - Adelaide

11:30 IST - Auckland
11:30 IST - Hamilton
11:30 IST - Napier


13:30 IST - Centurion
05:00 IST - Melbourne
03:30 IST - Mount Maunganui
13:30 IST - Johannesburg
03:30 IST - Christchurch
05:00 IST - Sydney
05:30 IST - Brisbane


11:30 IST - Abu Dhabi
11:30 IST - Abu Dhabi
11:30 IST - Abu Dhabi
11:30 IST - Christchurch
06:30 IST - Dunedin
11:30 IST - Wellington
11:30 IST - Auckland
06:30 IST - Mount Maunganui

03:30 IST - Dunedin
06:30 IST - Christchurch
03:30 IST - Wellington
11:30 IST - Napier
11:30 IST - Auckland
06:30 IST - Hamilton

18:30 IST - Chester-le-Street
18:30 IST - London
18:30 IST - Bristol
18:30 IST - Cardiff
18:30 IST - London
18:30 IST - Birmingham
22:30 IST - Nottingham
22:30 IST - Leeds
22:30 IST - Manchester
14:30 IST - Nottingham
14:30 IST - London
14:30 IST - Leeds
14:30 IST - London
14:30 IST - Manchester
18:30 IST - Karachi
18:30 IST - Karachi
India beat Australia 2-1 in the three-match T20I series - a great result for the visiting team after the 2-1 defeat in the ODIs and just ahead of the highly anticipated Test series.
India beat Australia 2-1 in the three-match T20I series - a great result for the visiting team after the 2-1 defeat in the ODIs and just ahead of the highly anticipated Test series. There were many standout performances from both teams during the series. We look at some of the numbers which defined the series.
Also read: Parthiv Patel Announces Retirement From All Forms of Cricket
2-1: The Series Scoreline in India's Favour
India won their second T20I series in Australia after the 3-0 sweep Down Under in 2016. On the other hand, it was Australia's first series' loss at home since the defeat against Sri Lanka in 2017.
60.55 vs 28.64: Batting Average of Top 7 of India in Wins in 2016 and 2020
It was a more dominating performance by the top and middle order in 2016. India's collective strike rate (top 7) was also higher in 2016 (150.96 vs 139.94).
6 and 6.91: Natarjan's Wickets Tally and Economy Rate
T Natarajan was India's actual Player of the Series. He was the highest wicket-taker of the series with 6 wickets at 13.83 apiece. He was also the most economical bowler for India with an economy rate of 6.91.

Natarjan returned with 3-30 in 4 overs on T20I debut in Canberra which included the wickets of Maxwell and Short. He showcased his entire repertoire in the second T20I at the SCG and was exceptionally restrictive conceding at just 5 runs per over (20 runs in his 4 overs) in a high-scoring encounter where the other Indian bowlers had been hammered at an economy rate of 10.81. He again picked two crucial wickets. Natarajan was again the most economical Indian bowler in the defeat in the final T20I in Sydney.
145: Matthew Wade's Aggregate in the Series
It was the highest for any batsman from both the teams. Wade scored 145 runs in 3 matches at a strike rate of 154.25. Wade has scored 234 runs at a strike rate of 156 opening the innings in 5 matches for Australia.
17: The Number of Fours Hit by Matthew Wade in the Series
It was, by far, the highest in the series. The second highest on this count were Kohli, Dhawan and Rahul with 7 fours each.
12 & 48: The Aggregate of Iyer and Samson in the Series
Shreyas Iyer and Sanju Samson were two big disappointments for India in the series. While Iyer managed just 12 runs in the two matches he played, Samson got an opportunity in all three, got starts but failed to convert them into substantial scores - he aggregated just 48 runs in the series.
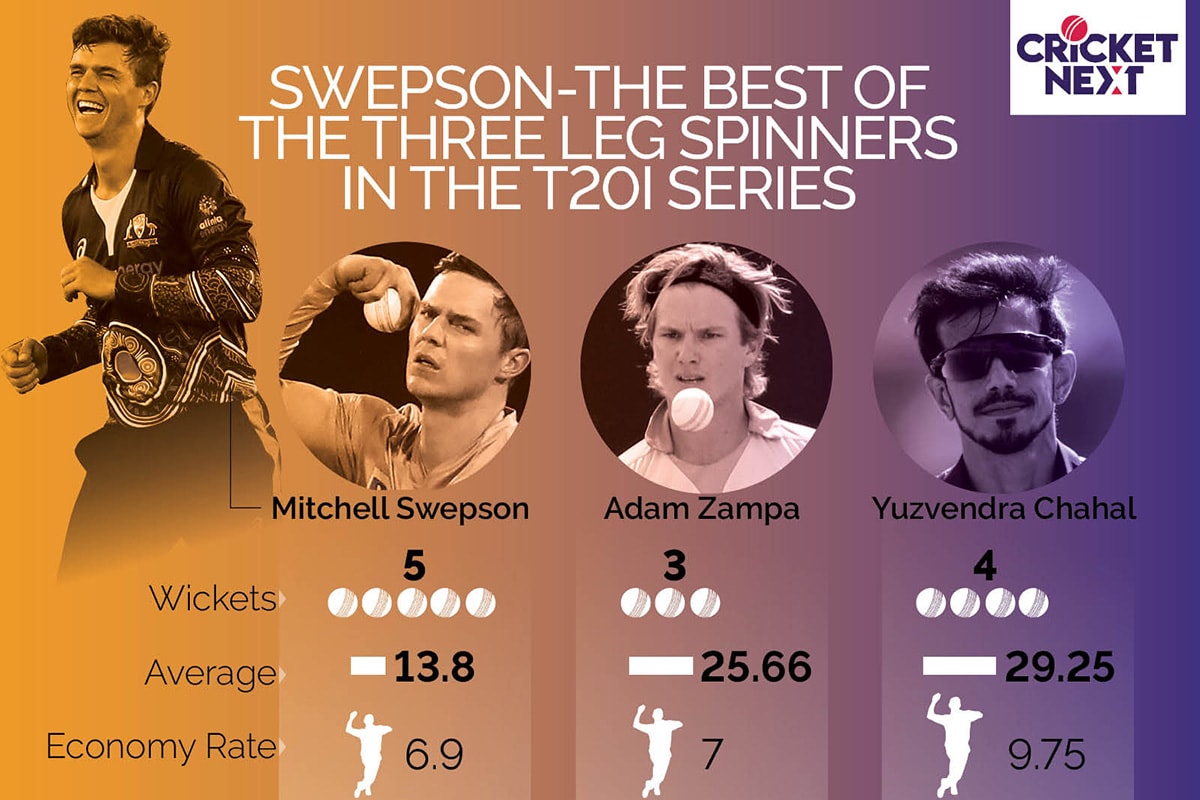
5 & 6.9: The Number of Wickets and Economy Rate for Mitchell Swepson in the Series
Mitchell Swepson outdid his two more famous counterparts in the series. He picked 5 wickets at 13.8 apiece at an economy rate of just 6.9 and was instrumental in stemming the flow of runs and picking wickets in the middle overs for Australia. In comparison, Adam Zampa picked 3 wickets at an economy of 7 while Yuzvendra Chahal accounted for 4 but was expensive conceding at 9.75 runs per over.
7.08: The Economy Rate of Washington Sundar in the Series
Washington Sundar continued to impress with his off-spin in the series. He was again very restrictive with an economy rate of just 7.08 - remarkable as he also bowls in the powerplay. Sundar was brilliant in the IPL 2020 - he was the second-most restrictive bowler of the tournament (after Rashid Khan) and had an economy rate of just 5.96.
156: Hardik Pandya's Strike Rate in the Series
It was the highest for any batsman (min.50 runs) in the series.
| Rank | Team | Points | Rating |
|---|---|---|---|
| 1 | England | 6877 | 275 |
| 2 | Australia | 6481 | 270 |
| 3 | India | 9966 | 269 |
| 4 | Pakistan | 6824 | 262 |
| 5 | South Africa | 5047 | 252 |
| FULL Ranking | |||


