Principal Real Estate Income Fund Is In Tough Sector With Tax Loss Selling Pressure, But Looks Cheap

The fund is one of the worst performers in the last year having lost half of its value and deleveraging back in March/April.
The distribution was recently cut to 8 cents per share per month from 11 cents.
An investor who wants to play the commercial real estate income rebound will need an iron stomach to buy these shares. But they are deeply discounted here.
Tax loss selling pressure is weighing on the shares at the moment and will likely continue to do so for the next 45 days.
We think most investors would do well avoiding the fund for now until we have more clarity and get deeper into tax loss selling.
(This report was issued to members of Yield Hunting on Nov. All data herein is from that date.)
The Principal Real Estate Income Fund (PGZ) is a bashed real estate focused fund with a heavy amount of exposure to the battered commercial mortgage sector. In this report we look at the sector and the prospects of a recovery and give some insights into this fund which is trading at a massive discount following a recent distribution cut and tax loss selling pressure.
The fund is very high risk at this point as the commercial real estate market adjusts to the new COVID-19 normal. Investors in the fund will need an iron stomach and have to have that contrarian, deep value mindset for investing. Shares are trading at deep discounts now - even wider than in March - as tax loss selling pressure mounts.
For those with a strong will and optimistic outlook for the economy/commercial real estate, the fund is highly compelling. I recently started nibbling. But I think most investors would be wise to sit on the sideline for at least a few months (when we get the annual report) and wait for a clearer bottom in the sector. Or they can venture up the food chain into the "safer" cMBS funds of Invesco High Income 2023 (IHIT) or Invesco High Income 2024 (IHTA).
Update: Dec. 7
Since the publication of this article, shares of PGZ have done really well. To be fair, most CEFs have performed well in the time period. However, PGZ has outperformed even the S&P 500.
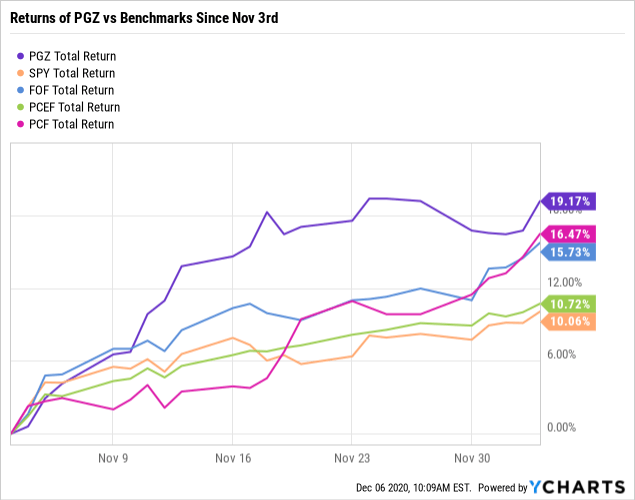 Data by YCharts
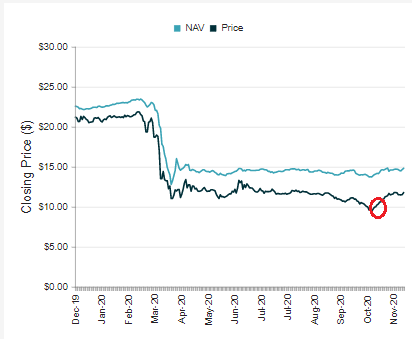
While the shares are not as cheap as they were a month ago, they are still cheap. I think they have recovered the vast majority of what they will likely recover, but there's maybe two or three points of tightening available. The real play left here is if the NAV starts zooming now that a vaccine for COVID-19 is around the corner. Does that mean office and retail commercial real estate prices will rebound? If so, PGZ will be a large beneficiary of that recovery.
I'm holding my position for now but certainly not adding here.
Principal Real Estate Income (PGZ) - Thesis

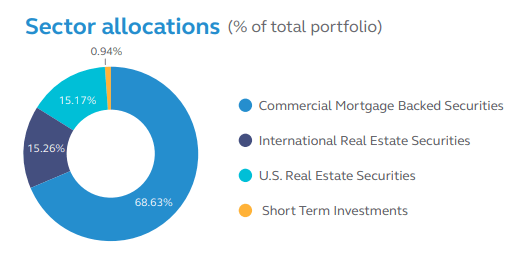
Most real estate CEFs are a mix of different parts of the capital structure. Many of the CEFs in the real estate sector have mixes of eREIT (equity or stock REITs), preferreds of REITs, and bonds. Looking at PGZ, the fund is about 30% eREITs and the rest in bonds. Almost all of those bonds are commercial mortgages so this fund is a bit different than the rMBS (residential mortgage backed securities) focused funds like PIMCO Dynamic Income (PDI) or Western Asset Mortgage Opp (DMO).
Fund Characteristics
- Net Assets: $100M
- # of Holdings: 133
- Inception Date: 6/25/2013
- Duration: 4.21 years
- Average Debt Maturity: 5.2 years
- Avg Debt Market Price: $68.26
- Avg Debt Coupon: 3.80%
- Avg Equity Div Yield: 4.78%
- Leverage: 28.8%
- Leverage Cost: 2.17%
The Portfolio
As we discussed earlier, the portfolio is mostly commercial mortgages. But they do have some equity risk as well - and that's likely the more riskier end of the portfolio. Common shares make up 30% of the portfolio as of the end of September. That's up from 25% at the end of April. The majority of these are eREITs and not pure common stocks. The allocation is split between US and international REITs.
Between then and now, they pared back their exposure to the hotels and motels common stock categories by 1% (now just 0.31% of the portfolio). Another 1.44% is exposed to hotel REITs. At the same time they increased their healthcare REIT exposure by 2% to 4.5%.
In retail, they have 1.3% in regional malls, 2.1% in shopping center REITs, and a small allocation to single-tenant retail. That's actually up since April when they didn't have any exposure to regional malls and a small allocation to shopping center REITs.
Office property REITs expanded from 2.7% to 4.1% in the five-month period and warehouse REITs were essentially unchanged at 6.2%.
Most REITs outside of the data center and infrastructure categories are down for the year. eREIT retail is down near 40% and office eREIT is down more than 30%. Residential (including apartments and single family homes) are down about 20%. Healthcare is down about 22.5%.
Self storage and industrial are up small this year.
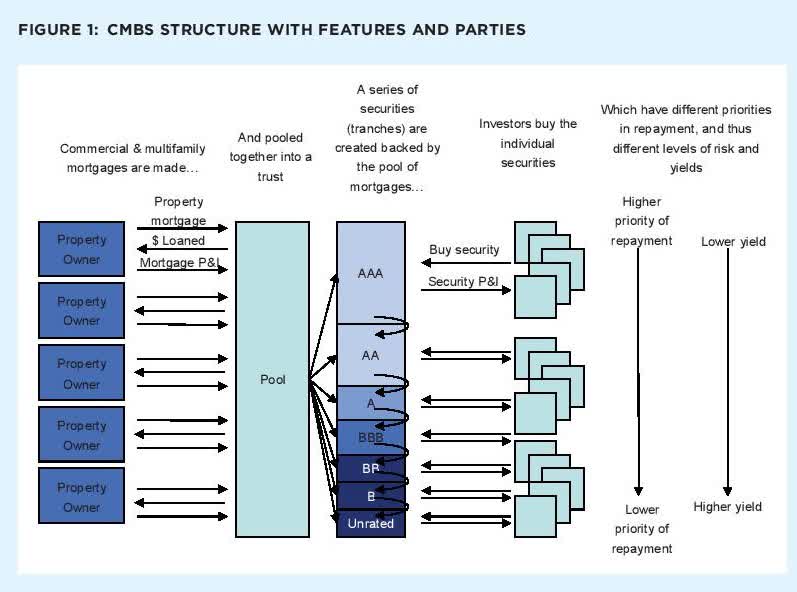
The commercial mortgages are where the bulk of the assets lie and the majority of the distress is occurring. These are mortgage-backed securities, or pools of mortgages that are then sliced up and sold to investors in tranches. In this sleeve of the portfolio they have significant hotel, retail and leisure exposure accounting for almost one third of the cMBS portfolio.
(Source)
Obviously, this sector has been hit hard from the COVID-19 crisis but a lot of these trends already were occurring prior. The virus simply accelerated them.
Without portfolio level analytics it is very hard to decipher exactly what's happening. We do have some data where we can make some assumptions and conclusions.
From the semi-annual report dated April 30, the average price of the cMBS portfolio was down to 46 cents on the dollar. That's well into distressed territory.
If we distinguish between performing and non-performing securities (those priced below 10 cents on the dollar), the average price is 65 cents. So still very depressed. If we fast forward to 9/30 then the average price improves to 68.3 cents on the dollar. That's a significant improvement from 46 in five months time. Obviously, it's impossible to know if they made trades that resulted in the increase in average price or if the actual securities they held rose in value.
Clearly, this portfolio is junky. It was very junky before the COVID-19 crisis. Looking at the annual report from October 2019, the average prices of these securities weren't all that different. In fact, nearly one third of the cMBS portfolio was non-performing even back then. Also not helping was the fact that 71% of the portfolio was floating rate when rates tanked in the last year.
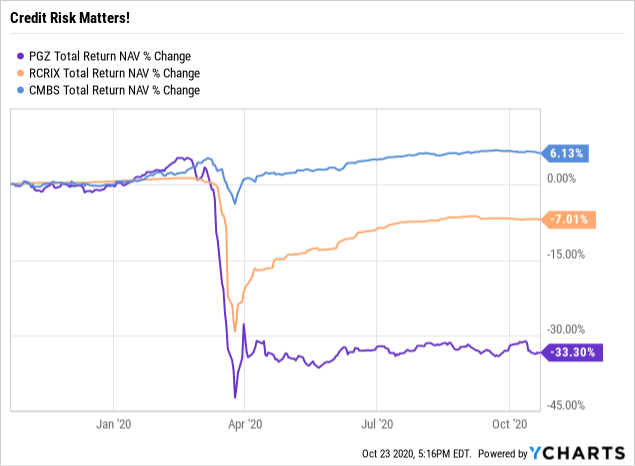
And credit risk is essential to mitigating downside risk. If we compare PGZ to another active cMBS portfolio, Riverpark Floating Rate cMBS Fund (MUTF:RCRIX), and a passive high-quality ETF, iShares CMBS ETF (CMBS). The differences in performance are very stark. The largely AAA -rated passive index barely moved relative to the two active portfolios. Riverpark and PGZ lost a lot with PGZ under-performing RCRIX likely because of the deleveraging.
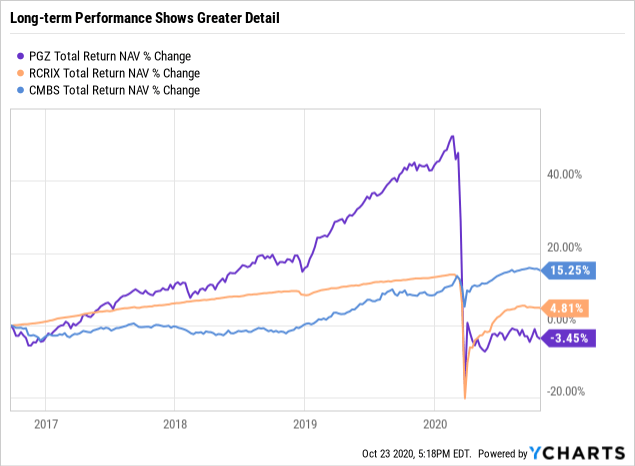
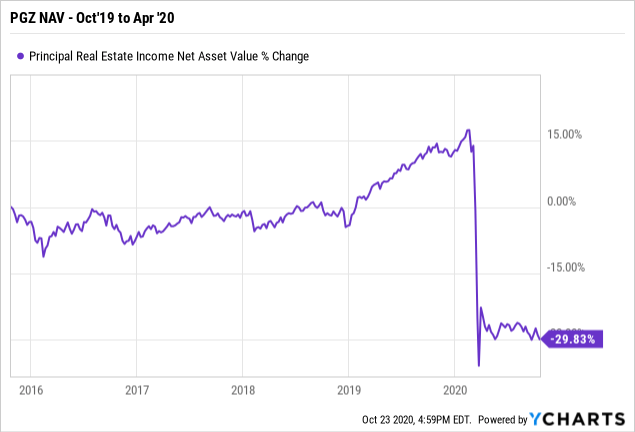
If we look longer term, we can see the beta of the active portfolios. While the Riverpark did well adding risk, PGZ crushed both portfolios. But that outperformance on the upside doesn't come free. The fund got wrecked to the downside dropped over 40% in a month.
The outlook for the NAV depends on your view of where we go from here with regards to COVID-19. The economy is mostly re-opened though many offices remain shut or only partially staffed. There will clearly be a new cohort of workers who will permanently work from home which will reduce the need for office space.
In retail, the same dynamics that have been occurring - with a drive towards online - is simply accelerating.
Distribution Changes
The fund recently adjusted the distribution lower to 8 cents per share per month from 11 cents. The last change to the distribution they made before this one was in August 2017.
The fund had to de-lever back in March, reducing outstanding borrowing from $59.7M to $39.6M, a reduction of 33%. That's roughly in line with the drop in the NAV over that time frame. The fund has a managed distribution policy ("MDP") which means that the distribution is likely to be comprised of a return of capital in addition to net investment income and/or based on a percentage of NAV.
Commercial Mortgage Market Update
Unbeknownst to most investors, the cMBS delinquency rate has declined for three straight months. Though it remains elevated at 9.4%, delinquencies look at to have peaked near term. In the last three months, over $40B of loans that were delinquent are now back to current. The decline in new loans moving into delinquency and the increase in loans being "cured" (going from being 60 day-plus delinquent to current on mortgage payments).
The Wall Street Journal had an article on commercial real estate in New York City last week. They noted that the spread on BB rated cMBS (the highest level of non-investment grade) was 20 points above the Treasury rate of the same maturity.
Nationwide, signs of stress are mounting. Prices on lower-rated commercial mortgage bonds nationwide have fallen in recent weeks. The extra yield, or spread, investors demand to hold an index of double-B- rated CMBS bonds over 10-year U.S. Treasurys climbed to nearly 20 percentage points as of Thursday, according to data firm Trepp, to their widest levels since the financial crisis. Some bonds have fallen to anywhere from 70 cents to 50 cents on the dollar depending on the industry and credit rating, bankers said.
....
“Distress in financial markets was all about residential mortgage-backed securities in 2008 and energy in 2015,” said Daniel McNamara, a principal at MP Securitized Credit Partners who is betting prices for some CMBS indexes will fall. “In 2021 it will be all about commercial real estate and the securities linked to it.”
Commercial mortgages are correlated to a lot of the same variables that residential mortgages are. Unemployment claims, asset prices, and income growth are key drivers of the net operating income (NOI) production of these properties. The most people have jobs - the most people have rising incomes to spend - the more they will consume from these assets whether its office, industrial or even retail.
As employment regains its footing, and economies open back up (and especially when there's a vaccine), these properties will see significantly more foot traffic. Rents are likely to come down in some areas of the market including office and further declines in retail. But that was occurring to some extent before the COVID-19 crisis.
Conclusion: What To Do?
If you are like me sitting on a large loss on these shares, you have clear choices: Focus on the income, double down, or sell out. I do think we are in the midst of the worst of this downturn. The question is how long will it last? Residential housing bottomed nearly two years after the housing crisis in 2008. It's certainly possible that the cMBS market takes years to work itself out.
Obviously PGZ is ultra-cheap here. In fact, it's cheaper today than it was during the depths of the COVID-19 crisis in March. That could partially be due to tax loss harvesting and continued negative sentiment in the cMBS space.
An investor in PGZ must really believe that the commercial real estate market - which is dominated by office and retail sectors, both of which are under heavy pressure, will bottom and start to rebound. I do not think this fund is investable for most individual investors at this point. Instead, look for slightly higher quality cMBS target term funds Invesco High Income 2023 (IHIT) and Invesco High Income 2024 (IHTA) when their discounts are wider than -5% to NAV.
The concern is the potential lack of positive catalysts that will limit opportunities and upside performance near-term. Credit performance remains the focus and has very little certainty at this point in the cycle, which will temper expectations for any material improvement in book value.
Personally, I'm looking to add more risk to my portfolio. I think the election passing and likely passage of stimulus action supportive of these junkier areas of the mortgage market. While I have been adding slowly to my IHIT and IHTA positions (occasionally selling when the discount gets tight), I'm sanguine on PGZ's NAV.
In the last two weeks, it has stabilized and appears to have started moving back higher. It could be a bit too early but I added small to my position (adding about 25% to my existing position) and will likely add more. The discount is just too wide thanks to tax loss selling and investor embedding in the worst case scenario.
Our Yield Hunting marketplace service is currently offering, for a limited time only, free trials and 20% off the introductory rate.
Our member community is fairly unique focused primarily on constructing portfolios geared towards income. The Core Income Portfolio currently yields over 8% comprised of closed-end funds. If you are interested in learning about closed-end funds and want guidance on generating income, check out our service today. We also have expert guidance on individual preferred stocks, ETFs, and mutual funds.
Check out our Five-Star member reviews.

Disclosure: I am/we are long PGZ. I wrote this article myself, and it expresses my own opinions. I am not receiving compensation for it (other than from Seeking Alpha). I have no business relationship with any company whose stock is mentioned in this article.
