Baker Hughes: Too High Too Fast

Revenues were $5,049 million this quarter, down 14.1% from the same quarter a year ago and up 6.5% sequentially.
As of September 30, 2020, the company had cash and cash equivalents of approximately $4.061 Billion, down from $4.132 Billion the preceding quarter.
It is time to take a large profit off the table between now and $22.25, expecting a retracement soon.
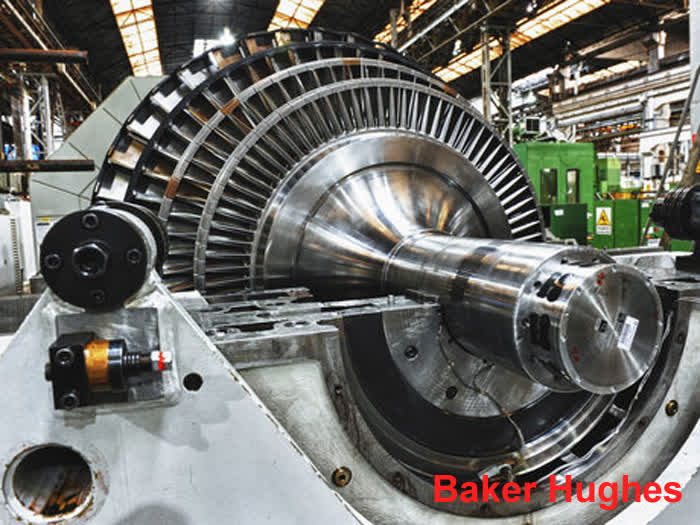 Source: Baker Hughes website - Steam Turbine for mechanical drive
Investment Thesis
Baker Hughes Company (NYSE:BKR) released its third-quarter 2020 results on October 21, 2020. The results were in line with expectations. The Oilfield Equipments and higher volumes in Turbomachinery & Process Solutions and higher cost productivity in Turbomachinery & Process Solutions helped the company meet expectations.
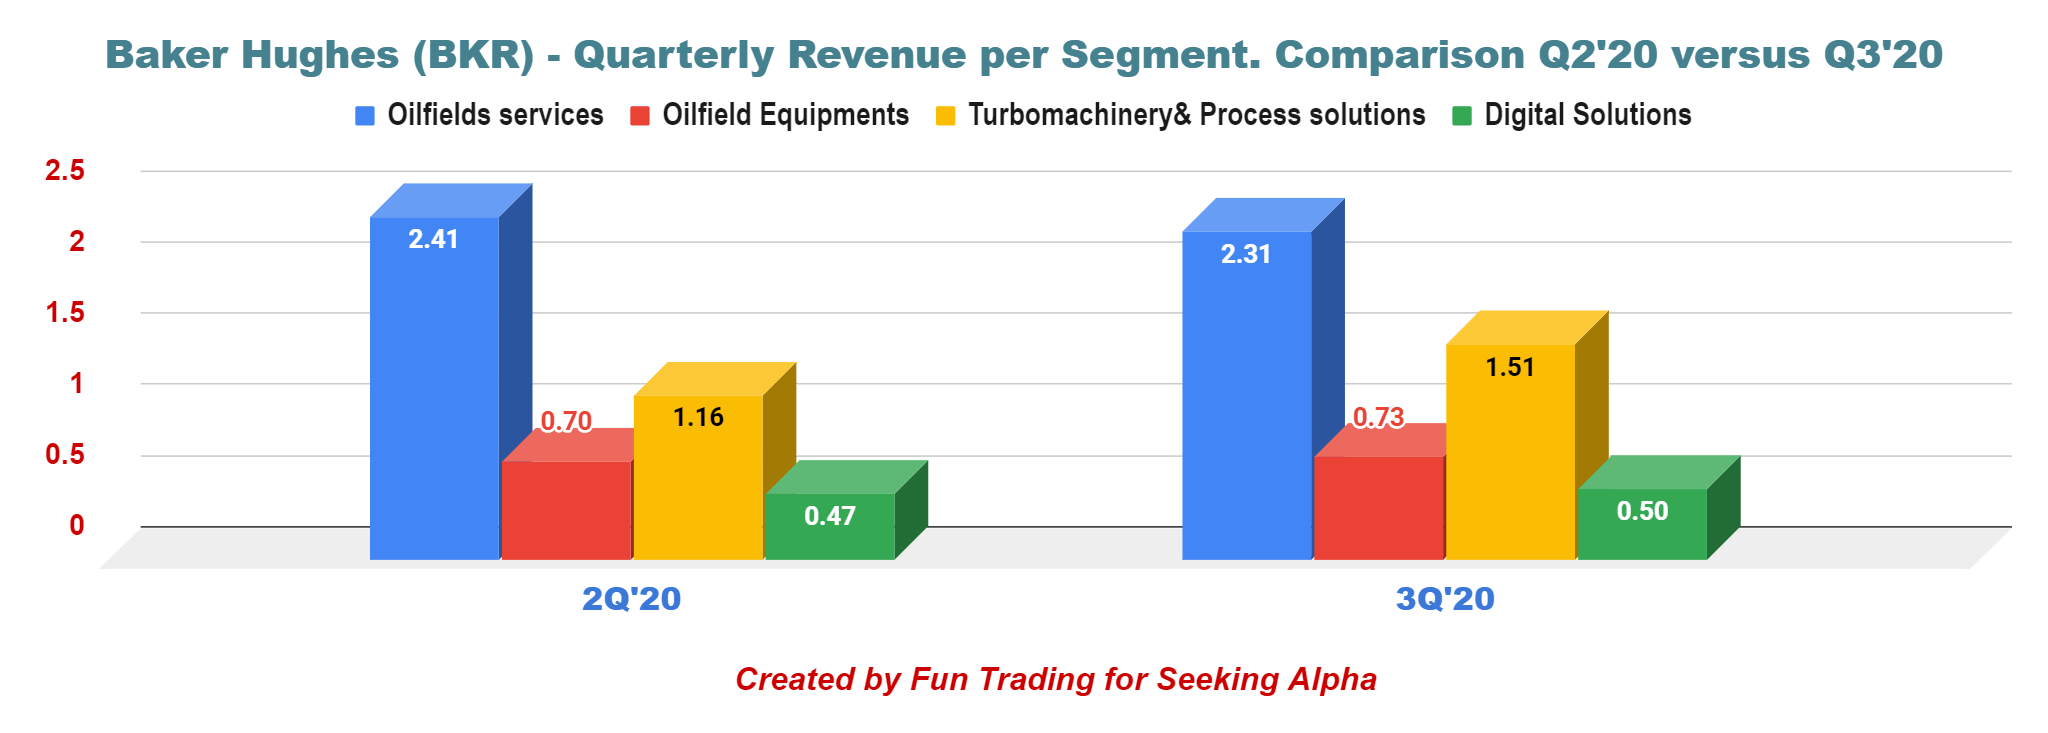
However, on the other side, the company recorded lower margins in Oilfield Services and Digital Solutions units. Below is shown the revenue per segment from Q2 to Q3.
Baker Hughes is comparable to Schlumberger (NYSE:SLB) and Halliburton (NYSE:HAL). Baker Hughes has slightly overperformed its peers. We can see that the stock has significantly recovered from its lows in May-April.
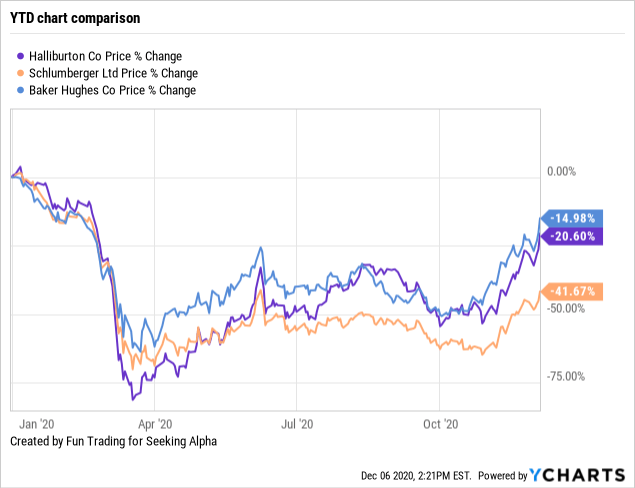 Data by YCharts
The investment thesis
CEO Lorenzo Simonelli said in the conference call:
We are pleased with our third quarter results as we successfully managed the company through the immediate impact of both the pandemic and the industry downturn, while also accelerating our long-term strategy.
Baker Hughes - Financials History: The Raw Numbers - Third Quarter 2020
| Marathon Petroleum | 3Q'19 | 4Q'19 | 1Q'20 | 2Q'20 | 3Q'20 |
| Total Orders in $ Billion | 7.78 | 6.94 | 5.53 | 4.89 | 5.11 |
| Total Revenues in $ Billion | 5.88 | 6.35 | 5.43 | 4.74 | 5.05 |
| Net Income available to common shareholders in $ Million | 57 | 48 | -10,210 | -201 | -170 |
| EBITDA $ Million | 639 | 723 | -15,679 | 32 | 118 |
| EPS diluted in $/share | 0.11 | 0.07 | -15.64 | -0.31 | -0.25 |
| Operating cash flow in $ Million | 360 | 1,357 | 478 | 230 | 219 |
| CapEx in $ Million | 279 | 367 | 365 | 237 | 199 |
| Free Cash Flow in $ Million | 81 | 990 | 113 | -7 | 20 |
| Total Cash $ Billion | 2.81 | 3.25 | 3.01 | 4.13 | 4.06 |
| Debt Consolidated in $ Billion | 7.01 | 6.62 | 6.50 | 7.70 | 7.69 |
| Dividend per share in $ | 0.18 | 0.18 | 0.18 | 0.18 | 0.18 |
| Shares Outstanding (Diluted) in Million | 541 | 653 | 653 | 655 | 676 |
Source: Company News
Historical data from 2015 are only available to subscribers.
Analysis: Earnings Details
1 - Revenues and other income were $5.05 billion in 3Q'20
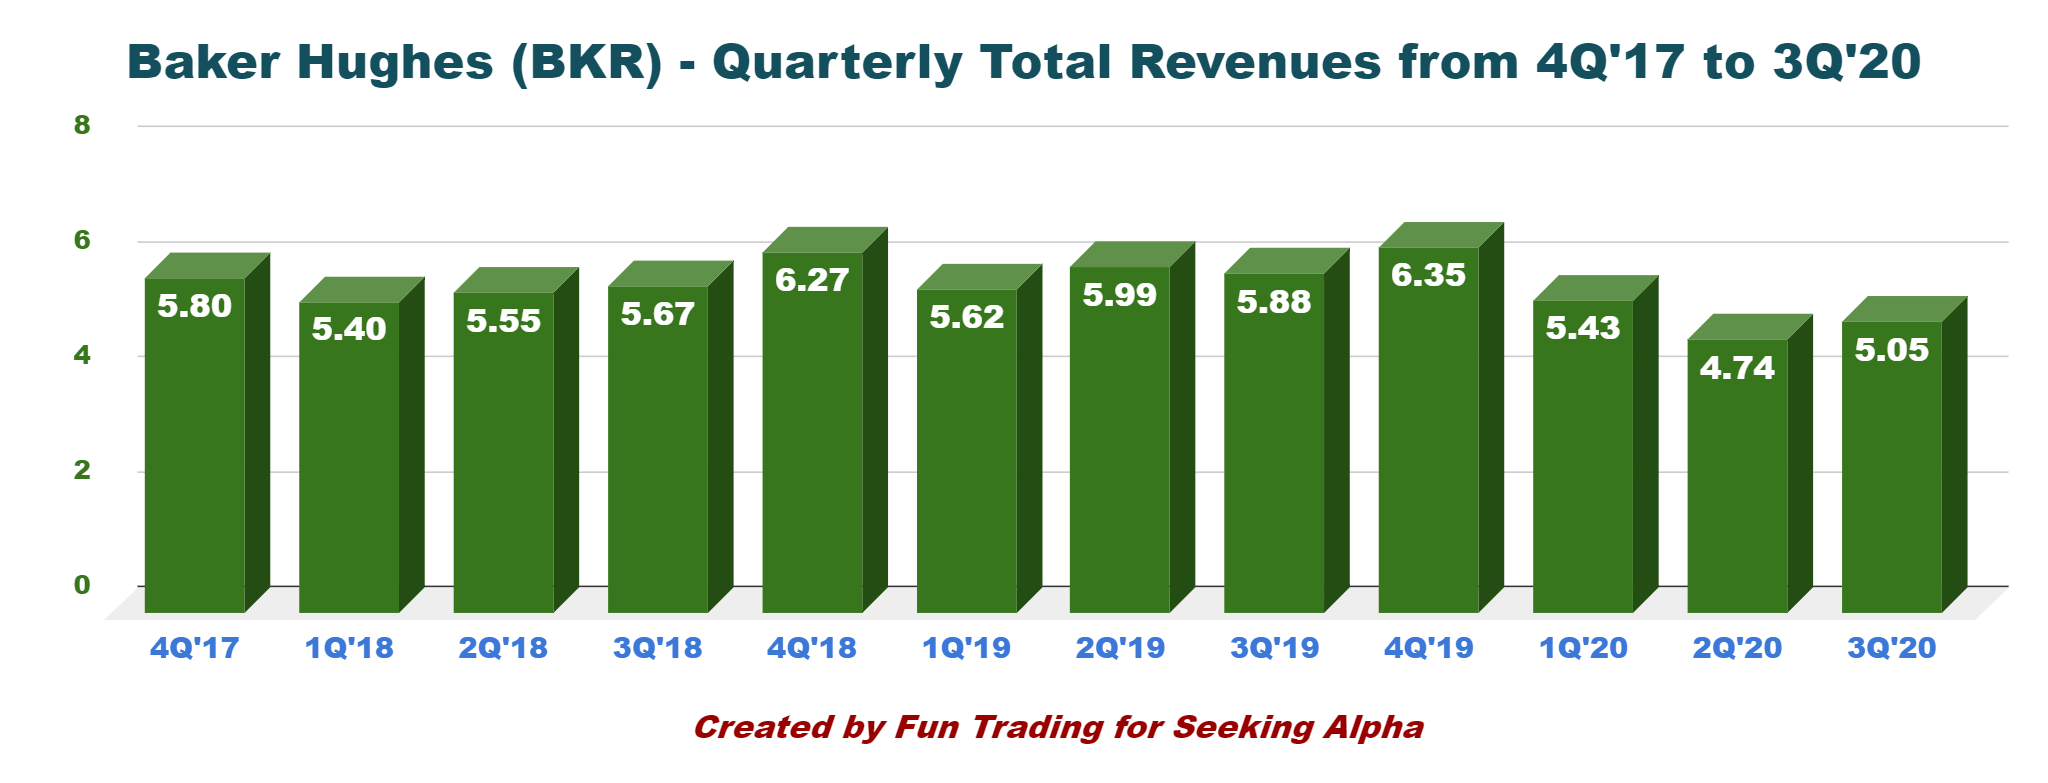
Revenues were $5,049 million this quarter, down 14.1% from the same quarter a year ago and up 6.5% sequentially. The adjusted operating income was $234 million for the quarter up sequentially, but down 45% year over year.
Note: Orders this quarter were $5.11 billion compared to $7.78 billion the same quarter a year ago.
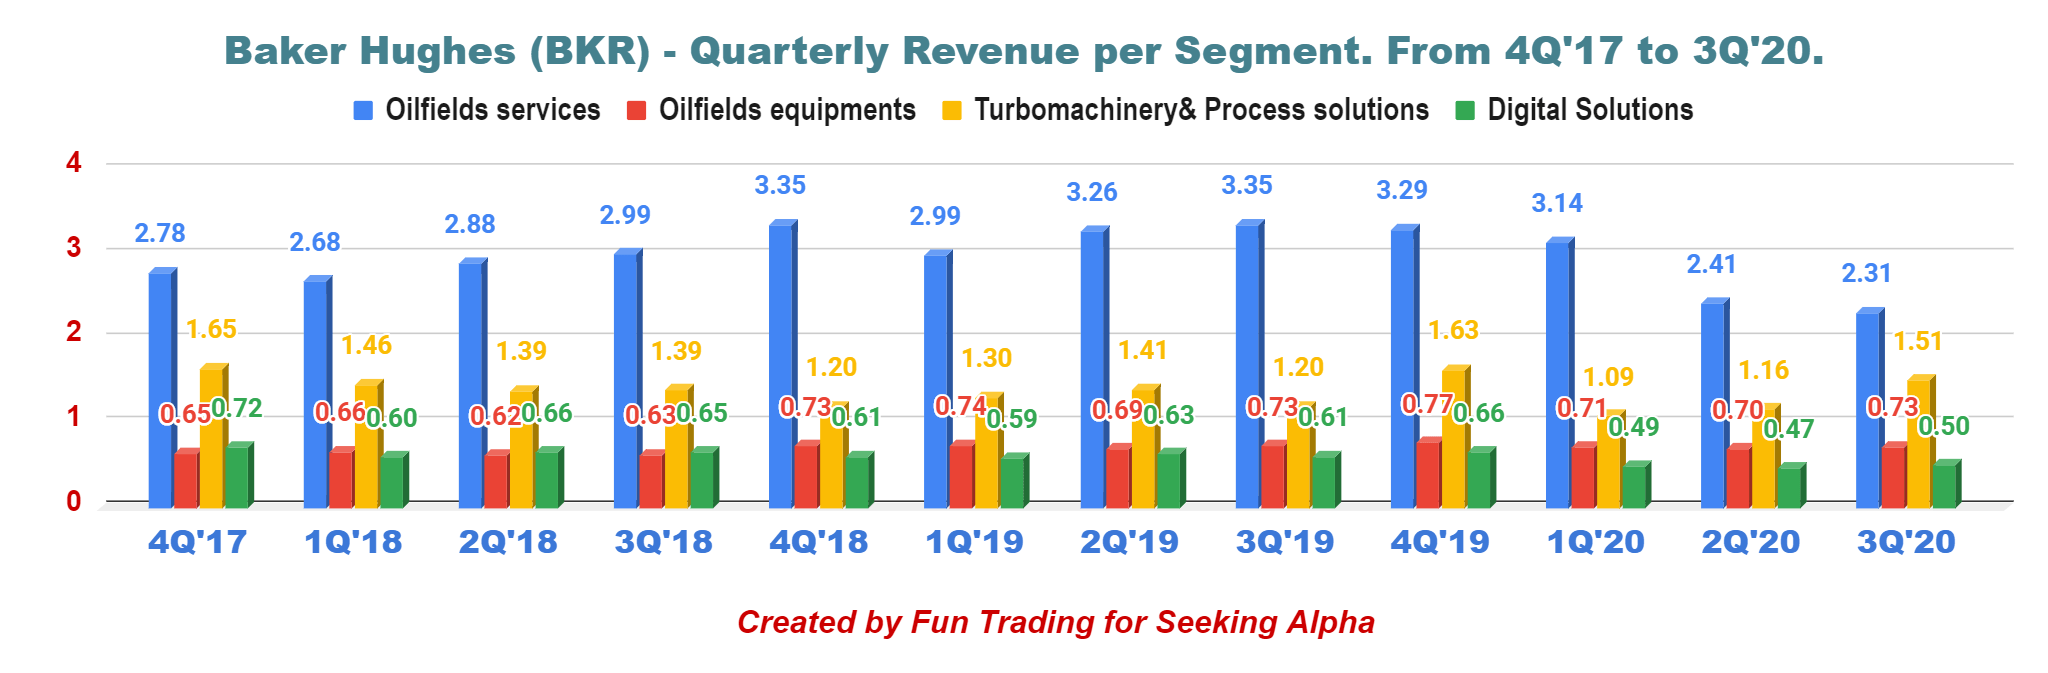
1 - Oilfield Services
Revenue was $2,308 million, down 31% from the same quarter a year ago or $3,348 million. Lower revenues from the Asia Pacific, the Middle East, and Sub-Saharan Africa were to blame, while higher sales in Europe and Latin America helped reduce the negative effect. The operating income from the segment was $93 million, down from $274 million last year.
2 - Oilfield Equipment
Revenue was $726 million, compared to $728 million last year. The segment suffered from lower volumes in the company’s Offshore, Subsea Services, Surface Pressure Control, and Subsea Drilling Systems businesses. The segment reported a net income of $19 million compared to $14 million the same quarter a year ago. The segment profited from higher-cost productivity.
3 - Turbomachinery & Process Solutions
Revenue was $1,513 million from $1,197 million a year ago due to higher equipment volumes. Net income rose to $191 million from $161 million in the third quarter of 2019 due to higher cost productivity and volumes.
4 - Digital Solutions
Revenue was $503 million, down 17% from $609 million in the third quarter of 2019. Operating income was $46 million, down 44% from the third quarter of 2019 of $82 million. The drop was due to lower volumes.
2 - Free Cash Flow was $20 million in 3Q'20
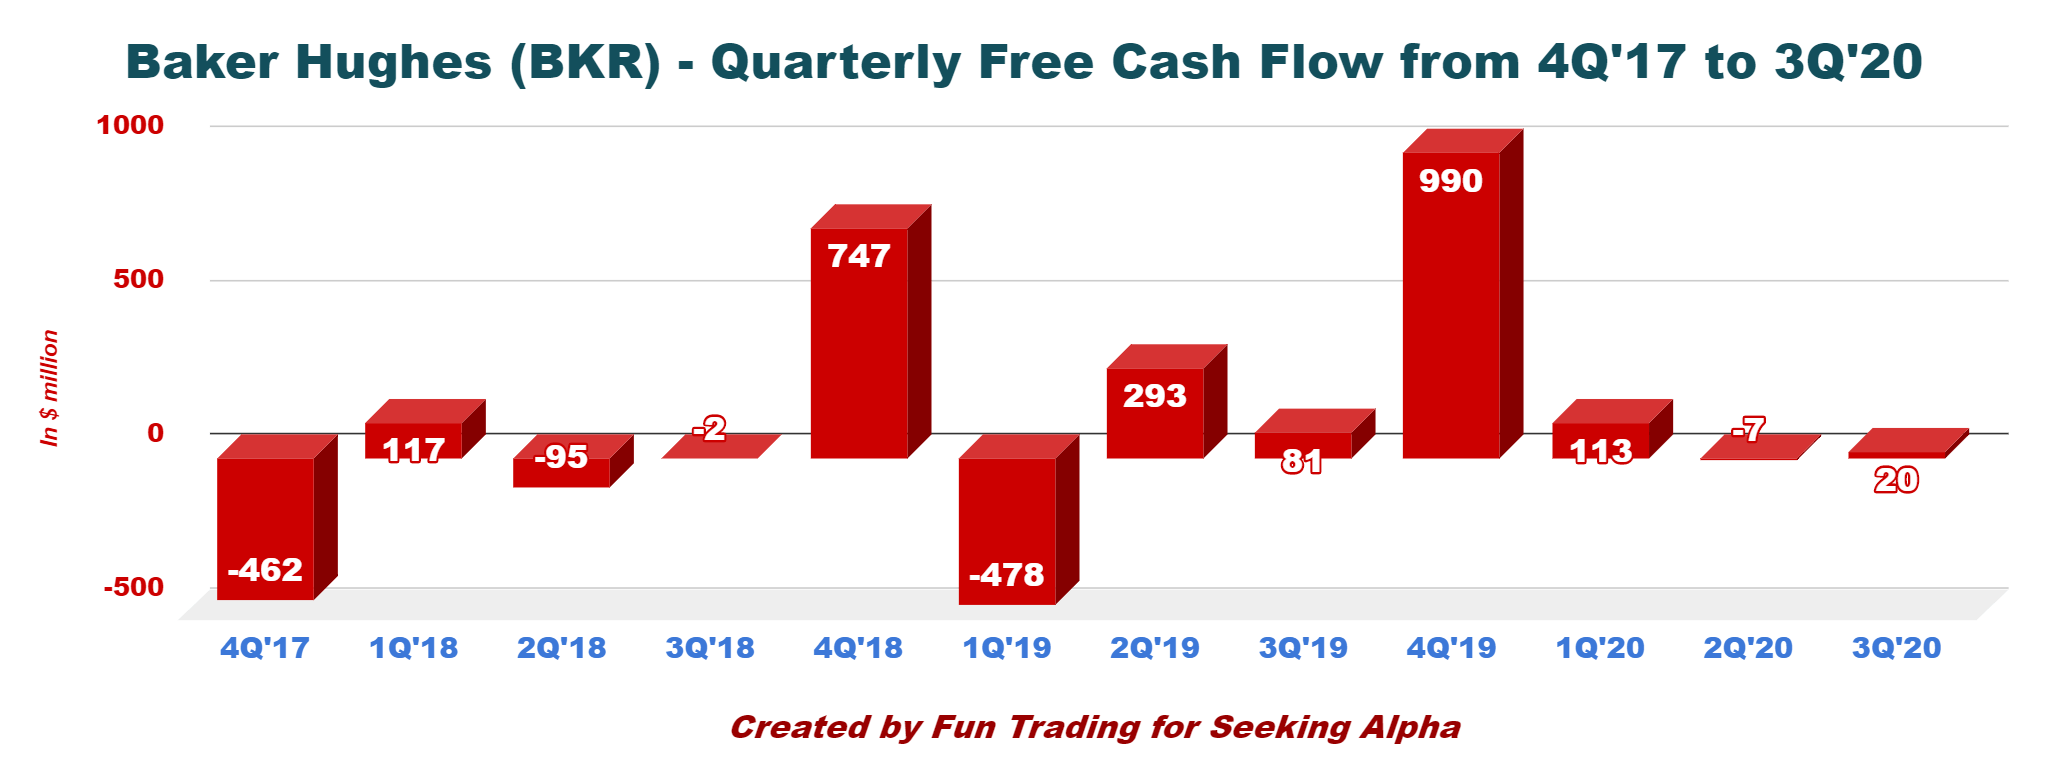
As of September 30, 2020, the company had cash and cash equivalents of approximately $4.061 Billion, down from $4.132 Billion the preceding quarter.
Note: Generic Free Cash Flow is Cash flow from operations minus CapEx. The company's free cash flow is different, but I choose to calculate the FCF using the same approach as YCharts or Morningstar. The difference comes from the CapEx determination. The company adds proceeds from the disposal of assets.
Yearly free cash flow ttm came at $1,116 million, and the company managed a profit of $20 million for 3Q'20.
The quarterly dividend payout ($0.18 per share) on an annual basis is $487 million.
The dividend payment is supported by free cash flow right now, but the situation will turn critical after Q2 2021 if no recovery materializes.
3 - The total debt was $7.69 billion in 3Q'20
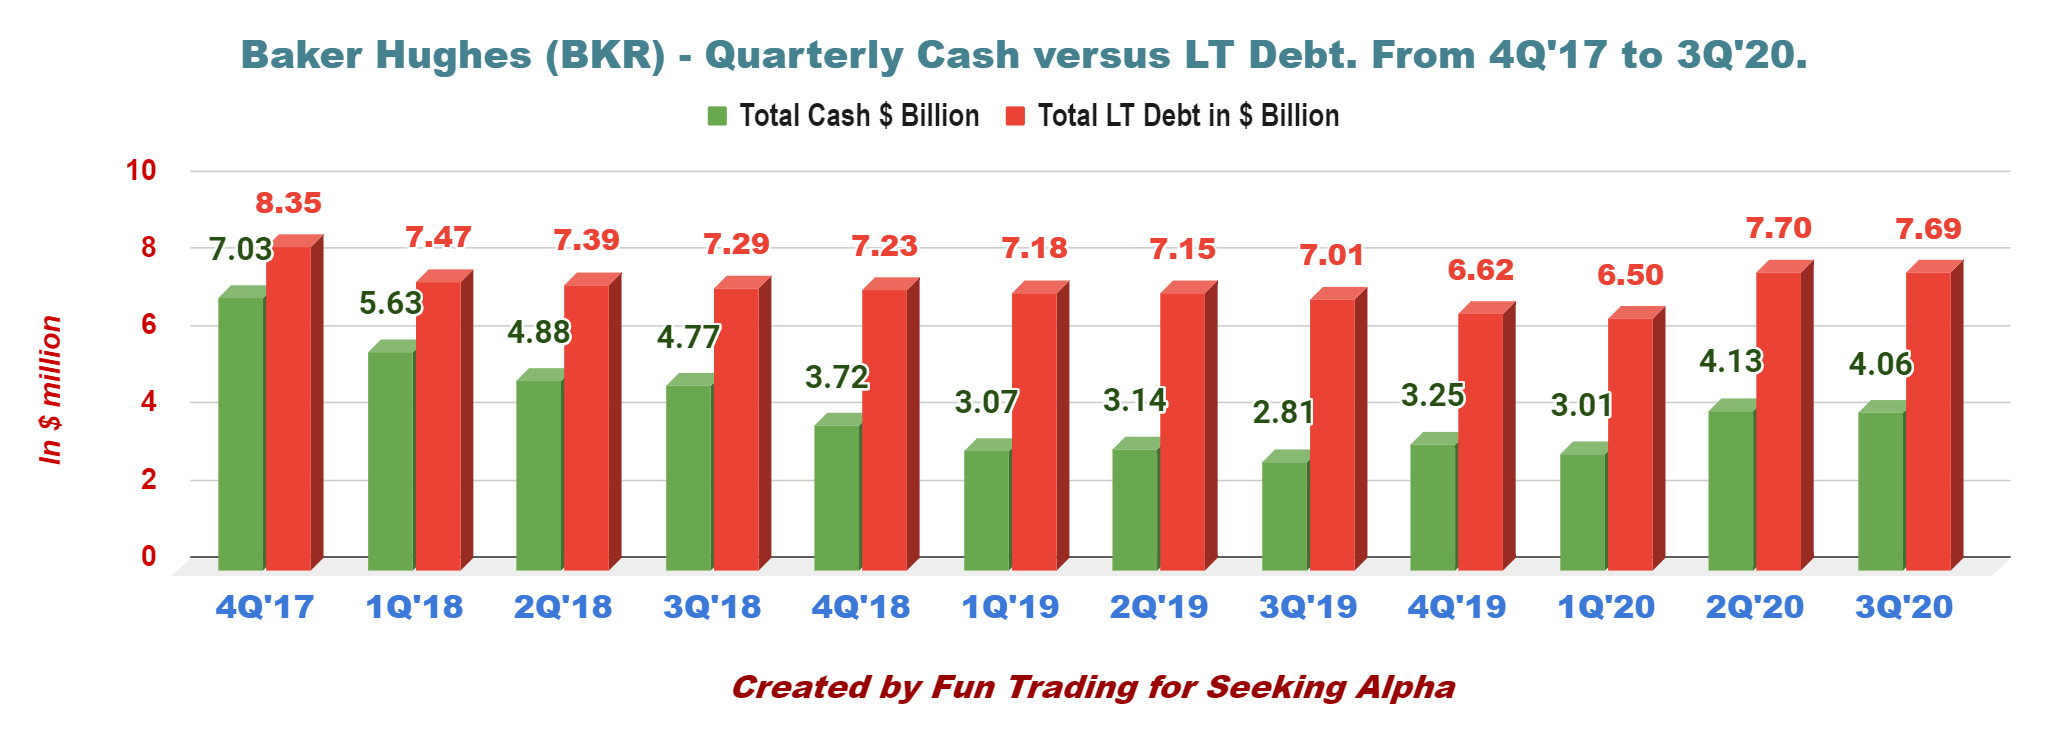
As of September 30, 2020, the company had cash and cash equivalents of approximately $4.061 Billion, down from $4.132 Billion the preceding quarter.
The company had long-term debt (including long term due within a year) of $7.69 Billion, down slightly from the preceding quarter (see chart above) - the debt-to-capitalization of 28.1%.
The debt to capitalization ratio in Q3 is 0.664, according to YCharts, which is reasonable. For instance, Halliburton shows a ratio of 1.89, and Schlumberger indicates a ratio of 1.49 in Q3.
Near-Term Outlook, Commentary, and Technical Analysis
The company expects the markets to stabilize early next year moderately, but it foresees a potential limited recovery in some markets over the second half of next year.
As we look into 2021, we expect activity to stabilize early next year and see the opportunity for recovery in some markets over the second half of the year. However, we believe that any potential second half recovery in 2021 will require higher oil prices and that most of the activity increases are likely to come from low cost basin.
However, lower production in the USA and Increase demand in Asia, which has not been severely affected by the virus so far, is expected to trigger a better outlook in the NGL market. Also, China's recently pledged to be carbon neutral by 2060, pushing growth in gas consumption, and India is also on its way to double its natural gas demand over the next 15 years.
Taking a broader view of the LNG market. Our long term outlook for LNG demand growth remains intact. We continue to view natural gas as a transition and destination fuel for lower carbon future supported by a few key drivers.
Baker Hughes anticipates cost savings of $700 million per year starting 2021.
The oilfield equipment segment is still struggling, and the company focuses on improving the margin profile. It is the only part that it can control.
The company announced it reached an agreement to sell its Surface Pressure control flow, operating primarily in North America, to Pelican Energy Partners. However, Baker Hughes retains the SPC projects business, which operates in the Middle East, Africa, the North Sea, and Asia.
Finally, the offshore segment remains challenging, and the company doesn't expect any improvement in 2021.
In conclusion, the near-term outlook is not as bright as the Market wants us to see it, and I am skeptical about this massive run-up in November. I see it as an excellent opportunity to take some profit off the table.
Technical analysis
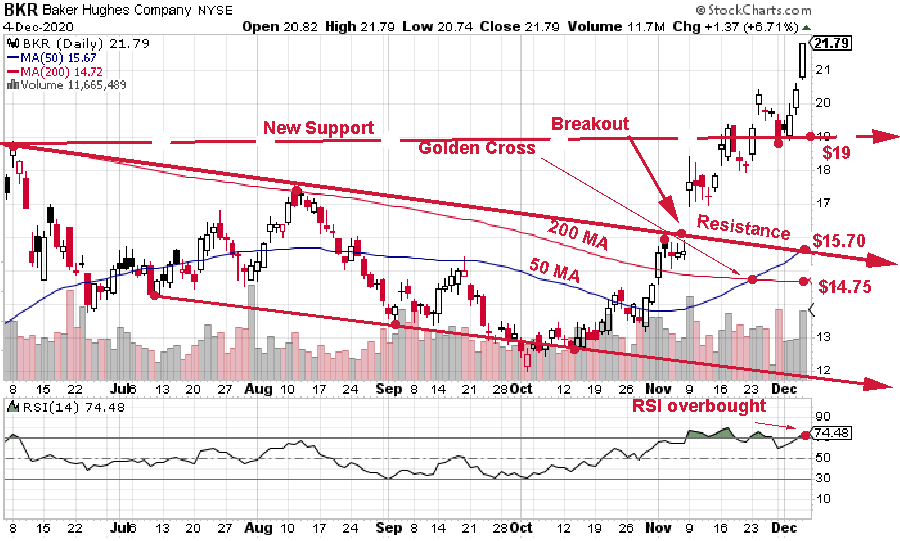
BKR experienced a breakout in early November and quickly jumped to nearly $22.
I believe $22 is a long-term resistance looking at the 3-year chart. The resistance is well defined with April 2019 and January 2020.
Thus, it is time to take a large profit off the table between now and $22.25, expecting a retracement soon. I think 50-60% should be a good idea.
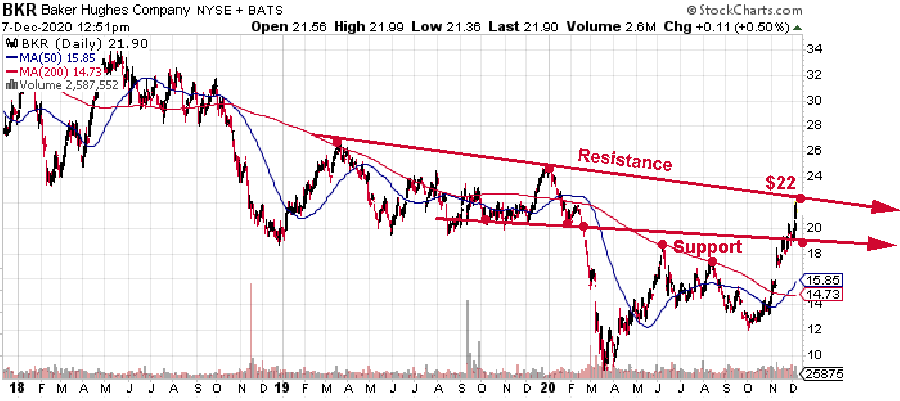
The next support is about $19, at which point I recommend accumulating again.
However, if oil prices continue their positive momentum and reach $50 per barrel early next year, BKR may eventually breakout the resistance at $22 and retest $30's.
Conversely, if oil prices drop precipitously again, we may be back to $15 very soon.
The uncertainty is relatively high, and trading your long position is crucial.
Author's note: If you find value in this article and would like to encourage such continued efforts, please click the "Like" button below as a vote of support. Thanks!

Join my "Gold and Oil Corner" today, and discuss ideas and strategies freely in my private chat room. Click here to subscribe now.
You will have access to 57+ stocks at your fingertips with my exclusive Fun Trading's stock tracker. Do not be alone and enjoy an honest exchange with a veteran trader with more than thirty years of experience.
"It's not only moving that creates new starting points. Sometimes all it takes is a subtle shift in perspective," Kristin Armstrong.
Fun Trading has been writing since 2014, and you will have total access to his 1,988 articles and counting.
Disclosure: I/we have no positions in any stocks mentioned, and no plans to initiate any positions within the next 72 hours. I wrote this article myself, and it expresses my own opinions. I am not receiving compensation for it (other than from Seeking Alpha). I have no business relationship with any company whose stock is mentioned in this article.
