SPXU Drift Is Improving, But It Is Still In Decay Regime

Leveraged ETFs sometimes have an unpredictable behavior.
An illustration with 22 ETFs tracking various indexes.
A closer look at SPXU.
The ProShares UltraPro Short S&P 500 ETF (SPXU) is one of the most popular instruments to short the broad market for trading or hedging purposes. However, its daily -3X leverage factor is a source of drift. It must be closely monitored to detect changes in the drift regime. This article explains what "drift" means, quantifies it in more than 20 leveraged ETFs, shows historical data, and finally concludes about the current market conditions. The analysis is also valid for the Direxion Daily S&P 500 Bear 3X Shares ETF (SPXS), which tracks the same index with the same factor and has an almost identical behavior.
Why do leveraged ETFs drift?
Leveraged ETFs often underperform their underlying index leveraged by the same factor. The decay has essentially four reasons: beta-slippage, roll yield, tracking errors, management costs. Beta-slippage is the main reason in equity leveraged ETFs. However, when an asset is in a steady trend, leveraged ETFs can bring an excess return instead of a decay. You can follow this link to learn more about beta-slippage.
Monthly and yearly drift watchlist
A few definitions are necessary before going to the point. “Return” is the return of a leveraged ETF in a given time interval, including dividends. “IndexReturn” is the return of a non-leveraged ETF on the same underlying asset in the same time interval, including dividends. “Lv” is the leveraging factor. “Abs” is the absolute value operator. “Drift” is the drift of a leveraged ETF normalized to the underlying index exposure in a time interval. It is calculated as follows:
Drift = (Return - (IndexReturn x Lv))/ Abs(Lv)
“Decay” means negative drift. “Month” stands for 21 trading days, “year” for 252 trading days. A drift is a difference between 2 returns, so it may go below -100%.
Index | Lv | Ticker | 1-month Return | 1-month Drift | 1-year Return | 1-year Drift |
S&P 500 | 1 | 7.66% | 0.00% | 20.83% | 0.00% | |
3 | 23.97% | 0.33% | 16.96% | -15.18% | ||
-3 | -20.64% | 0.78% | -71.98% | -3.16% | ||
ICE US20+ Tbond | 1 | -3.55% | 0.00% | 13.28% | 0.00% | |
3 | -11.27% | -0.21% | 21.18% | -6.22% | ||
-3 | 10.02% | -0.21% | -47.93% | -2.70% | ||
NASDAQ 100 | 1 | 6.49% | 0.00% | 51.76% | 0.00% | |
3 | 19.64% | 0.06% | 123.45% | -10.61% | ||
-3 | -18.75% | 0.24% | -87.14% | 22.71% | ||
DJ 30 | 1 | 8.89% | 0.00% | 11.59% | 0.00% | |
3 | 27.84% | 0.39% | -12.68% | -15.82% | ||
-3 | -23.83% | 0.95% | -68.07% | -11.10% | ||
Russell 2000 | 1 | 17.32% | 0.00% | 18.67% | 0.00% | |
3 | 58.59% | 2.21% | -10.86% | -22.29% | ||
-3 | -40.33% | 3.88% | -79.43% | -7.81% | ||
MSCI US REIT | 1 | 7.93% | 0.00% | -3.34% | 0.00% | |
3 | 23.91% | 0.04% | -53.47% | -14.48% | ||
-3 | -22.15% | 0.55% | -61.62% | -23.88% | ||
MSCI Emerging | 1 | 8.40% | 0.00% | 21.99% | 0.00% | |
3 | 26.17% | 0.32% | 20.15% | -15.27% | ||
-3 | -22.82% | 0.79% | -72.20% | -2.08% | ||
Gold spot | 1 | -3.63% | 0.00% | 23.97% | 0.00% | |
2 | -7.95% | -0.35% | 37.23% | -5.36% | ||
-2 | 6.29% | -0.49% | -40.36% | 3.79% | ||
Silver spot | 1 | 1.08% | 0.00% | 41.83% | 0.00% | |
2 | -0.41% | -1.29% | 50.64% | -16.51% | ||
-2 | -6.90% | -2.37% | -71.92% | 5.87% | ||
S&P Biotech Select | 1 | 10.78% | 0.00% | 46.15% | 0.00% | |
3 | 33.83% | 0.50% | 69.80% | -22.88% | ||
-3 | -28.21% | 1.38% | -88.96% | 16.50% | ||
PHLX Semicond. | 1 | 17.37% | 0.00% | 66.32% | 0.00% | |
3 | 57.83% | 1.91% | 118.91% | -26.68% | ||
-3 | -41.15% | 3.65% | -94.47% | 34.83% |
The best and worst drifts
- The inverse leveraged silver ETF (ZSL) has the worst monthly decay of this list with a drift of -2.37%.
- The worst 1-year decay is in the leveraged inverse semiconductor ETF (SOXL) with -26.68%. The leveraged biotechnology ETF (LABU), the leveraged small cap ETF (TNA) and the inverse leveraged real estate ETF (DRV) have also suffered decays in excess of -20%.
- The inverse leveraged semiconductor ETF (SOXS) has the highest positive drift in one month (+3.65%) and in one year (+34.83%), in a large loss.
A positive drift comes with a steady trend in the underlying asset (whatever the trend direction and the ETF direction). A negative drift comes with daily return volatility (“whipsaw”). Whipsaw happens more often in downtrends: downtrends make investors nervous, so steady downtrends are very rare.
SPXU drift has been positive for one month, but it is still negative on a longer time frame
SPXS and SPXU had positive drifts on long periods, as reported in this article. However, I have issued a warning on 3/10 (3/5 for subscribers) against leveraged equity ETFs. Trading or hedging with SPXU has worked very well in the first week of the market meltdown (2/21 to 2/28): it has gained about 40%, significantly more than SPY return on the same period of time (-11%) multiplied by the leveraging ratio (-3). It is a significant excess return due to beta-slippage. Then, whipsaw action has resulted in a heavy drag in a few weeks in March: SPY has lost 17.5% and SPXU has gained less than 16% in the same time. It means shorting SPY was a better trade than buying SPXU, despite the leverage factor. Since then, the monthly drift has oscillated between positive and negative values, but the 12-month drift has stayed in negative territory.
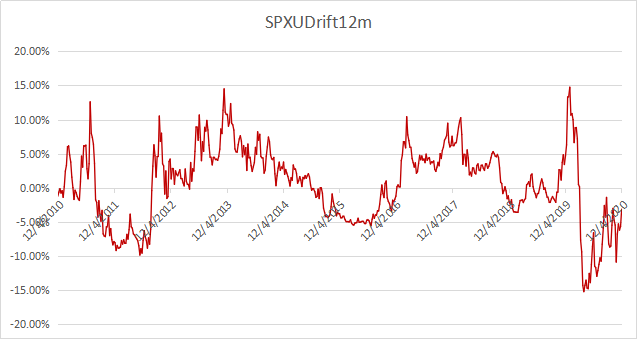
12-month drift of SPXU last 10 years
The drift is positive in a trailing month because of a stock market rally with little realized volatility in the last 5 weeks. However, the 12-month drift has been in decay regime since March.
SPXS and SPXU are cheap hedging instruments in a bull market compared with other derivatives. However, they may suffer a significant decay when S&P 500 daily returns are volatile. Their monthly drift became strongly negative in March, and it was better to avoid them during a few months. It was back in positive regime in July, but whipsaw has harmed it in September and October. It is positive again as of writing this.
In volatile times, instruments with less or no leverage should be preferred for hedging. The real drift of a hedging position depends on rebalancing dates. Rebalancing close to technical support and resistance zones may partly or totally offset the drift even in volatile times, but this is path-dependent and unpredictable.
Shorting an asset or buying an inverse product also implies a decay due to the inflation rate. It is not a concern for now, but keep it in mind.
Anyway, leveraged ETFs are only for investors and traders with a good understanding of the products behind the advertised leveraging factor. Like for any ETF, read the prospectus, and if you have a doubt, stay away.
Disclosure: I am/we are long TLT. I wrote this article myself, and it expresses my own opinions. I am not receiving compensation for it (other than from Seeking Alpha). I have no business relationship with any company whose stock is mentioned in this article.
Additional disclosure: long in stocks, bonds, gold.
