REZ: Just Not Worth It

REZ gives investors exposure to U.S. residential, storage, and health care REITs.
Unfortunately the ETF suffers from its cap-weighted structure that has been a huge source of performance drag for investors.
REZ also charges an expensive 0.48% annual fee, making it inappropriate to hold for long periods.
I believe REZ will underperform other REIT ETFs going forward, and investors should look elsewhere if they desire targeted residential REIT exposure.
Investment Thesis
REZ is bet on the recovery of residential and health care REITs, but a poor one at that. This ETF has historically struggled from its cap-weighted index methodology's structural flaws and has consistently underperformed equal weight options. It is also an expensive fund that will cost investors nearly 10% of their returns over a ten year period. With many uncertainties ahead for the U.S. economy, I would recommend that investors avoid REZ and focus on lower-cost alternatives not specific to the residential REIT industry.
ETF Profile
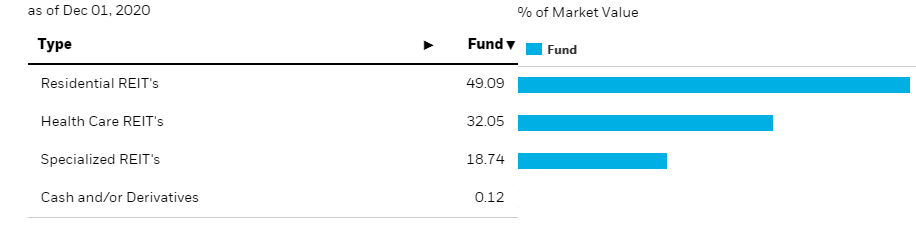
The iShares Residential and Multisector Real Estate ETF (REZ) is a cap-weighted fund comprised of U.S. residential, storage, and health care REITs. Tracking the FTSE Nareit All Residential Capped Index with an annual expense ratio of 0.48%, REZ pays an annual dividend is $2.07, or a yield of about 3%.
Residential REITs make up half of the fund, while health care and specialized REITs contribute the other half. All of the specialized REITs are storage REITs, which I have classified as such for this analysis.
 Source: iShares REZ ETF Profile
Here are the top ten holdings, which make up nearly 60% of the fund.
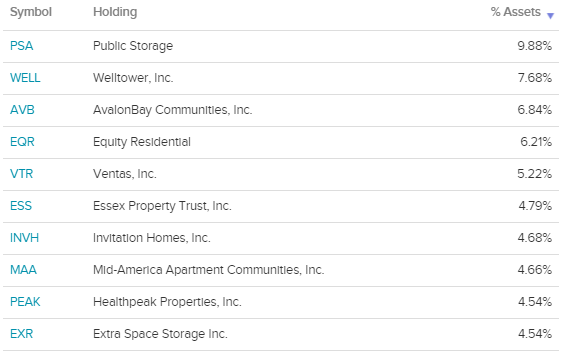
Source: ETFDB.com
Funds From Operations Update
According to the 2020 Q3 Nareit Tracker, funds from operations have decreased in the residential, storage, and industrial REIT category in the last twelve months by 4.19%, 2.07%, and 5.44%, respectively. For residential REITs in particular, there have been two other time periods where FFO went into negative territory, and each time it took over more than one year to recover. In 2002, FFO decreased by 6.92% and was followed by a decrease of 11.28% in 2003 and a further decrease of 2.56% in 2004. During the Great Financial Crisis, FFO decreased in 2007 by 4.94% and a further 26.21% drop in 2008 before recovering to single-digit growth for the next two years.
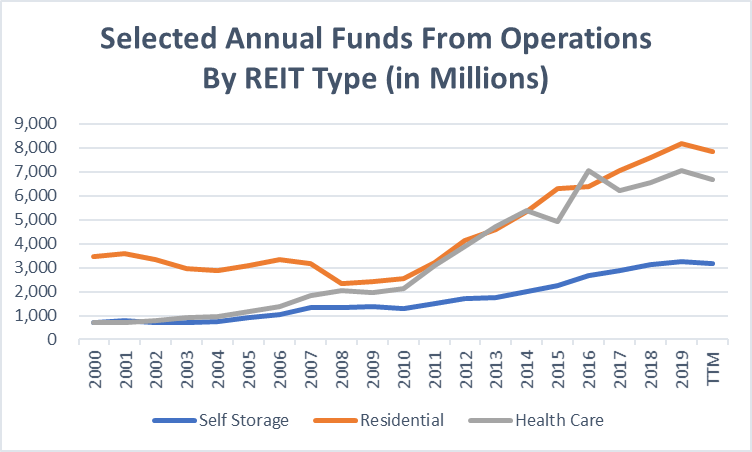
Source: Created By Author Using Data From Nareit
I am cautious that the eventual recovery of the U.S. economy will be slower than anticipated. Though today's circumstances are certainly different from 12 years ago, the uncertainty is just as high. Vaccination rates will vary by region due to personal beliefs and each state's health care system's efficiency. There is still no clarity on identifying those who have received the vaccine and those who have not. Another meaningful round or two of stimulus will be needed to keep the economy from tumbling, and there is a high degree of political risk due to Georgia's upcoming Senate runoff elections. The recovery for residential REITs, which REZ depends on, will not happen overnight. In fact, it may very well end up being similar to the period between 2008 and 2010 when funds from operations grew at only a 4.9% CAGR - about half of its ten-year CAGR of 9.41%.
Creating Benchmark Portfolios
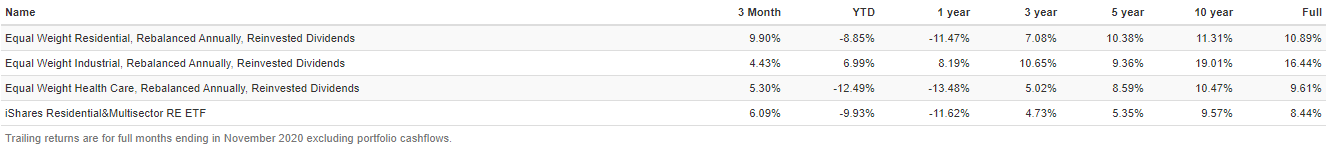
To test this ETF selection method, I created three benchmark portfolios for each of the three industries represented in REZ: residential, storage, and health care. These portfolios are all equal weight using REZ's current holdings to control for any size bias, are rebalanced annually to their target weights, and have their dividends automatically reinvested. Below is the performance of these portfolios compared to REZ since January 2008.
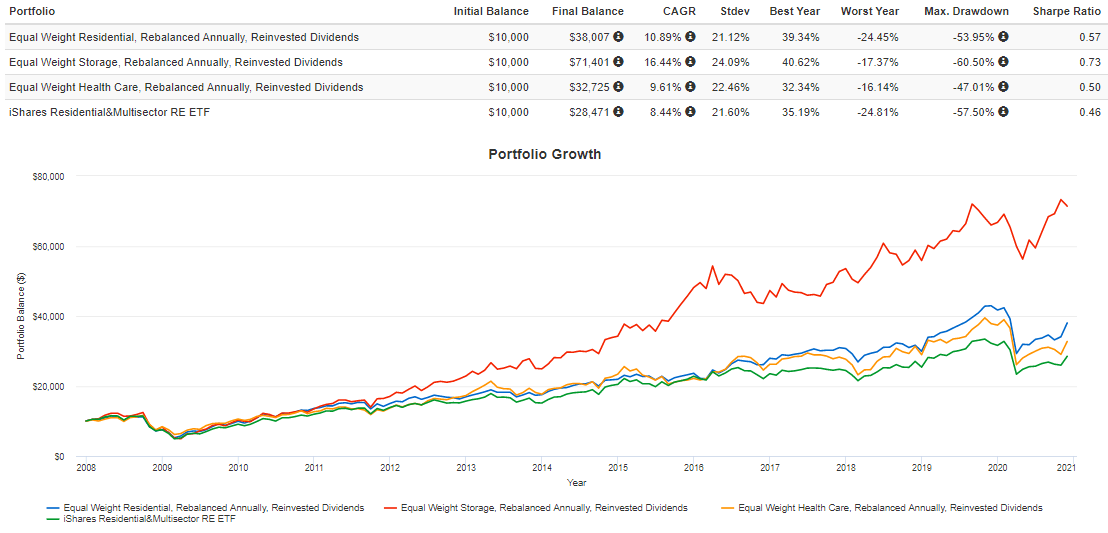
Source: Portfolio Visualizer
First, notice that all three equal weight portfolios have CAGRs above REZ, even after subtracting a 0.48% annual fee. There is no other conclusion to draw here other than that REZ suffers from the structural flaws fundamental indexing advocates have long warned us about with cap-weighted indexes. In this case, REZ has systematically underweighted underpriced REITs and overweighted overpriced REITs, which is why an equal weight approach has performed so much better.
The second thing that stands out is the huge outperformance by storage REITs, consisting of Public Storage (PSA), Extra Space Storage (EXR), CubeSmart (CUBE), Life Storage (LSI), and National Storage Affiliates (NSA). These stocks had begun to pull away from their peers as early as 2012 and have continued this outperformance into 2020. Unfortunately, with a weighting of just 18.74%, it is not enough to make a meaningful impact for investors.
 Source: Portfolio Visualizer
The Impact Of Fees On This ETF
The impact of a 0.48% expense ratio should not be overlooked. As of October 31, REZ's ten-year annualized return has been 8.32% compared to the benchmark return of 8.76%.
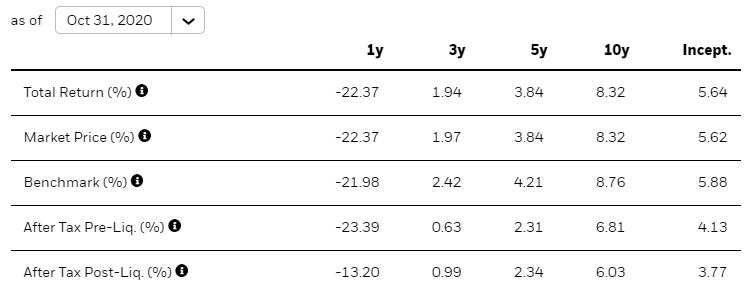 Source: iShares REZ ETF Profile
According to Larry Bates' T-Rex Calculator, this fee structure would have allowed an investor to keep approximately 92% of returns over ten years. In other words, 8% is lost because fees compound just like returns do. High fee funds like REZ should be avoided for this reason unless they can prove they have a selection methodology that produces at least enough alpha to justify the costs. REZ certainly does not qualify based on this.
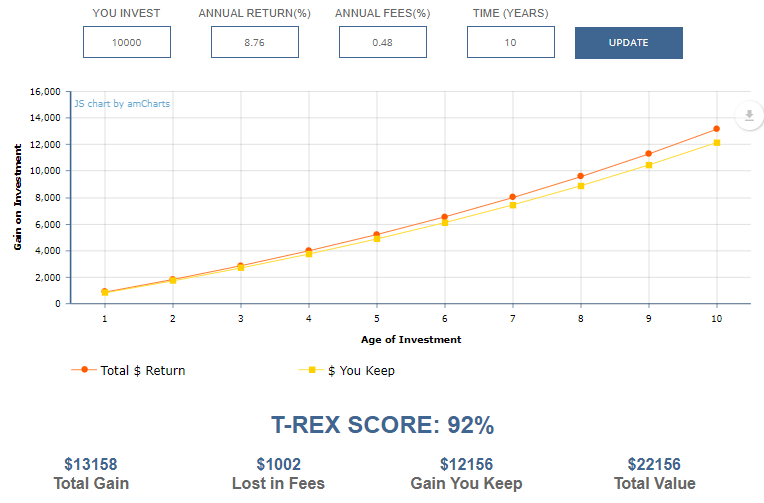 Source: Larry Bates T-Rex Calculator
Investment Recommendation and Conclusion
While I am generally optimistic about U.S. REITs, I cannot justify overweighting residential REITs using REZ. Its structural cap-weighted flaw results in poor security allocation, and the fees are too high. Even if used as part of a tactical asset allocation strategy, it is more likely than not that investors will be waiting at least a couple of years before seeing any meaningful capital appreciation. Instead, I would recommend that investors focus on more broad, lower-fee ETFs such as XLRE until FFO growth in the residential sector turns positive. Then, a short-term investment in REZ may be warranted, and I plan to revisit this analysis at that time.
Disclosure: I/we have no positions in any stocks mentioned, and no plans to initiate any positions within the next 72 hours. I wrote this article myself, and it expresses my own opinions. I am not receiving compensation for it (other than from Seeking Alpha). I have no business relationship with any company whose stock is mentioned in this article.
