BP: Getting Back On Track Shouldn't Be Too Hard Following Rebounding Results

When BP released their results for the third quarter of 2020, thankfully there were few sore points for shareholders with their dividend reduction now in the past.
Their operating cash flow has rebounded quite well as operating conditions improved versus the second quarter, which sets them up well heading forwards.
Their gearing ratio still sits a high 33% and thus they will want to deleverage back down to their target range of 20% to 30%.
Based upon my calculations, they should be capable of sufficiently deleveraging within two years once operating conditions broadly recover.
Even though their shares appear relatively cheap, I still believe in maintaining my neutral rating given their disappointing shareholder returns policy.
Introduction
An entire quarter has elapsed since BP (BP) took the painful decision to halve their dividends and thankfully this time around there were few sore points for their shareholders. Whilst this was arguably a necessary decision that has left their dividend yield moderate at just under 6%, the true disappointment is their new shareholder returns policy, as my previous article discussed. This article provides a new installment that takes a brief look at their latest results but more importantly given the recent Covid-19 vaccine hopes, their prospects to deleverage.
Executive Summary & Ratings
Since many readers are likely short on time, the table below provides a very brief executive summary and ratings for the primary criteria that was assessed. This Google Document provides a list of all my equivalent ratings as well as more information regarding my rating system. The following section provides a detailed analysis for those readers who are wishing to dig deeper into their situation.
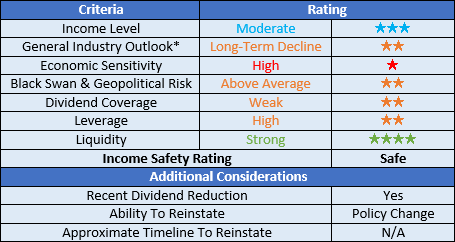
Image Source: Author.
*There are significant short and medium-term uncertainties for the broader oil and gas industry, however, in the long-term they will certainly face a decline as the world moves away from fossil fuels.
Detailed Analysis
![]()
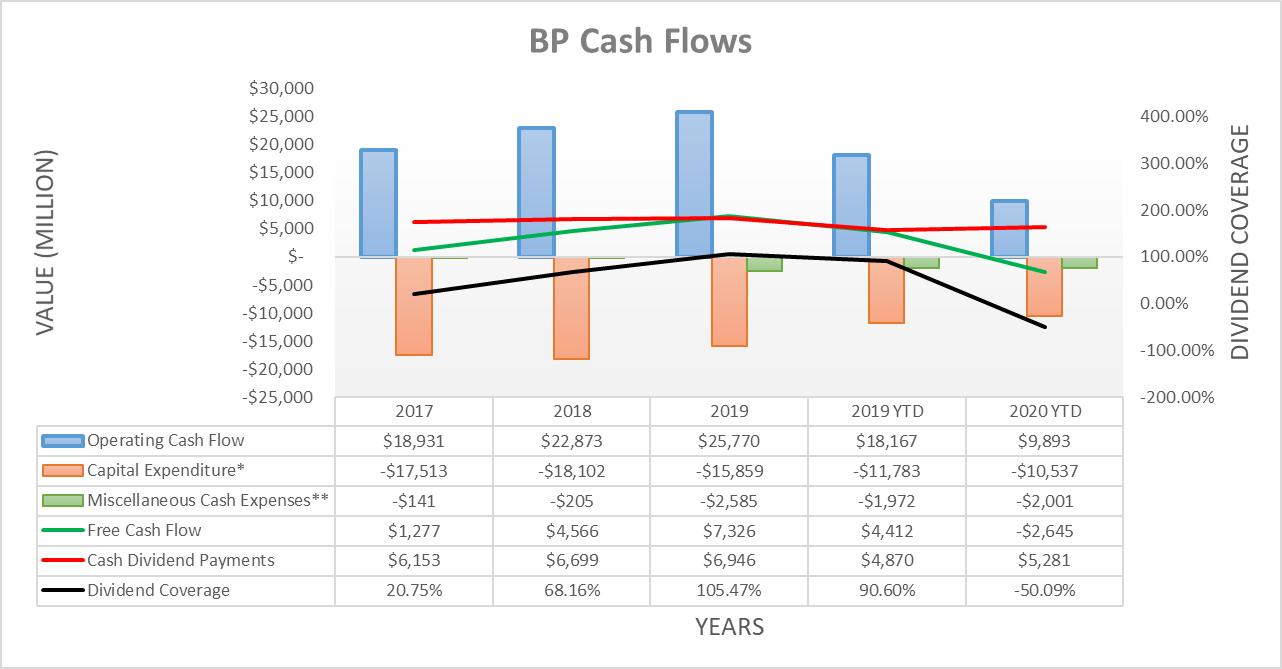
Image Source: Author.
Instead of simply assessing dividend coverage through earnings per share, I prefer to utilize free cash flow since it provides the toughest criteria and best captures the true impact to their financial position. The extent that these two results differ will depend upon the company in question and often comes down to the spread between their depreciation and amortization to capital expenditure.
The continued fallout from the Covid-19 pandemic left their operating cash flow for the first nine months of 2020 down 45.54% year on year. This was actually an improvement versus the first half of 2020 which was down a massive 61.28%, thanks to operating conditions improving during the third quarter versus the second quarter, as the graph included below displays. Despite this improvement, Brent oil prices averaging around $40 per barrel is still quite challenging, especially when combined with the sluggish refining margins.
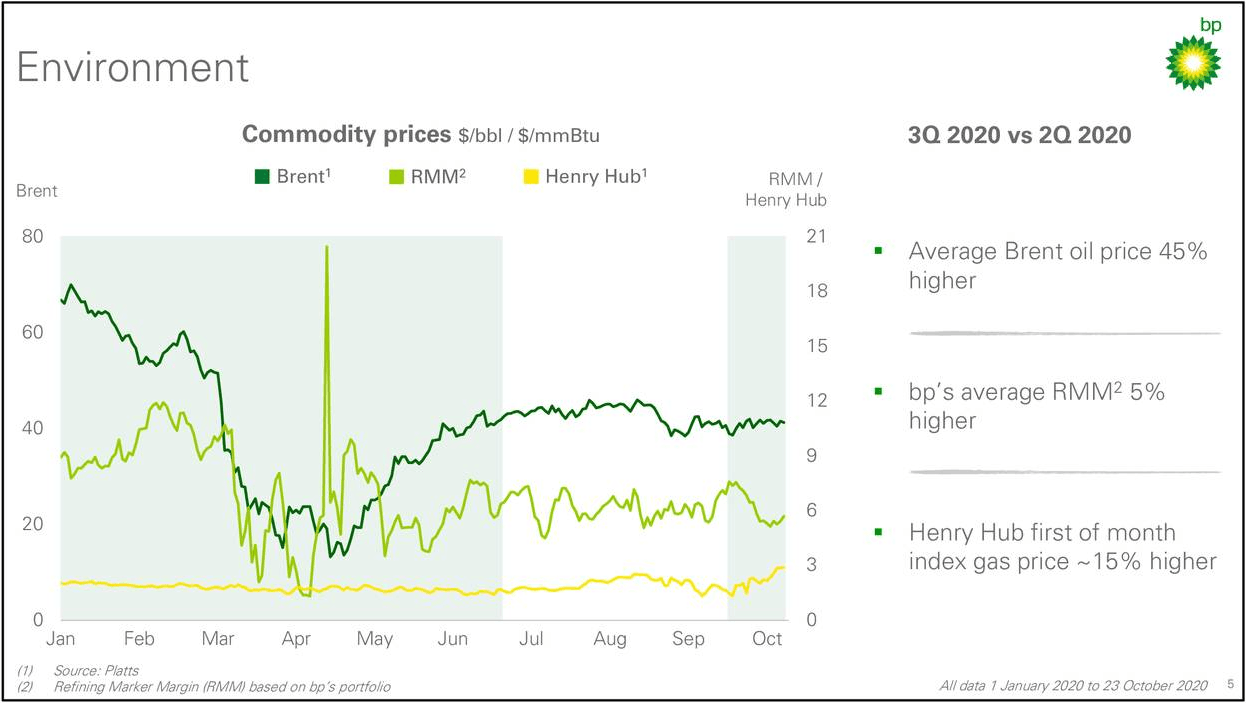
Image Source: BP Third Quarter Of 2020 Results Presentation.
Notwithstanding these challenging operating conditions, they still managed to generate $5.204b of operating cash flow during the third quarter of 2020 or $4.648b once removing the impacts of working capital. This is quite impressive and a positive sign for their potential to stage a comeback in the future since it only represents a decrease of 14.07% and 21.42% year on year respectively.
When looking at their ability to deleverage, this will ultimately depend on whether conditions continue to recover heading forwards and sadly, no one knows for certain but the recent positive news regarding Covid-19 vaccines gives hope. The first input is their expected future cash outflows, which were estimated to be $19.253b when conducting the previous analysis, please refer to my previously linked article if interested in the details of how this was derived.
The second input is their expected future operating cash flow once operating conditions have recovered. Throughout 2017-2019 their operating cash flow averaged $22.525b but the results from 2017-2018 were weighed down by relatively higher Gulf of Mexico oil spill payments then moving forwards and thus the result of $25.77b from 2019 makes a more suitable basis for future expectations. This means that in theory, they should have approximately $6.5b of free cash flow after dividend payments for deleveraging but given their volatile earnings and high capital intensity, an expectation of $5b is better suited since it allows for a margin of safety.
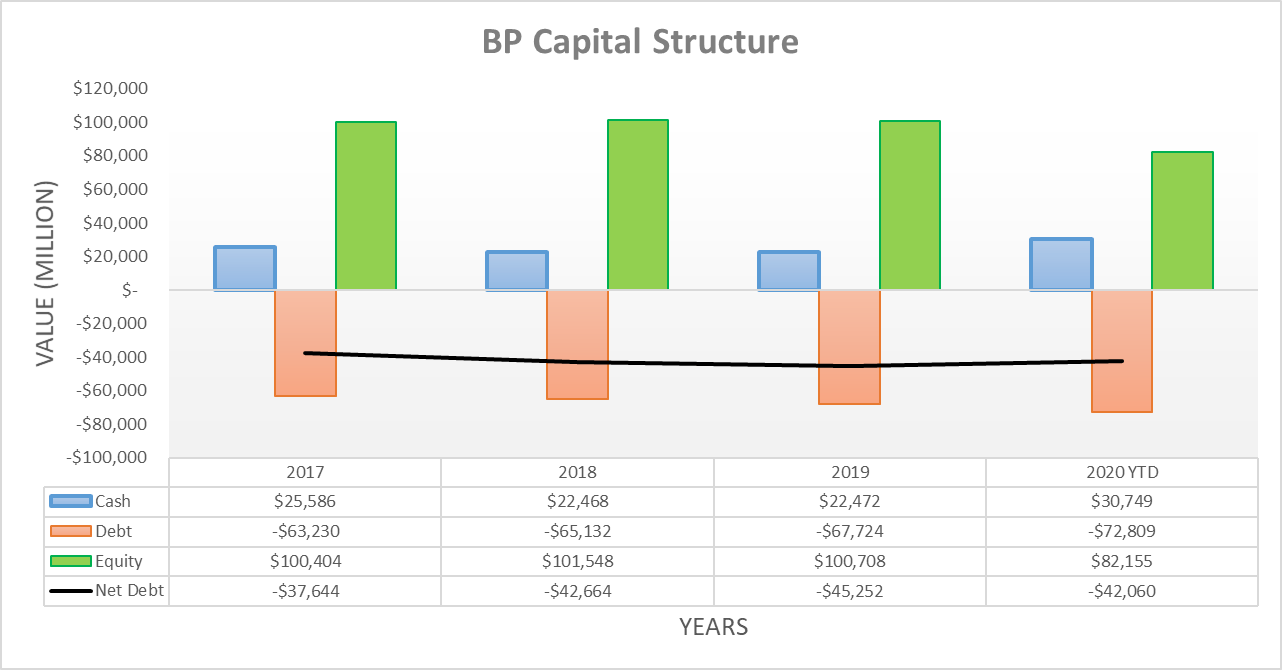
Image Source: Author.
When looking at their capital structure there has been no material changes during the third quarter of 2020 across all three of the main measurements. Their net debt currently stands at $42.06b with their equity sitting at $82.155b but the extent that they need to deleverage will depend upon their broader leverage.


Image Source: Author.
After reviewing their financial metrics it becomes apparent that their leverage is still sitting in the high territory with their gearing ratio of 33.86% sitting well above 30%. Whilst it would normally be preferable to also consider their other earnings-based financial metrics such as net debt-to-EBITDA and interest coverage, these have temporarily been rendered rather useless due to the massive impact to their earnings from this downturn.
They have normally targeted a gearing ratio of between 20% and 30% and thus their need to deleverage is easily apparent. To return their gearing ratio to 25%, it should be possible in only approximately two years based upon my calculations. This would see their net debt decreasing to $32.06b thanks to their previously discussed $5b per annum of free cash flow after dividend payments, meanwhile, this lower debt would boost their equity by $10b providing they avoid any further impairments and also abstain from any share buybacks.
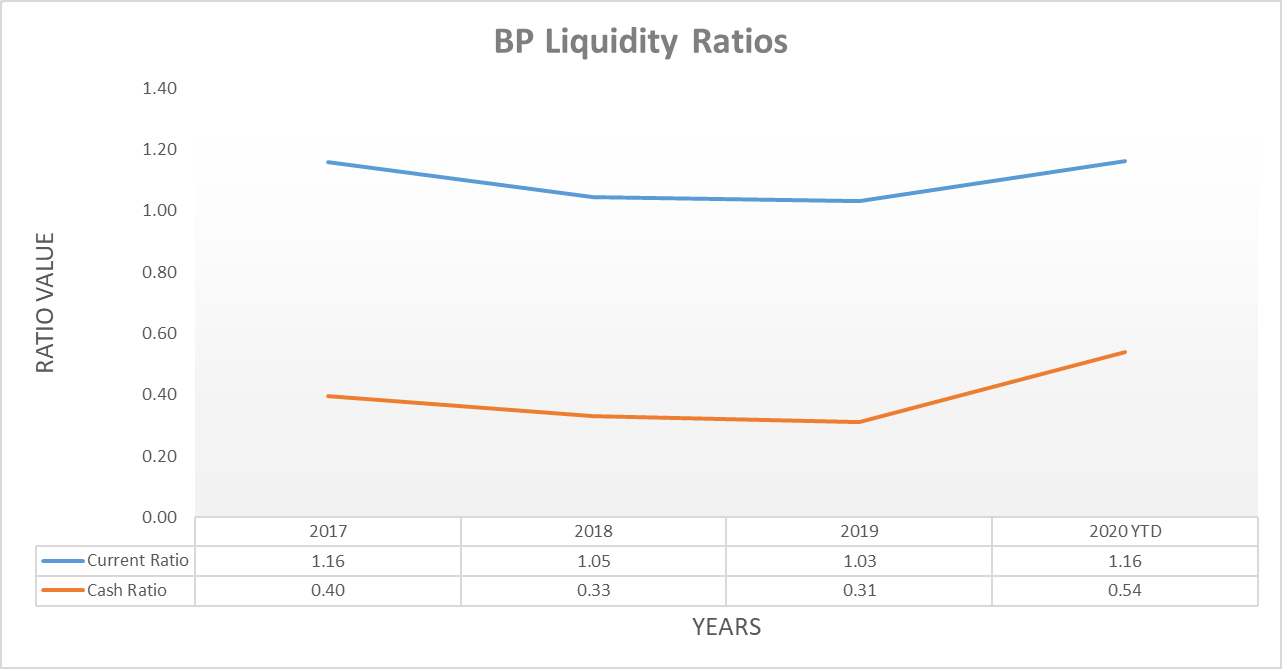
Image Source: Author.
Since their very large cash balance still sits at a massive $30.749b, it becomes quite obvious that their liquidity is strong, which is further evidenced by their current and cash ratios of 1.16 and 0.54 respectively. When this is combined with their very large size, decent overall financial position and supportive central bank policy, they should always find support in the debt markets to provide liquidity and refinance any upcoming debt maturities when required.
Conclusion
Thankfully the pain that shareholders suffered seeing their dividends halved should not be in vain as they now have the ability to deleverage sufficiently in only approximately two years. Even though their shares still appear relatively cheap, I believe in maintaining my neutral rating due to their new share buyback friendly shareholder returns policy, as discussed in my previous article.
Notes: Unless specified otherwise, all figures in this article were taken from BP’s Third Quarter 2020, Fourth Quarter 2019 and Fourth Quarter 2017 reports, all calculated figures were performed by the author.
Disclosure: I/we have no positions in any stocks mentioned, and no plans to initiate any positions within the next 72 hours. I wrote this article myself, and it expresses my own opinions. I am not receiving compensation for it (other than from Seeking Alpha). I have no business relationship with any company whose stock is mentioned in this article.
