Despite Strong Fundamentals, Eli Lilly Is In Short-Term Downward Trend

Eli Lilly got hit with a double dose of bad news back on October 26 and that sent the stock down to $130.
The stock peaked in July and has since seen a downward sloped trend channel form on the daily chart.
Throughout the health crisis, Lilly's fundamentals have remained strong while the sentiment toward the stock has changed very little.
By most measures, Eli Lilly (LLY) is a fundamentally sound company. It has seen its earnings grow by 18% per year over the last three years, it has a return on equity of 74.5%, and a profit margin of 28.8%. The trailing P/E is 23.9 and the forward P/E is only 18.2. All of these statistics sound pretty solid, right?
I know everyone has their own indicators that they like to use and some investors might not like Eli Lilly as much as others, but I don't see anything in the fundamentals that jumps out as a bearish indicator. The worst indicators I found were on the revenue growth. The company has only seen revenue grow by 1% per year over the last three years, but at least revenue has still been growing and hasn't been declining.
Lilly saw earnings grow by 4% in the third quarter and it saw revenue increase by 5% compared to Q3 2019. For the year as a whole, earnings are expected to grow by 18% and revenue is expected to grow by 6.3%. Looking out to 2021, we see that analysts expect the company to see earnings growth of 9.2% and revenue growth of 10%. Again, all of these figures are very respectable.
So why has the stock been trending lower since early July? I wrote an article on Lilly back on June 10 and stated that I was bullish on the stock, but would like the stock better at $130. At the time the stock was trading around $152. I suggested to readers that they write the August $130-strike puts on Eli Lilly and collect the $2.05 in premium. Those puts ended up being worthless at expiration and that created a gain of around 15% for anyone that sold the puts.
I even titled the article "I Like Eli Lilly, But I Like It Better At The $130 Level". The stock would end up dropping to $130 in late October, but the chart had changed dramatically at that point. When I wrote the article in June, I was watching a trend line that connected the lows from October 2019 with the low from March 2020. The drop in October took the stock below that trend line.
The big drop in October was caused by an earnings miss and as the company halted its COVID vaccine trial. The double dose of bad news caused the stock to drop 6.9% that day. The stock would eventually fall 17.8% from the October high to the October low.
Lilly has bounced back in the last five weeks, but the stock appears to have formed a downward sloped trend channel since July. If we connect the high from July with the high from October, we get an upper rail and the stock hit it in the past week.
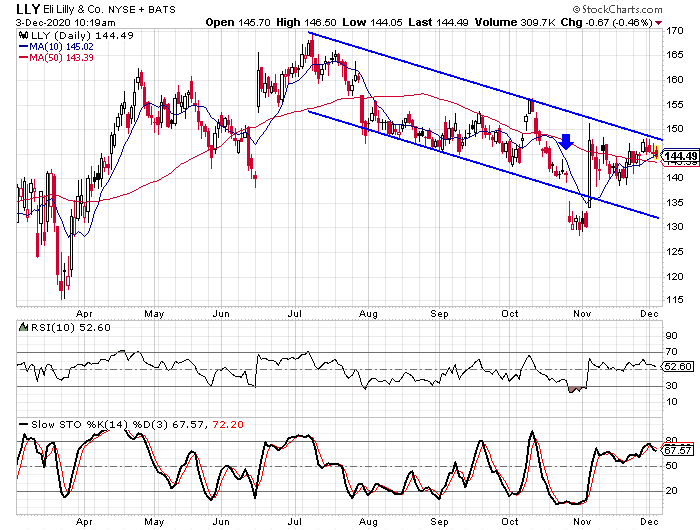
The lower rail isn't as clearly defined, but the parallel line connected a number of the lows in August. The extreme drop in October took the stock below the lower rail for a brief period.
We also see how the rally over the last five weeks moved the daily oscillators up near overbought territory before they turned lower in the last four days. Between the oscillators and the upper rail coming in to play, it looks to me like the stock is ready for another leg lower.
A Slight Shift in Sentiment after the Drop
When I wrote the article back in June, one of the biggest attractions to Eli Lilly was the sentiment being skewed to the bearish side-along with the fundamentals. As a contrarian, I like seeing a certain amount of pessimism being directed toward a stock with strong fundamentals. In Lilly's case the analyst ratings were well below average and the put/call ratio was higher than average. Both of those readings were indicative of pessimism. Here it is six months later and the stock has been through a 23% decline, yet the sentiment has changed very little.
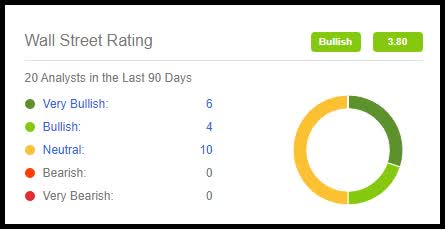
I used the Wall Street Journal's analysts' rating information back in June and it showed seven "buy" ratings, seven "hold" ratings, and one "sell" rating. I am using Seeking Alpha's analysts' ratings info now and it shows 10 "buy" ratings and 10 "hold" ratings. So slightly more analysts' coverage and the buy percentage is 50% where it was 46.7% back in June. Both of those figures are below the buy percentage of the average stock.
The short interest ratio is 1.3 currently and it was at 1.7 back in June. The short interest jumped to 5.33 million shares from 4.89 million shares in the first half of November, suggesting an uptick in bearish sentiment. The average short interest ratio is in the 3.0 range so both the current figure and the June figure are below average, meaning more optimistic than the average stock.
The one area where we have seen a big shift is with the put/call ratio. We have seen the ratio move from a reading that was more bearish than average to one that is more bullish than average. The current ratio is at 0.796 with 55,561 puts and 69,829 calls open at this time. The average put/call ratio is in the 1.0 range and Lilly's was at 1.3 back in June.
What I see in the sentiment indicators is that analysts haven't changed their opinions, short sellers are still slightly more bullish than they were, and option traders are significantly more bullish.
My Current Take on Eli Lilly
I still like Eli Lilly's fundamental indicators. The earnings growth and revenue growth have held up rather well during the global health crisis and they are expected to rebound in 2021. The antibody COVID treatment bamlanivimab that was paused in October was eventually given FDA approval on November 9. All of this is good news on the fundamental front.
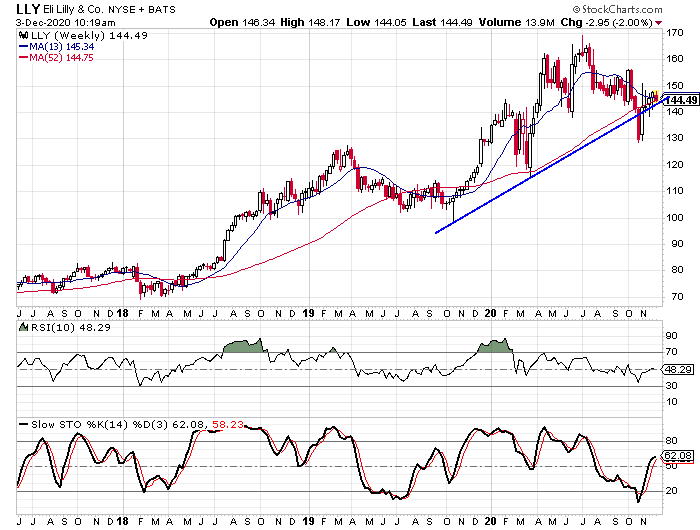
Unfortunately the technical picture and the sentiment analysis are areas of concern. Essentially the daily chart and the weekly chart are at odds. The pattern on the daily chart is showing a downward trend and if it holds true, we could see another decline in the stock. The weekly chart shows that the stock is trying to remain above the trend line that connects the lows from October '19 and from March '20. The stock is also hovering just above the 52-week moving average.
The fact that the sentiment has gotten slightly more bullish as the stock fell is also a concern. The overall sentiment picture isn't showing signs of excessive optimism, but it's a little troubling that it became more bullish as the stock was falling.
Right now I think the $140 level is a critical point for the stock. The stock found support in that area back in June just before it rallied to the $169 area. It would also be encouraging to me if the stock does see another move lower, but if it doesn't drop all the way down to the $130 level, it would be a higher low and that could help confirm a new upward trend.
Overall, I am still bullish on Lilly for the long term. The short-term picture is a little muddled right now and that is based on the technical analysis and the sentiment. There are two key levels that need to hold up on any move lower-the $140 level and the $130 level. If the $140 level holds, that should serve as a sign that the worst is over and the stock has reversed the downward trend from the last five months. If the stock re-tests the $130 level and that holds, that will suggest that a long-term bottom is in.
If you would like to learn more about protecting and growing your portfolio in all market environments, please consider joining The Hedged Alpha Strategy.
One new intermediate to long-term stock or ETF recommendation per week
One or two option recommendations per month
Bullish and bearish recommendations to help you weather different market conditions
A weekly update with my views on the market, events to keep an eye on, and updates on active recommendations
Disclosure: I/we have no positions in any stocks mentioned, and no plans to initiate any positions within the next 72 hours. I wrote this article myself, and it expresses my own opinions. I am not receiving compensation for it (other than from Seeking Alpha). I have no business relationship with any company whose stock is mentioned in this article.
