Crestwood Equity Partners: Upcoming Capital Expenditure Cuts Could Manage To Secure The Distribution

Even though they have been under pressure, Crestwood Equity Partners has continued to sustain their distributions.
There finally appears to be a glimmer of hope on the horizon, but their distributions are nonetheless still risky and skating on thin ice.
Their distribution coverage appears set to soar to strong levels, provided their preliminary 2021 guidance comes to fruition.
Sadly, their very high leverage keeps their distributions risky since deleveraging will be very slow unless their distributions are reduced.
I, nonetheless, still feel that a bullish rating is appropriate since their very high distribution yield of 15% should at least compensate for this risk.
Introduction
Ever since the COVID-19 pandemic sent the unit price of Crestwood Equity Partners (NYSE:CEQP) crashing, they have traded with a very high distribution yield that still sits at almost 15% as investors worry that a reduction is forthcoming, as discussed in my previous article. They have nonetheless defied this pressure, and whilst they still remain risky, there now appears to be hope on the horizon, with this article providing a follow-up analysis that includes their latest financial results.
Executive Summary And Ratings
Since many readers are likely short on time, the table below provides a very brief executive summary and ratings for the primary criteria that were assessed. This Google Document provides a list of all my equivalent ratings as well as more information regarding my rating system. The following section provides a detailed analysis for those readers who are wishing to dig deeper into their situation.
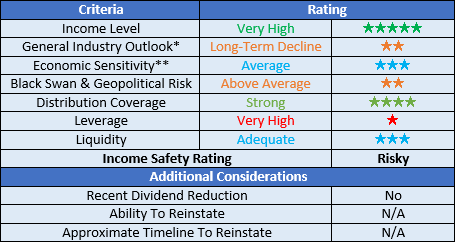
Image Source: Author
*There are significant short and medium-term uncertainties for the broader oil and gas industry. However, in the long term, they will certainly face a decline as the world moves away from fossil fuels.
**Whilst the oil and gas industry to which they service has high economic sensitivity, given the more stable nature of the midstream sub-industry, this was deemed to be average.
Detailed Analysis
![]()
Image Source: Author
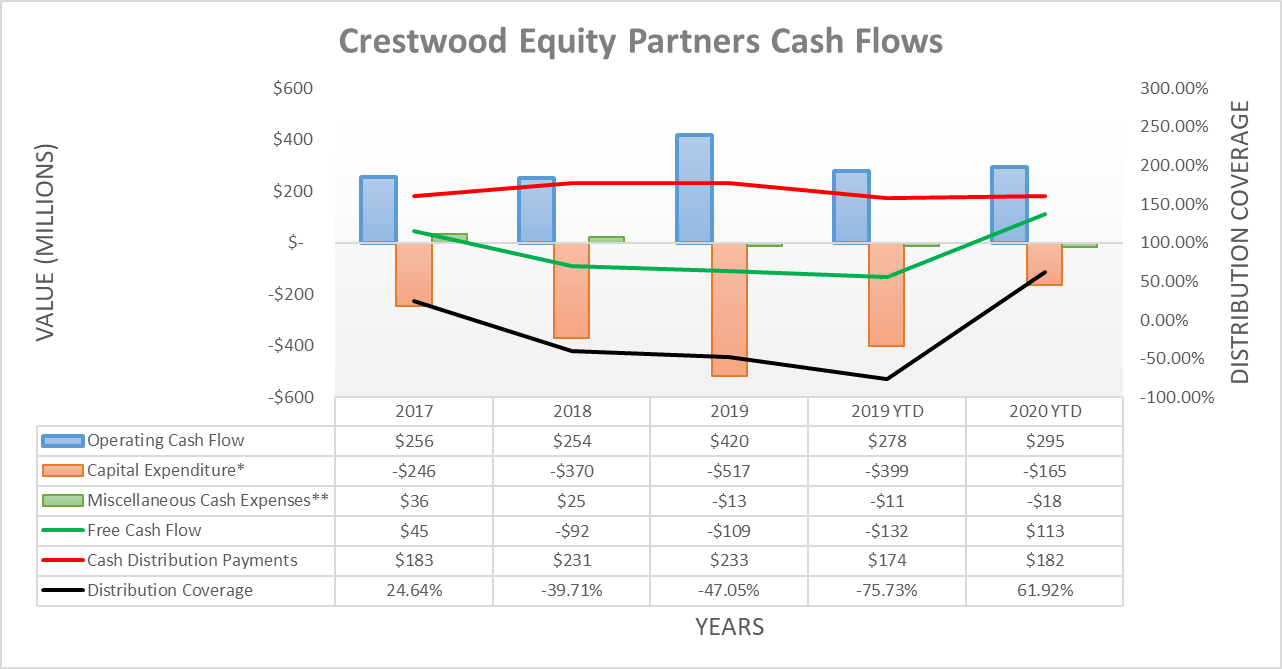
Instead of simply assessing distribution coverage through distributable cash flow, I prefer to utilize free cash flow since it provides the toughest criteria and best captures the true impact to their financial position. The main difference between the two is that the former ignores the capital expenditure that relates to growth projects, which, given the very high capital intensity of their industry, can create a material difference.
One of two main areas of concern regarding the sustainability of their distributions has been their very weak coverage that only sat at 61.92% during the first nine months of 2020 and, thus, left them reliant on debt-funding to bridge the gap. Their operating cash flow has held up remarkably well during this period of time at $295m versus $278m year on year, with the impacts of working capital only having a negligible impact. Whilst this has helped sustain their distributions, the more important story right now is actually their capital expenditure.
The third quarter of 2020 seems to have marked the end to their high capital expenditure, with it only increasing $16m during the fiscal quarter, versus an average of $75m for the two preceding fiscal quarters. Whilst one fiscal quarter of low capital expenditure is hardly too exciting, during their third quarter of 2020 results conference call, management provided the following preliminary guidance for 2021 that gives hope that their lower capital expenditure is here to stay.
“I wanted to provide some preliminary color on what we expect heading into 2021. based on current conversations with customers, we expect our 2021 guidance range to be similar to 2020…”
“…we expect growth capital to be less than $40 million and maintenance capital to be $20 million or less in 2021. With the resiliency in our portfolio, driving relatively flat year-over-year cash flow and the significant reduction in year-over-year capital expenditures, we expect to generate meaningful free cash flow after distributions in 2021…” - Crestwood Equity Partners Q3 2020 Conference Call
If their actual results end up in line with this preliminary guidance, then it will mark a massive difference, as their capital expenditure guidance for 2021 of only $60m is 63.64% lower than just the first nine months of 2020 alone. It seems reasonable to assume that their 2021 operating cash flow should remain broadly in line with that of 2020, given their other commentary about their 2021 guidance range being similar to that of 2020. This means that, based on their annualized results from the first nine months of 2020, their operating cash flow for 2021 would be $370m, and thus, their free cash flow would be approximately $310m. Since their total distributions to both common and preferred unitholders equal $242m per annum, this coverage would be strong at approximately 128%, with approximately $68m per annum being left to deleverage.
Whilst this seems quite positive, there are two important considerations. Firstly, their much larger peer, Energy Transfer (ET), also had plans to generate free cash flow after distribution payments in 2021 and still halved their distributions anyway. The second consideration is that the riskiness of their distributions did not just stem from their very weak coverage but also their overall financial position.

Image Source: Author
Overall, their capital structure saw virtually no change across all three of the main measurements during the third quarter of 2020. This would indicate that their leverage has not materially changed, which is better than it deteriorating, but more is still to be done since $68m per annum of free cash flow after distribution payments only reduces their net debt by 2.68% per annum.
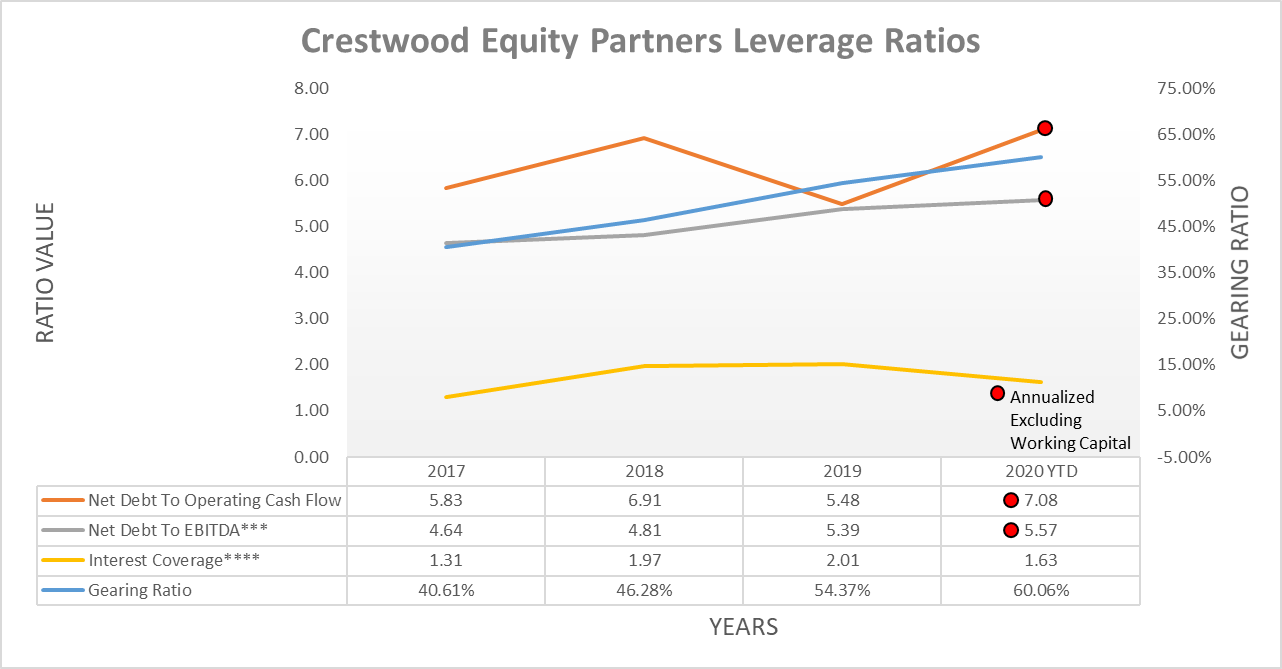

Image Source: Author
Whilst their leverage has slightly improved during the third quarter of 2020, it nonetheless still sits in the very high territory. Not only does their net debt-to-EBITDA exceed 5.00, but their net debt-to-operating cash flow is even higher at a worrying 7.08, plus their interest coverage is quite low at 1.63, and their gearing ratio is very high at 60.06%. Whilst their resilient earnings and massive capital expenditure reductions are likely to ensure that they remain a going concern provided that their liquidity is at least adequate, the previously discussed slow rate of deleveraging will continue posing risks to their distributions.
I always strive to keep a uniform approach to calculating EBITDA across all of my analyses to remain consistent and, thereby, enhance their comparability, but at times, this may cause them to differ from the numbers that management publishes. It should be remembered that these financial metrics are non-GAAP measurements and, thus, different managerial teams have their own discretion when calculating adjusted EBIDTA and so forth, and whilst I am not suggesting that anything underhanded is occurring, I would rather rely on numbers calculated from the financial statements within their SEC filings.
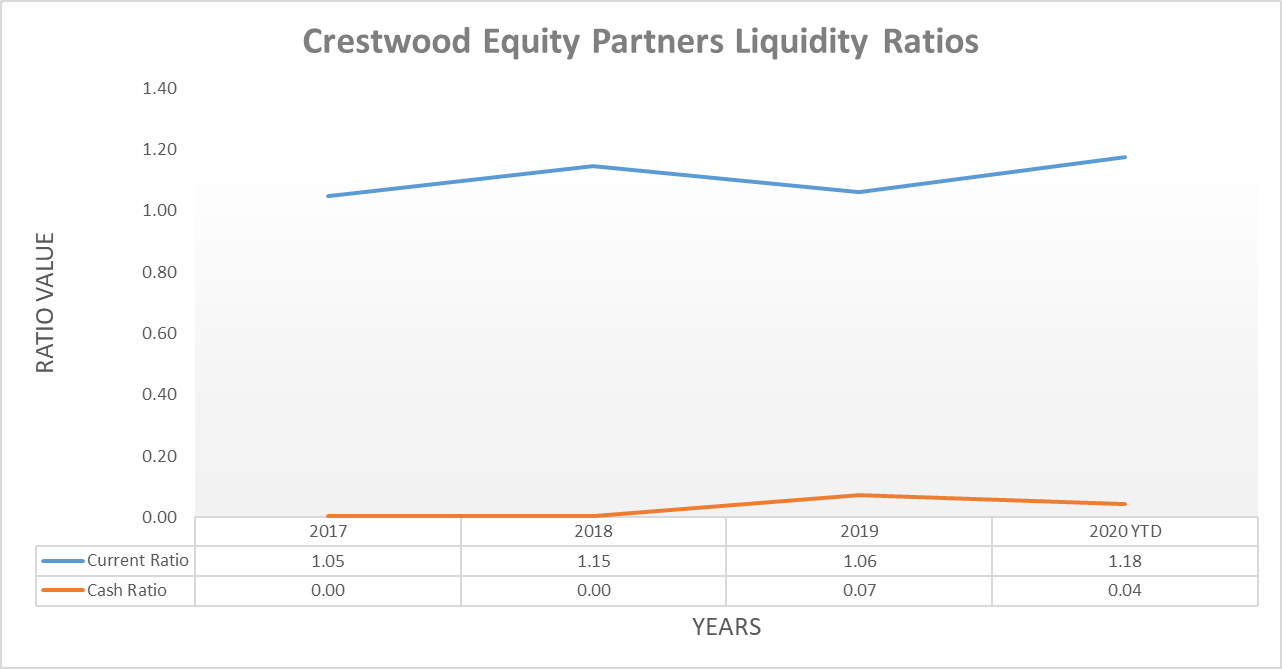
Image Source: Author
Thankfully, their liquidity is adequate, which means that their very high leverage does not pose an immediate threat to their ability to remain a going concern, but still does not mean that distributions are safe since they still need to deleverage. Their current ratio of 1.18 is strong. However, their almost non-existent cash balance leaves them reliant on their credit facility, which still has $446m available. Since they do not face any debt maturities until April 2023, they have modest room to arrange repayment or refinancing, as the table included below displays.

Image Source: Crestwood Equity Partners Q3 2020 10-Q
Conclusion
Whilst there appears to be hope on the horizon that their distributions can just manage to survive this downturn, fundamentally, this still appears to be risky until such time as they deleverage. Even though this may not appear bullish, I nonetheless still believe that maintaining my bullish rating is appropriate since their very high distribution yield of 15% should at least compensate for this risk.
Notes: Unless specified otherwise, all figures in this article were taken from Crestwood Partners’ Q3 2020 10-Q (previously linked), 2019 10-K and 2017 10-K SEC Filings, all calculated figures were performed by the author.
Disclosure: I am/we are long CEQP.PR. I wrote this article myself, and it expresses my own opinions. I am not receiving compensation for it (other than from Seeking Alpha). I have no business relationship with any company whose stock is mentioned in this article.
