Successful Value Investing Changes Drastically In 2020

Some investors claim value investing is dead and will remain dead post-Covid. This is based on their annual underperformance compared to growth of 6.1% since 2007, which worsened in 2020.
Most investors claim that this is caused by incremental power of tech stocks and 0% interest rates. This article refutes this and provides the two real reasons behind the underperformance.
Value stocks are very likely to outperform over the coming years. However, to be successful with value investing, one needs to drop its old definition which has become irrelevant today.
This article provides a new definition of value stocks, which has outperformed the old definitions by 7.6% and 21.5% this year. The 50 S&P 500 stocks which are ranked the highest on this metric are provided.
Moreover, I add another dimension to this strategy which more than doubled the S&P 500 return over the past decade. My favourite pick of this strategy is discussed at the end of the article.
In September, a reaction on my article "an important warning for a major sector rotation", claimed that value investing is dead, a very aggressive statement which followed many years of significant value underperformance.
Fortunately for value investors, their stocks revived since the correction in September. The value-weighted Russel 2000 ETF (IWM) outperformed the tech-weighted SPDR S&P 500 ETF (SPY) and Invesco QQQ ETF (QQQ) by a staggering 12.47% and 14%.
Given the recent extreme stock market volatility (especially the divergence between sector performance) and the uncertainty about how the future economy will look like, most investors can't see the forest for the trees. Is value investing still interesting to generate strong returns in the future and why?
I believe the answer to that question is yes. However, after the Covid-19 crisis, I believe it is becoming increasingly important to get rid of the old theory of value investing (a statement backed by empirical evidence) and start approaching value investing in a different way, which will be discussed in this article.
Take your time to read this article, I believe it is one of the most valuable I have written so far.
The old value investing definition: from 6.1% outperformance to 6.1% underperformance
Let's start with the "old" definition of value investing, according to Investopedia:
Value investing is an investment strategy that involves picking stocks that appear to be trading for less than their intrinsic or book value. Value investors actively ferret out stocks they think the stock market is underestimating.
In the past, researchers have found that one can outperform the market significantly by buying value stocks i.e. stocks who are valued at a low P/E or low price/book value ratio. Why?
Pioneers Fama & French in 1992 argued that this is caused by their risk: these stocks have a probability of becoming less profitable in the future and this risk is discounted by the market.
In contrast, Lakonishok et al. in 1993 argued that this is caused by the mistakes of the typical investor. Typical investors tend to overreact on bad news and value investors generate alpha by buying these stocks at cheap prices.
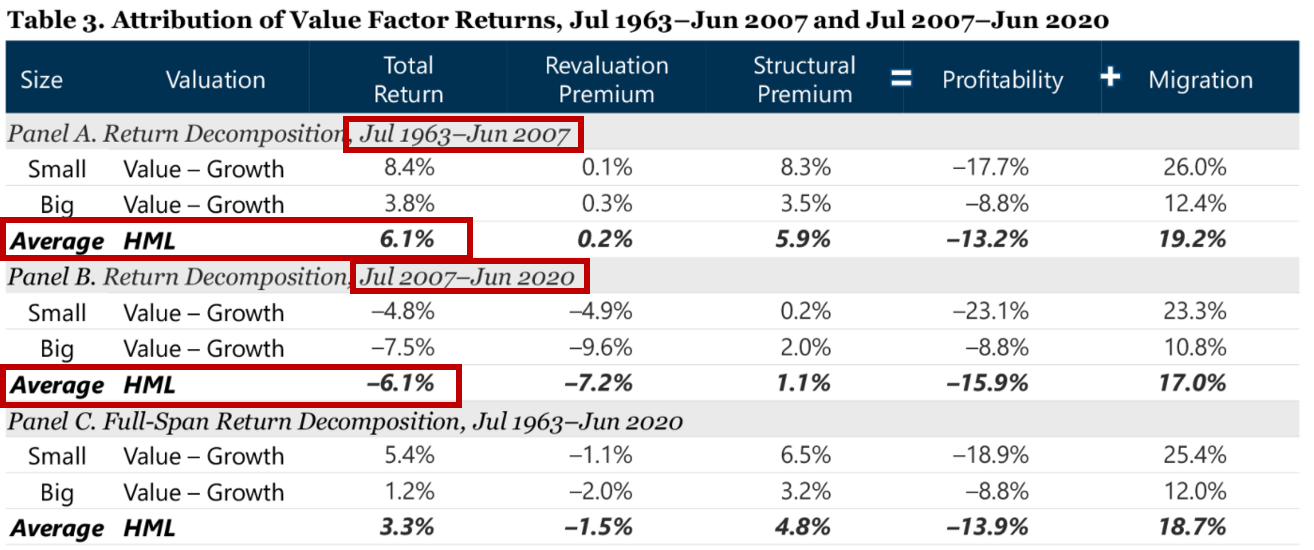
The historical outperformance of value compared to growth stocks is well visualised in the table below. This table shows the results of building a portfolio each month of the stocks which are ranked as 30% cheapest based on the price-to-book value (value stocks) and selling the 30% most expensive ones (growth stocks) each month. This strategy would've returned 6.1% annually between 1963 and 2007.
In other words: value stocks outperformed growth stocks by 6.1% annually in the past.
 (Source: Researchaffiliates)
However, this changed drastically after 2007. Over the past 13 years, this value strategy returned a negative 6.1%, indicating that value investing is "dead".
The recent value underperformance compared to other strategies is also visualized in JP Morgan's research. While the value strategy (red border) has generated significant alpha consistently in the past, since 2015 it has been the worst performing strategy for three years out of six. This year was the biggest outlier as it underperformed the best strategy, Momentum, by a staggering 28.4%.
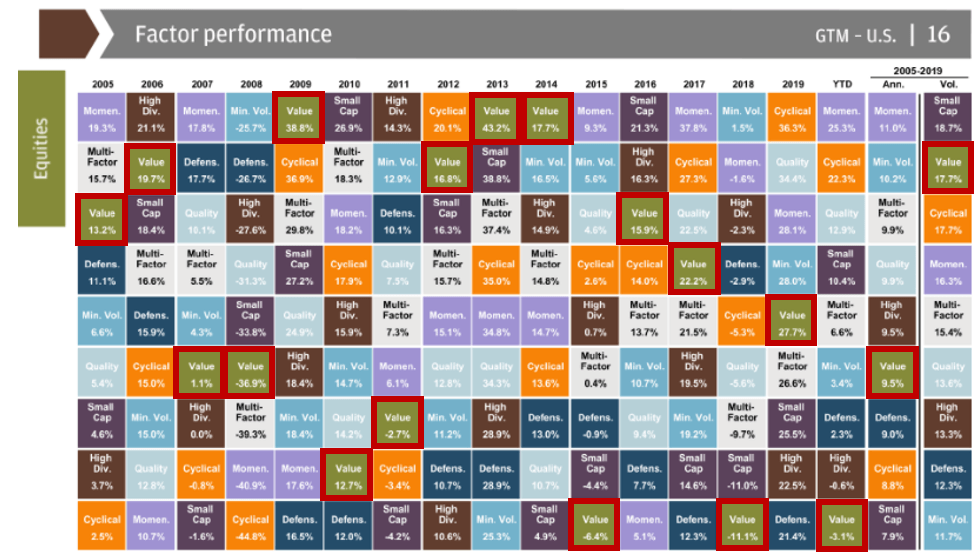
(Source: JP Morgan's Guide to the markets)
Reasons for recent value underperformance
The reasons why value stocks underperformed so significantly recently, has been a widely discussed topic on sites like SeekingAlpha.
Unfortunately, most of these discussions were not evidence-based. In contrast, Arnot et al. wrote a very good paper which discusses these reasons empirically.
First, they refuted several believes of the average investor, of which the following two are the most common:
1. Stronger financial performance for growth stocks?
Many investors argue that today "technological leaders can drive outsized monopolistic profits, while the old value stocks are choked into irrelevance", more than it has ever been. As such, growth stocks' recent outperformance is fundamentally based. Higher growth deserves a higher multiple.
Arnot et al. provided evidence which contradicts this thesis. In my recent article I also found that the strong performance of the FAAMG stocks - Facebook (FB), Apple (AAPL), Amazon (AMZN), Microsoft (MSFT) and Google (GOOGL) - is not caused by higher earnings growth compared to the past.
2. Low interest rates?
We are currently operating in an unprecedented monetary environment with near-zero interest rates. Investors claim that growth stocks are the main beneficiary of this "free money" and therefore are worth their higher valuation multiple.
In contrast, the Gordon valuation method shows that low interest rates should have "a disproportionate valuation impact on longer-duration and lower-yielding assets".
Moreover, Arnott et al. found that since 1926, there has been no relation between interest rates and valuations and that value stocks benefit more from low interest rates given their higher debt.
So, if financial performance and low interest rates are no sound theory to explain the value underperformance, what is? Arnot et al. found two theories.
1. Revaluation
Arnott et al. decompose the relative performance of value compared to growth stocks in three factors:
- Migration: the change in stocks included in the portfolios, which occurs when value stocks appreciate and when growth stocks falter. Because value strategies underweight or short growth stocks, an underperforming growth stock enhances these strategies’ returns.
- Profitability: most growth stocks are more profitable and exhibit faster growth in sales and profits than most value stocks. Profitability benefits growth relative to value and offsets much, but typically not all, of the benefits from migration.
- Revaluation: the change in relative valuation of growth versus value.
As you can see in the first table of this article, the structural premium, which consists of profitability and migration, was basically flat since 2007 and thus had no impact on the value underperformance.
In contrast, revaluation had a negative impact on value stocks of 7.2% annually since 2007. The table and graph below underscore this phenomenon.
The table shows that relative valuation of value stocks compared to growth stocks has grown from 14-60% (value was expensive to normally priced) in 2007 to 88-100% (value extremely cheap) in June 2020 based on several value portfolios.
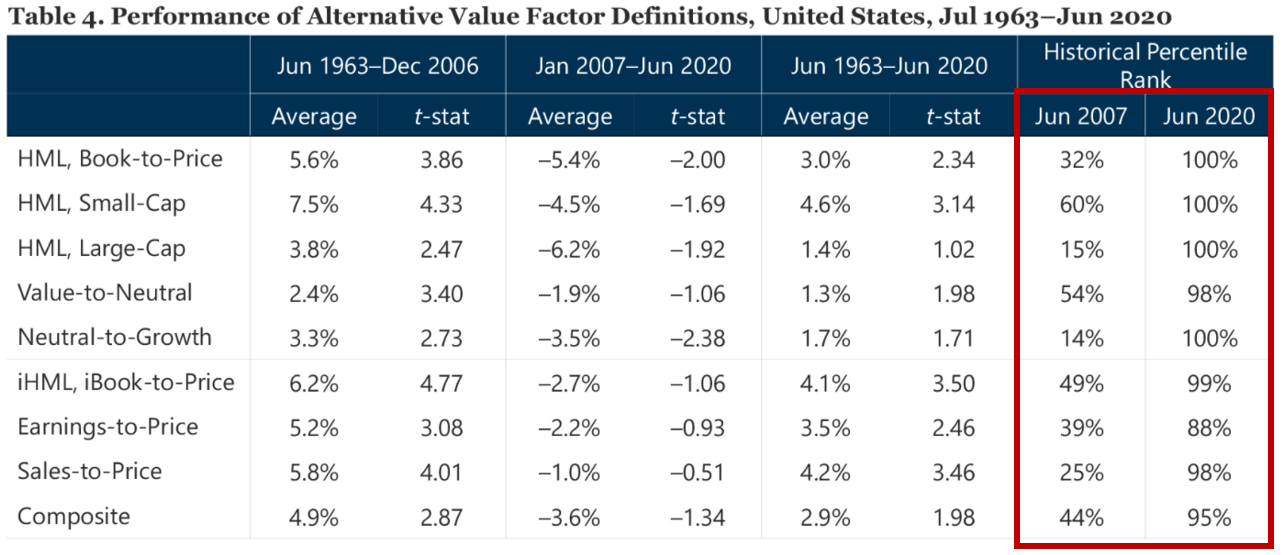
(Source: Researchaffiliates)
The graph below shows that based on the Russel Value and Russel Growth ETFs, the relative valuation of value based on a forward P/E ratio has not been this cheap since 2000.
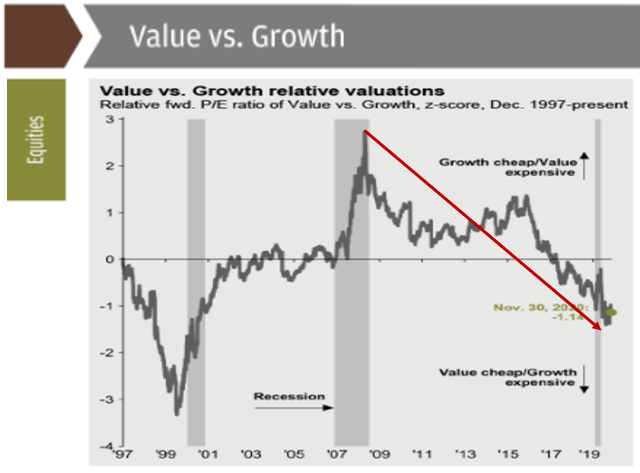
(Source: JP Morgan's Guide to the markets)
2. The irrelevance of historical value metrics
Another reason why value stocks underperformed significantly recently is the increasing irrelevance of several metrics which are used to define value stocks.
In particular, value stocks based on the book-to-market ratio outperformed the market significantly in the far past, according to Fama & French.
However, the book-to-market ratio is becoming less relevant in today's economy as the ability of a company to generate cash flows is depending more and more on intangible assets such as human resources, brand name, the network effect, patents and intellectual property.
Interestingly, Arnott et al. found that when including these intangible assets in the book value, the annual return of value stocks was 2.7% higher since 2007.
Value stocks should start outperforming, but you will need to adapt to this "new strategy" to be successful
So, what have we learned until now?
The significant recent underperformance of value stocks (in their old definition) is entirely caused by revaluation. As this dynamic in the long run has always reverted to its mean, value stocks are very likely to outperform going forward.
However, to become a successful value investor in the future, one should start applying new metrics as business has changed dramatically over the past decade and in particular over the past year. In this section, I will discuss our new definition of value investing which should outperform the old one over the coming decades.
A "high-quality value stock" is a stock which is significantly undervalued (value factor) by the market (oftentimes caused by weak short term sentiment), but has a strong moat (quality factor) which will protect its future cash flows from competition.
This moat, popularized by Warren Buffett, is a distinctive advantage compared to competitors. This will become increasingly important post-Covid as a consequence of the acceleration of the "new economy" which is build around digital innovation and intangible assets. Companies without a moat will see their cash flows vanish and will become "value traps".
As value factor, I believe the free cash flow yield (free cash flow/market capitalization) is a much better indicator than the P/E or price/book value ratio. The reasoning behind this is beyond the scope of this article. The average free cash flow yield is currently around 5% and thus a stock trading above 5% can be seen as cheap compared to the market.
To look for strong moat companies, the return on invested capital ("ROIC") (operating income/invested capital) is my primary indicator. This is a rather advanced metric about which I have written a separate article.
Basically, the ROIC tells us how much profits a company can generate with the investments it has made. This metric is significantly related with the value of intangible assets. If a company can generate strong profits with its moat based on intangible assets such as patents, a strong brand name and intellectual property, it will generate a high ROIC (>15% can be seen as high).
The ROIC is extremely important to determine the ability of a company to generate long term shareholder value. A low ROIC indicates that the company won't be able to grow profits in the future or needs extreme amounts of capital to defend its current profits.
Ask yourself this:
Why would you want to buy shares of companies with the aim to make a profit on your investment, while these companies can't make profits on their investments themselves?
So, how would've you performed with this "new way of value investing" so far? To answer that question, I have performed a portfolio-based research similar to Arnott et al.
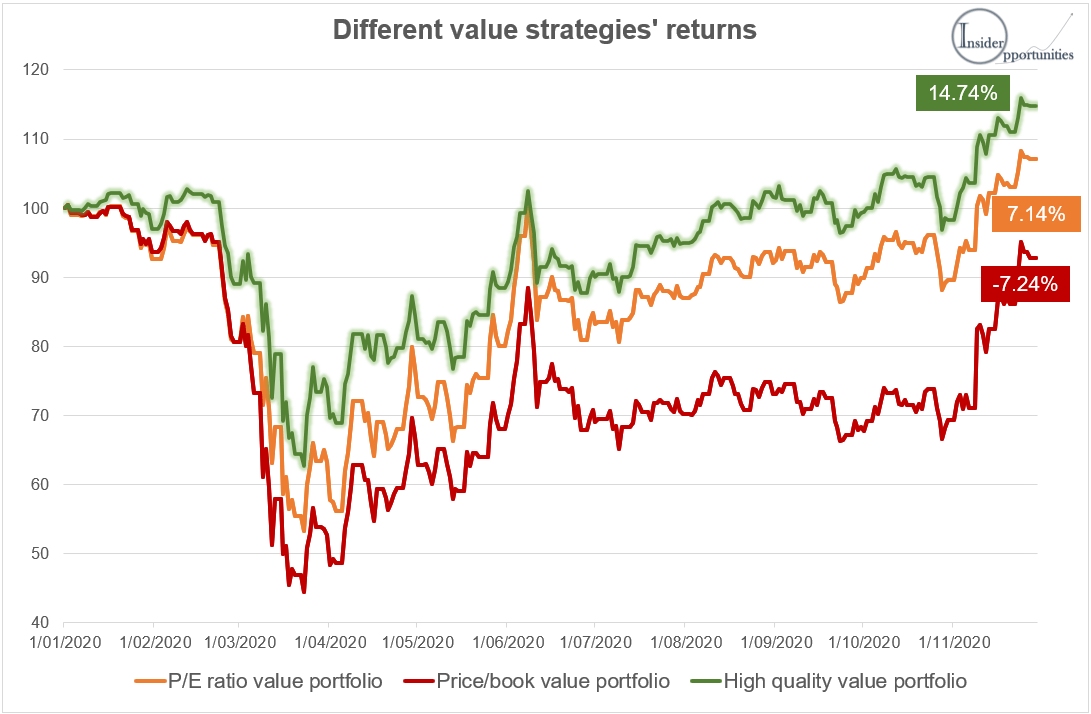
In the chart below, you can observe a comparison of the performance of portfolios created with the 10% cheapest stocks of the S&P 500 (rebalanced each month) based on the book-to-market ratio, P/E ratio and our high-quality value ratio (combination of free cash flow yield and ROIC). The year-to-date results are striking:
- High-quality value index (green): a return of 14.74%, which is even better than the S&P 500 index. This is astonishing given the fact that 2020 was THE year of big tech stocks which drove up the S&P 500 but were not included in the high-quality value index.
- PE index (orange): a return of 7.14%. Not bad, but a significant underperformance of "high quality value stocks" by 7.60%.
- BM index (red): a return of -7.24%. This confirms the earlier findings that investing in stocks with a high book value underperforms significantly. We expect that its recent catching up is a death cat bounce based on the vaccine news and see further underperformance over the coming decade.
 (Source: Insider Opportunities Research, data retrieved from Refinitiv)
Below, I included a list of the stocks which would be eligible for the High quality value index today, ranked from high to low:
| Company | Ticker | FCF yield | ROIC |
| NRG Energy | NRG | 18.18% | 74.01% |
| HP Inc. | HPQ | 13.93% | 76.3% |
| Biogen Inc. | BIIB | 13.76% | 31.55% |
| Western Union Co | WU | 9.12% | 37.35% |
| NetApp | NTAP | 7.58% | 35.99% |
| Philip Morris International | PM | 7.24% | 36.67% |
| Lockheed Martin Corp. | LMT | 6.79% | 43% |
| Robert Half International | RHI | 6.97% | 41.16% |
| Vontier | VNT | 9.14% | 22.29% |
| AutoZone Inc | AZO | 6.41% | 43.81% |
| Progressive Corp. | PGR | 8.52% | 24.42% |
| AbbVie Inc. | ABBV | 9.92% | 20.52% |
| Cincinnati Financial | CINF | 9.28% | 21.01% |
| Otis Worldwide | OTIS | 5.98% | 48.5% |
| Best Buy Co. Inc. | BBY | 6.76% | 31.5% |
| Ulta Beauty | ULTA | 6.21% | 37.93% |
| Cabot Oil & Gas | COG | 8.35% | 21.67% |
| Allstate Corp | ALL | 13.39% | 16.82% |
| Omnicom Group | OMC | 11.65% | 17.56% |
| T. Rowe Price Group | TROW | 6.84% | 27.52% |
| ConocoPhillips | COP | 12.20% | 16.15% |
| Hologic | HOLX | 7.34% | 22.04% |
| Xerox | XRX | 25.15% | 13.95% |
| Hanesbrands Inc | HBI | 13.62% | 15.68% |
| ViacomCBS | VIAC | 66.27% | 13.11% |
| Delta Air Lines Inc. | DAL | 8.54% | 20.12% |
| Cisco Systems | CSCO | 7.42% | 21.09% |
| United Airlines Holdings | UAL | 15.30% | 14.29% |
| NVR, Inc. | NVR | 5.97% | 33.62% |
| Automatic Data Processing | ADP | 5.54% | 33.65% |
| Booking Holdings Inc | BKNG | 5.57% | 31.7% |
| Citrix Systems | CTXS | 5.32% | 35.57% |
| Alexion Pharmaceuticals | ALXN | 8.00% | 18.88% |
| Intel Corp. | INTC | 7.22% | 20.61% |
| Cummins Inc. | CMI | 6.64% | 21.84% |
| Amgen Inc. | AMGN | 7.00% | 20.6% |
| Southwest Airlines | LUV | 7.75% | 18.35% |
| Synchrony Financial | SYF | 41.04% | 11.73% |
| Campbell Soup | CPB | 6.74% | 20.74% |
| Snap-on | SNA | 9.04% | 16.6% |
| LyondellBasell | LYB | 7.46% | 18.34% |
| Humana Inc. | HUM | 8.40% | 16.88% |
| International Business Machines | IBM | 10.22% | 14.42% |
| Huntington Ingalls Industries | HII | 6.50% | 20.96% |
| Masco Corp. | MAS | 4.65% | 36.61% |
| Hartford Financial Svc.Gp. | HIG | 20.52% | 11.77% |
| Electronic Arts | EA | 4.53% | 41.58% |
| Accenture plc | ACN | 4.78% | 31.68% |
| D. R. Horton | DHI | 8.89% | 15.87% |
| Motorola Solutions Inc. | MSI | 5.35% | 24.9% |
(Data from Refinitiv could include some errors)

(Open source)
Successful value investing taken to another level
The only problem with the above-mentioned strategy is the fact that the valuation and quality metrics are backward-looking. While most companies with a strong moat (indicated by a high ROIC) are able to keep their strong competitive position in the future, some of them are not.
Many investors look at analyst expectations to determine how the future will look like, which is also the reason why the market tends to significantly react on up- or downgrades. I don't believe analysts have enough information to predict the future, backed by empirical evidence.
At Insider Opportunities, we have created a unique value strategy which utilises insider trades as forward-looking indicator.
Insiders are the high managers of the firm (CEO, CFO, board members...) who know their company better than anyone else as they are dedicating their lifetime to it. Insiders sometimes purchase their own shares (we are talking about real purchases here, no options), registered by the SEC, with one goal: to make a profit. You can track insider purchases (more than 1000 each month) via the SEC website or screeners like openinsider.com.
Insiders on average outperform the market significantly, caused by three factors:
- Contrarian belief: Piotroski, J. D., & Roulstone, D. T. (2004) found that insider purchases are inversely related to recent returns. Insiders tend to buy their stock when the negative sentiment around their stock is unjustified.
- Superior cash flow information: Piotroski, J. D., & Roulstone, D. T. (2004) found as well that insider purchases correlate with future earnings performance. Insiders buy their stock when they know it will outperform analyst expectations based on their superior insider information.
- Agency theory: I wrote an own paper at the university which found that insider outperformance correlates with agency problems. When insiders buy their own shares, they will increase their efforts to generate shareholder value, leading to outsized returns.
We are able to find many winning value stocks at Insider Opportunities by combining our own IO Value Algorithm with insider purchases. This algorithm is more complex than the above-mentioned new value strategy, but also uses the ROIC and FCF yield as main indicators.
Our back-test shows that since 2010 the 335 stocks picked by our strategy on average more than doubled the performance of the S&P 500.
That's astonishing if you take into account that this was a very weak period for value stocks, as discussed before.
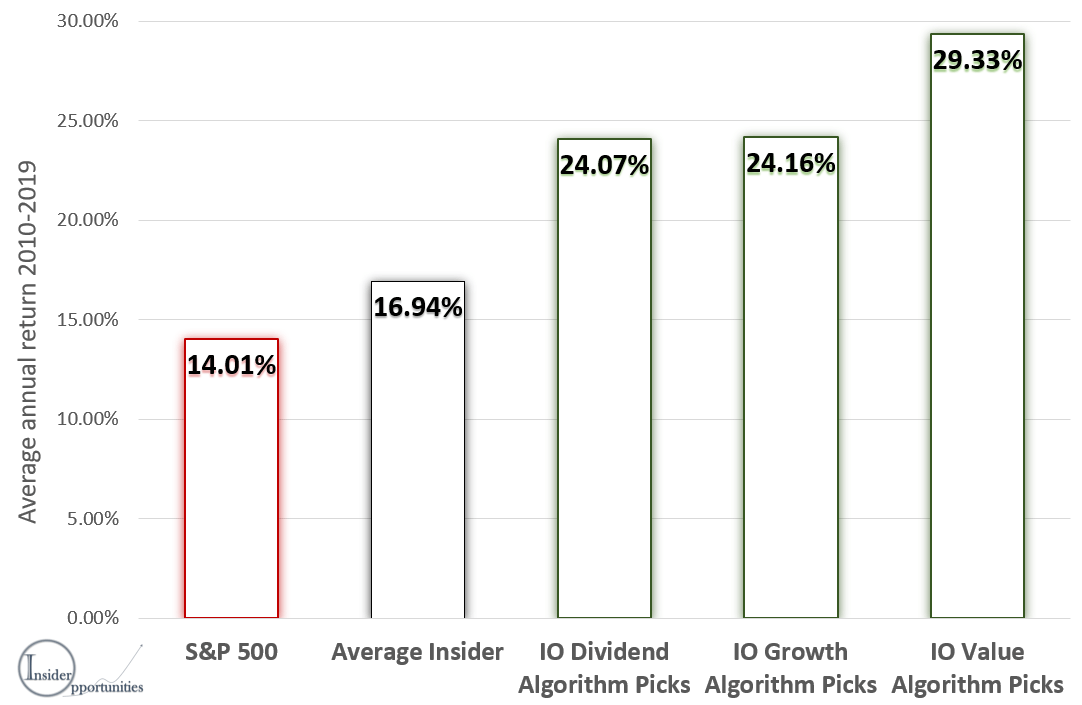
(Source: Insider Opportunities research)
The relevance of this strategy has never been so high as in the current stock market environment. There is a lot of uncertainty about the impact of the post-Covid economy on businesses. Insiders understand this impact better than anyone else and purchase shares when they believe the market is being too bearish.
It is not coincidence that since the inception of Insider Opportunities in May, our IO Value Portfolio (56 stocks exclusive for members) returned 48.12%, outperforming the S&P 500 by a staggering 28.8%.
Some of the best value stocks picked so far include:
- Medifast (MED): +113.65%
- Penn National Gaming (PENN): +271.27%
- Carrier Global Corp (CARR): +107.26%
- Arconic Corp (ARNC): +126.87%
- ...
And only one stock yields a negative return so far: ConocoPhilips (COP) (-2.20%).
Our current favorite pick
I know from experience that you guys like me to end with a favorite pick. My current favorite high-quality value pick is BG Staffing (BGSF), which has been discussed in depth for Insider Opportunities members on November 11. As a full analysis is beyond the scope of this article, I will just sum up its main points.
- Market cap: $131 mln
- Year-to-date return: -41.3%
- Insider purchases: three insiders purchased a total of $142,900 of shares in 2020, with the last one on November 11
- TTM free cash flow yield of 17.01% and forward P/E of 10.9x
- 5-year revenue CAGR and operating income CAGR of respectively 11.24% and 31.17%
- Price target: $22 or 72.5% upside from today. This might increase significantly if its pre-Covid growth rate comes back soon
Your timing couldn't be better to discover our investing service!
Generating wealth in the stock market will be challenging going forward, given the current record high valuations and business uncertainty. That's why dozens of investors like you decided to join Insider Opportunities recently. Via our proven strategy, even today we are able to provide members undervalued investing opportunities! Our portfolio returns since May 2020 (21.6%-50.1%) and customer satisfaction (4.8/5) speak for themselves.
With our current 20% sale and 14-day free trial, NOW is the time best time ever for you to try it out as well! CLICK HERE

Disclosure: I am/we are long BGSF, ULTA. I wrote this article myself, and it expresses my own opinions. I am not receiving compensation for it (other than from Seeking Alpha). I have no business relationship with any company whose stock is mentioned in this article.
