AAON Inc.: Time To Take Profits

With the AAON share price at $53.66, I published here on Seeking Alpha on June 24, 2020, "AAON Inc. - Like The Business, Not The Share Price."
With the share price currently around $66, I decided to take another look to see if anything new has happened that could change my mind.
It's time to take profits.
Investment Review: AAON Inc.
Returns from investment in AAON Inc. (AAON) shares over the last six years have been exceptionally good for investors buying and holding through to the present. This strong performance can be largely attributed to the increase in the share price from $49.41 at end of 2019 to $65.87 at close on November.nly further share price increases to provide acceptable returns over the next two to three years. Current P/E ratio of 45.15 does not provide much hope for multiple expansion to drive further share price increases. That leaves only EPS growth to fuel further share price increases. AAON certainly was able to boost production capacity and improve EPS in 2020 so far. But the Q3-2020 earnings call reveals the increased production capacity has all but eliminated backlog and future growth is likely to be constrained by lack of demand, particularly in the area of new construction related orders. Multiple contraction is a strong possibility for AAON, and now is possibly an optimal time to realize the very good profits from buying and holding over the last six years.
Please read on for my in-depth analysis of the past, present and potential future financial performance of AAON.
Looking for share market mispricing of stocks
What I'm primarily looking for here are instances of share market mispricing of stocks due to distortions to many of the usual statistics used for screening stocks for buy/hold/sell decisions. The usual metrics do not work when the "E" in P/E is distorted by the impact of COVID-19. And if the P/E ratio is suspect, so too, then, is the PEG ratio similarly affected. I believe the answer is to start with data at the end of 2019, early 2020, pre-COVID-19 and compare to projections out to the end of 2022, when hopefully the impacts of COVID-19 will have largely dissipated. Summarized in Tables 1, 2, and 3 below are the results of compiling and analyzing the data on this basis.
Table 1 - Detailed Financial History And Projections
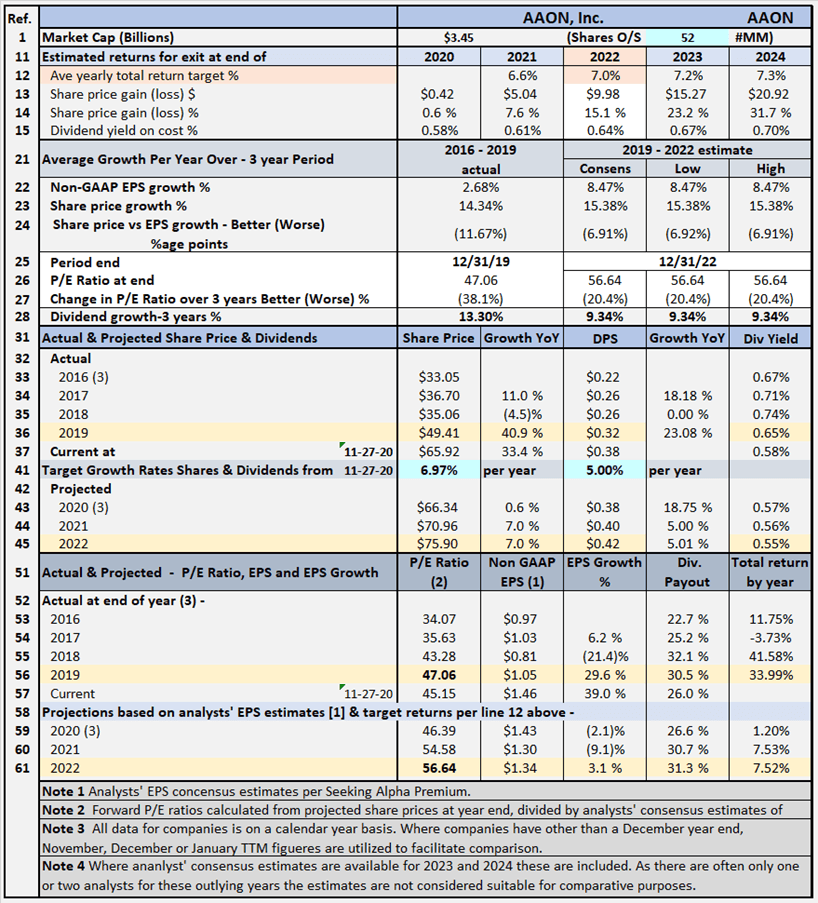
Table 1 documents historical data from 2016 to 2019, including share prices, P/E ratios, EPS and DPS, and EPS and DPS growth rates. The table also includes estimates out to 2022 for share prices, P/E ratios, EPS and DPS and EPS and DPS growth rates (note estimates are shown for analysts' EPS estimates out to 2024 where available, but these are considered not as reliable). Table 1 allows modeling for target total rates of return. In the case shown above, the target set for total rate of return is 7% per year through the end of 2022 (see line 12), based on buying at the Nov. 27 closing share price level. The table shows to achieve the 7% return, the required average yearly share price growth rate from Nov. 27, 2020, through Dec. 31, 2022, is 6.97% (line 41). This growth rate is lower than the target 7% return due to estimated dividends receivable. AAON has a current dividend yield of 0.58% (line 37). Table 2 below summarizes relevant data flowing from the assumption of a target 7% total return.
Targeting a 7% Return
Table 2 - Targeting a 7% return
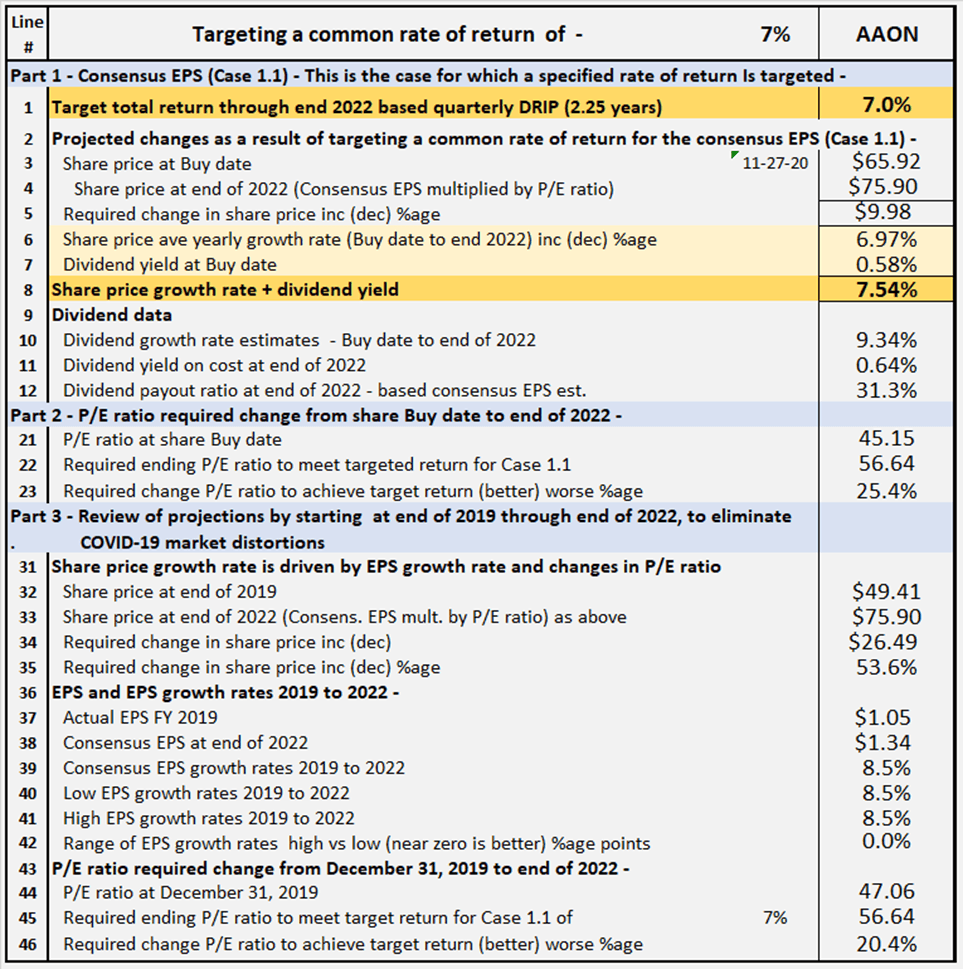
Table 2 provides comparative data for AAON, assuming share price grows at rates sufficient to provide total rate of return of 7%, from buying at closing share price on Nov. 27, 2020, and holding through end of 2022. All EPS estimates are based on analysts' consensus estimates per SA Premium.
Comments on Table 2 are as follows:
Part 1 - Consensus EPS (Case 1.1) (lines 1 to 12)
Part 1 shows the amounts the share price would need to increase to achieve a 7% rate of return through end of 2022. From Part 1, it can be seen that adding projected EPS growth rate to a dividend yield can give an approximation of potential total return, subject to changes in P/E ratio and growth in the dividend yield on cost.
Part 2 - Required change in P/E ratio to achieve Target 7% return (lines 21 to 23)
Part 2 shows the amount the P/E ratio would need to increase or decrease by, from buy date to end of 2022, to achieve the share price level at the end of 2022 necessary to achieve the targeted 7% return. For AAON, the P/E ratio at buy date needs to increase by 25.4% through end of 2022 for the 7% return to be achieved. Needing a 25.4% increase in P/E ratio to achieve a targeted return would normally be regarded as a negative. However, due to the distortions of earnings and sentiment owing to the COVID-19 pandemic, it's difficult to judge whether the change in P/E ratio is a negative or the result of a distorted starting point. To overcome this difficulty, in Part 3, I review the necessary change in P/E ratio from a different, pre-COVID-19 starting point.
Part 3 - Projected change in P/E ratios from 2019 to 2022 (lines 31 to 46)
In Part 3, I start with the share price at Dec. 31, 2019, before the impact of the COVID-19 pandemic on earnings and market sentiment. The end point is projected share price at end of 2022, when it's assumed the market and earnings are no longer materially impacted by the pandemic. For AAON, the share price would need to increase by $26.49 from $49.41 at Dec. 31, 2019, to $75.90 at end of 2022, and as detailed in Part 1, at $75.90, the targeted 7% rate of return would be achieved. For AAON, there are a number of givens in our assumptions. Using these givens, the change in the share price from Dec. 31, 2019, to end of 2022, can be expressed as mathematical formulae as follows:
(A) Change in share price, due effect of EPS growth rate, equals share price at beginning multiplied by (1 plus average yearly EPS growth rate) to the power of number of years invested
= $49.41*(1+8.5%)^3 = $63.06
(B) Change in share price due change in P/E ratio equals share price adjusted for EPS growth rate multiplied by (1 plus/minus percentage change in P/E ratio)
= $63.06*(1+20.4%) = $75.90
The increase of $13.65 ($63.06 minus $49.41) due to the average yearly EPS growth rate is cumulative, and share price will continue to increase, the longer the shares are held and the growth rate continues. The increase of $12.84 due to a change in the P/E ratio ($75.90 minus $63.06) has a one-off effect. A continuing high or low P/E ratio has no impact on future share price growth, only a change in P/E ratio affects share price, not the level of P/E ratio.
Next, rather than targeting a specific rate of return, I look at historical P/E ratios to see the potential impact on returns of a reversion to these levels of P/E ratio. First of all, I should explain a little about the Dividend Growth Income+ Club approach to financial analysis of stocks.
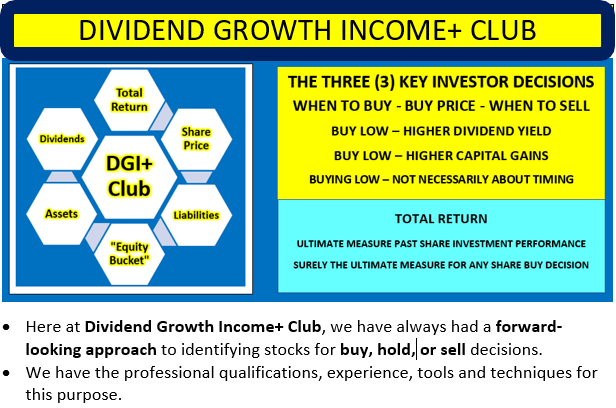
Understanding The Dividend Growth Income+ Club Approach
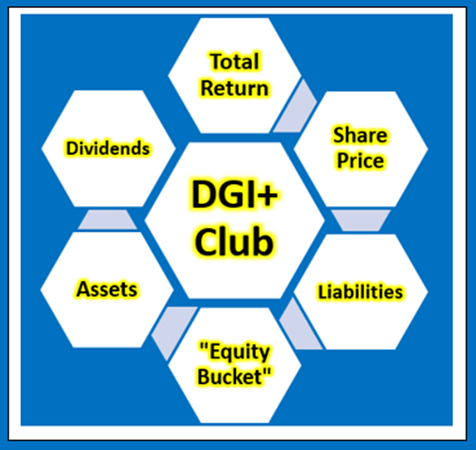
Total Return, Dividends, Share Price
The only way an investor can achieve a positive return on an investment in shares is through receipt of dividends and/or an increase in the share price above the buy price. It follows what really matters in share value assessment is the expected price at which a buyer will be able to exit shares, and expected cash flow from dividends.
Changes in Share Price
Changes in share price are driven by increases or decreases in EPS and changes in P/E ratio. Changes in P/E ratio are driven by investor sentiment toward the stock. Investor sentiment can be influenced by many factors, not necessarily stock-specific.
"Equity Bucket"
Earnings are tipped into the "Equity Bucket" for the benefit of shareholders. It's prudent to check whether distributions out of and other reductions in the "Equity Bucket" balance are benefiting shareholders.
AAON's Projected Returns Based On Select Historical P/E Ratios Through End Of 2022
Table 3 below provides additional scenarios projecting potential returns based on select historical P/E ratios and analysts' consensus, low and high EPS estimates per Seeking Alpha Premium through end of 2022.
Table 3 - Summary of relevant projections AAON
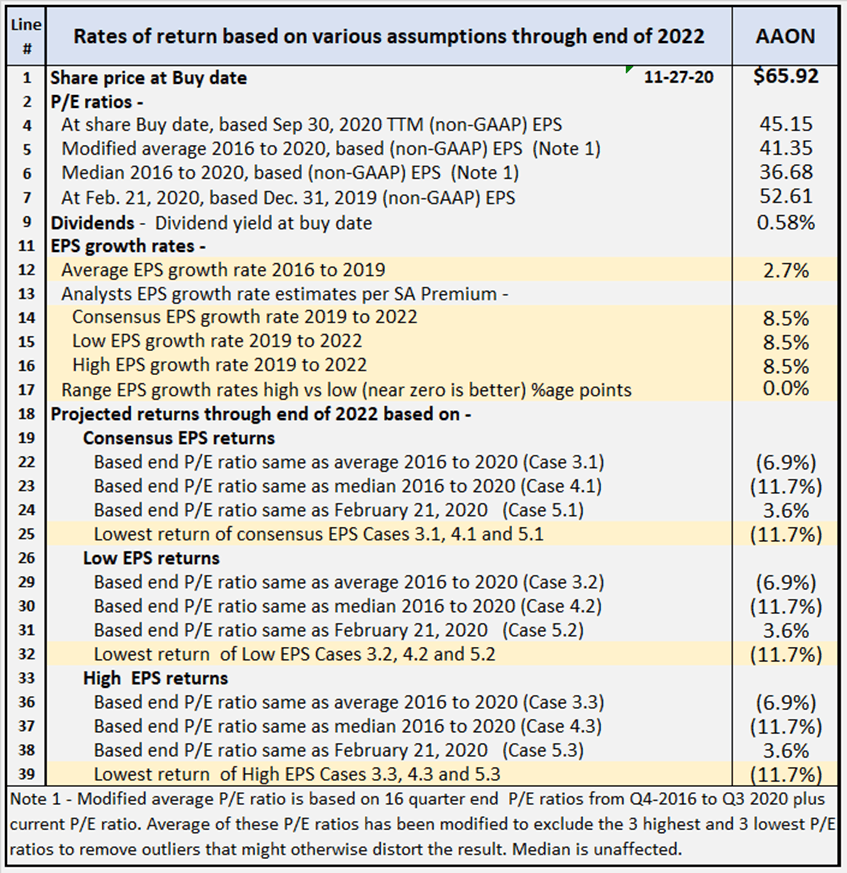
Table 3 provides comparative data for buying at closing share price on Nov. 27, 2020, and holding through the end of 2022. There's a total of nine valuation scenarios, comprised of three EPS estimates (consensus, low and high) across three different P/E ratio estimates. Comments on contents of Table 3 follow.
Consensus, low and high EPS estimates
All EPS estimates are based on analysts' consensus, low and high estimates per SA Premium. This is designed to provide a range of valuation estimates ranging from low to most likely, to high based on analysts' assessments. I could generate my own estimates, but these would likely fall within the same range and would not add to the value of the exercise. This is particularly so in respect of well-established businesses such as AAON. I believe the "low" estimates should be considered important. It's prudent to manage risk by knowing the potential worst-case scenarios from whatever cause.
Alternative P/E ratios utilized in scenarios
- The actual P/E ratios at share buy date based on actual non-GAAP EPS for September 30, 2020, TTM.
- A modified average P/E ratio based on 16 quarter-end P/E ratios from Q4-2016 to Q3 2020 plus current P/E ratio in Q4-2020. The average of these P/E ratios has been modified to exclude the three highest and three lowest P/E ratios to remove outliers that might otherwise distort the result.
- A median P/E ratio calculated using the same data set used for calculating the modified average P/E ratio. Of course, the median is the same whether or not the three highest and lowest P/E ratios are excluded.
- The actual P/E ratios at Feb. 21, 2020, share prices based on FY 2019 non-GAAP EPS. The logic here is the market peaked around Feb. 21, 2020, before any significant impact from COVID-19 became apparent, and after FY 2019 results had been released. This makes the P/E ratios at Feb. 21, 2020, reflective of most recent data before distortion of P/E ratios by the impact of the coronavirus pandemic.
Reliability of EPS estimates (line 17)
Line 17 shows the range between high and low EPS estimates. The wider the range, the greater disagreement there is between the most optimistic and the most pessimistic analysts, which tends to suggest greater uncertainty in the estimates. There's only one analyst covering AAON through end of 2022, hence the high, low and consensus estimates being the same. The estimated EPS at end of 2022 reflects an assumed average 8.5% per year growth rate for EPS from end of 2019 to end of 2022.
Projected Returns (lines 18 to 39)
Lines 25, 32 and 39 show, at a range of historical P/E ratio levels, AAON is indicated, in the worst case scenario, to show negative return of 11.7% average per year through the end of 2022. The 11.7% return is based on analysts' EPS estimate for 2022, and a P/E ratio of 36.68, being the median P/E ratio for 2016 to present. That's the lowest of the indicative returns under the various scenarios. At the high end of the projected returns for AAON, the indicative returns range from positive 3.6% to negative (6.9)%. The negative (6.9)% result would require a P/E ratio at end of 2022 of 41.35, similar to the modified average P/E ratio for 2016 to 2020. The positive 3.6% result would require a P/E ratio at end of 2022 of 52.61, similar to the P/E ratio at Feb. 21, 2020. AAON needing a P/E ratio in excess of 50 to achieve a positive rate of return through end of 2022 suggests to me the shares are very much overpriced at present. The only way the required P/E ratio can come down, and the 3.6% per year return still be achieved, is for EPS to grow at a higher rate than the estimated 8.5% per year allowed.
Review Of Historical Performance For AAON
AAON: Historical Shareholder Returns
In Table 4 below, I provide details of actual rates of return for AAON shareholders investing in the company over the last six years.
Table 4
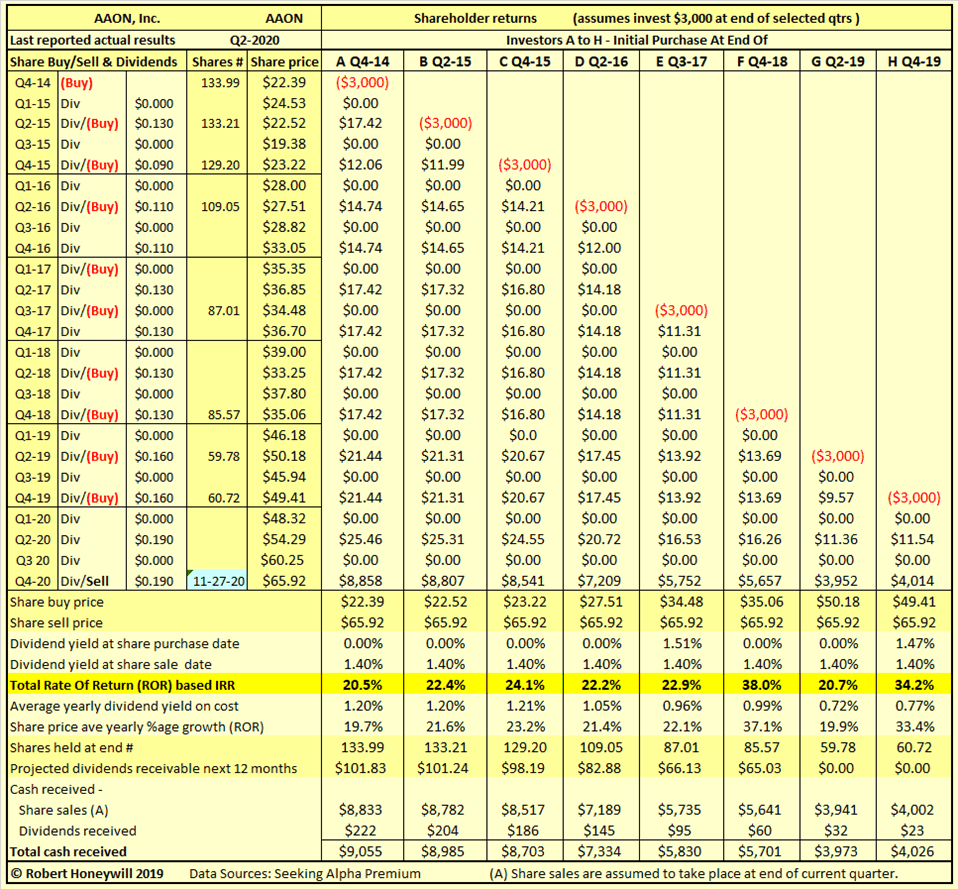
Table 4 shows returns have been excellent for investors buying shares in AAON over the last six years. For all eight of the cases above, returns have been in the double digits, ranging from 20.5% to 38.0%. Based on those results, investors might well ask, what is there not to like about AAON. I believe this is a case where investors should heed that warning, “past performance is not a reliable indicator of future performance.” The truth is, excessive share price growth has been driving these outsize returns. Table 1 (lines 22 and 23) shows EPS growth for 2016 to 2019 was just 2.68% average per year, but share price growth over the same period averaged 14.34% per year. To earn even a meager return of 3.6% from now through end of 2022, share price growth must continue to exceed EPS growth by a wide margin, as discussed under Table 3. Mispricing of stocks can continue for lengthy periods, just do not be left holding the shares when reality dawns. The rates of return in Table 4 are not just hypothetical results. They are very real results for anyone who purchased shares on the various dates and held through to fourth quarter 2020. In the above examples, the assumed share sale price is the same for all investors, illustrating the impact on returns of the price at which an investor buys shares.
Checking AAON's "Equity Bucket"
Table 5.1 AAON Balance Sheet - Summary Format
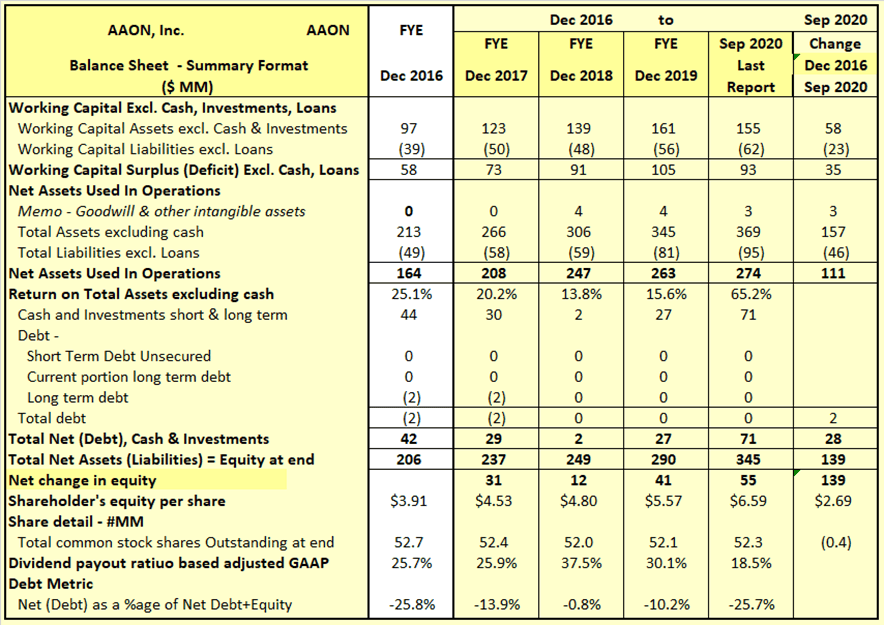
Table 5.1 shows an increase in Shareholders' Equity of $139 million over the 3.75 years, Jan. 1, 2017 through end of Sept. 30, 2020. This $139 million was applied to increasing operating assets by $111 million and cash by $28 million.
Table 5.2 AAON Balance Sheet - Equity Section

I often find with companies, while they produce earnings that increase shareholders' equity, significant amounts of distributions out of equity do not benefit shareholders. Hence the term "leaky equity bucket." This is not happening with AAON.
Explanatory comments on Table 5.2 for the period Jan. 1, 2017 to Sept. 30, 2020 -
- Reported net income (non-GAAP) over the 3.75 year period totals to $212 million, equivalent to diluted net income per share of $4.02.
- There are only very minor differences between non-GAAP and GAAP earnings - no concerns in that respect.
- The net income figure is arrived at after a charge of $73 million for 1.8 million shares issued to employees. The issue of these shares was more than offset by roughly 2.2 million shares repurchased for $89 million. There was little difference between the amount of $73 million charged against net income, and the estimated $79 million cost of shares repurchased to offset the shares issued to staff. The difference of $6 million has come out of shareholders' equity without being recognized as a charge against net income - not material.
- By the time these various items are taken into account, we find the reported EPS of $4.02 has reduced to a $3.90 per share addition to equity for the 3.75-year period.
- Out of this $3.90 per share addition to equity, $1.08 (28%) was distributed to shareholders by way of dividend.
- Due to numbers of shares repurchased being more than shares issued to employees, share count reduced from 52.65 to 52.27 million over the 3.75-year period.
AAON: Summary and Conclusions
The AAON business -
I really cannot fault the AAON business. It appears superbly managed. It has a strong balance sheet with surplus cash and no debt. Net income has been relatively flat over the period under review. On a non-GAAP basis, net income was around $55 million for 2017 and $55 million for 2019. The apparent strong growth in earnings for 2019 over 2018 is a result of depressed earnings in 2018 during a period of restructuring. 2020 earnings are well up on 2019, and I do believe, following the restructuring, AAON has the capability of increasing earnings in the years ahead. Results for the nine months ended Q3-2020 reflect considerable increased efficiency in operations. With high throughput AAON could likely exceed the 8.5% average yearly EPS growth through 2022, per analysts estimates. But increasingly high throughput is not guaranteed, as reflected in the CEO's comments on the Q3-2020 earnings call,
So that's what we're looking at right now. The next thing is we have not been able to give our people a holiday break shutdown for the four years that I've been here. This is the first time that we've had production has caught up and gotten ahead far enough to where we can give these people some rest and let them have a holiday shutdown. So we're going to shut down for the Christmas to New Year's holiday this year, because we are very well ahead of our commitments. So that's kind of what we're looking at. Q4, like I said, we came into it with a lower backlog than we did in Q4 of '19. So we're going to be slowing production down just a little bit here to make sure we maintain this efficiency.
The AAON share price -
It is a truism, no matter how good a business, it's possible to pay too much for the shares of that business. This is what I see with AAON. In Tables 1 to 3, I have modeled rate of return projections under various scenarios. My conclusion is, unless present high P/E multiple of greater than 45 undergoes further expansion, returns will be inadequate. It may well be that this popular stock will attract high multiples far into the future. But the exposure to risk of multiple contraction, I first warned of back in July, has now become so glaringly obvious, it may be a case of only those first out the gate will realize the profits accumulated over many years.
Your Feedback Is Always Welcome
If you found this article interesting or helpful, please consider "following" me by clicking the button at the top, or "Like this article" below, as this will help me in building an audience and gaining greater fulfillment from sharing my investment ideas with you on Seeking Alpha. And, of course, I welcome you sharing your opinion or perspective by commenting below.
Dividend Growth Income+ Club - Register today for your Free Trial.

Click Triple Treat Offer (1) Your Free 2 Week Trial; (2) 20% Discount New Members; (3) Bespoke reviews for tickers of interest to subscribers.
Disclosure: I/we have no positions in any stocks mentioned, and no plans to initiate any positions within the next 72 hours. I wrote this article myself, and it expresses my own opinions. I am not receiving compensation for it (other than from Seeking Alpha). I have no business relationship with any company whose stock is mentioned in this article.
Additional disclosure: Disclaimer: The opinions in this document are for informational and educational purposes only and should not be construed as a recommendation to buy or sell the stocks mentioned or to solicit transactions or clients. Past performance of the companies discussed may not continue and the companies may not achieve the earnings growth as predicted. The information in this document is believed to be accurate, but under no circumstances should a person act upon the information contained within. I do not recommend that anyone act upon any investment information without first consulting an investment advisor and/or a tax advisor as to the suitability of such investments for their specific situation. Neither information nor any opinion expressed in this article constitutes a solicitation, an offer, or a recommendation to buy, sell, or dispose of any investment, or to provide any investment advice or service. An opinion in this article can change at any time without notice.
