
191/3
(20.0) RR 9.55


England beat South Africa by 9 wickets


Australia beat India by 51 runs


03:30 IST - Hamilton
16:30 IST - Cape Town
13:40 IST - Canberra
13:30 IST - Paarl
13:40 IST - Sydney
13:40 IST - Sydney
16:30 IST - Cape Town
03:30 IST - Wellington
09:30 IST - Adelaide

11:30 IST - Auckland
11:30 IST - Hamilton
11:30 IST - Napier

13:30 IST - Centurion
05:00 IST - Melbourne
03:30 IST - Mount Maunganui
13:30 IST - Johannesburg
03:30 IST - Christchurch
05:00 IST - Sydney
05:30 IST - Brisbane
11:30 IST - Christchurch
06:30 IST - Dunedin
11:30 IST - Wellington
11:30 IST - Auckland
06:30 IST - Mount Maunganui

03:30 IST - Dunedin
06:30 IST - Christchurch
03:30 IST - Wellington
11:30 IST - Napier
11:30 IST - Auckland
06:30 IST - Hamilton
18:30 IST - Chester-le-Street
18:30 IST - London
18:30 IST - Bristol
18:30 IST - Cardiff
18:30 IST - London
18:30 IST - Birmingham
22:30 IST - Nottingham
22:30 IST - Leeds
22:30 IST - Manchester
14:30 IST - Nottingham
14:30 IST - London
14:30 IST - Leeds
14:30 IST - London
14:30 IST - Manchester
We look at 10 Interesting Numbers About the Manuka Oval in Canberra where Australia is going to host India for the third and final ODI.
Australia has already clinched the three-match series against India with wins in the first two matches in Sydney. The two teams will now clash in the third and final ODI at the Manuka Oval in Australia's capital city, Canberra. Not much is known about the picturesque venue which has played host to 11 international matches including 9 ODIs. It has one of the largest playing areas amongst all stadiums in the world.
Also read: T Natarajan Could Get a Chance As India Look to Avoid Whitewash
We look at 10 Interesting Numbers About the Manuka Oval in Canberra:
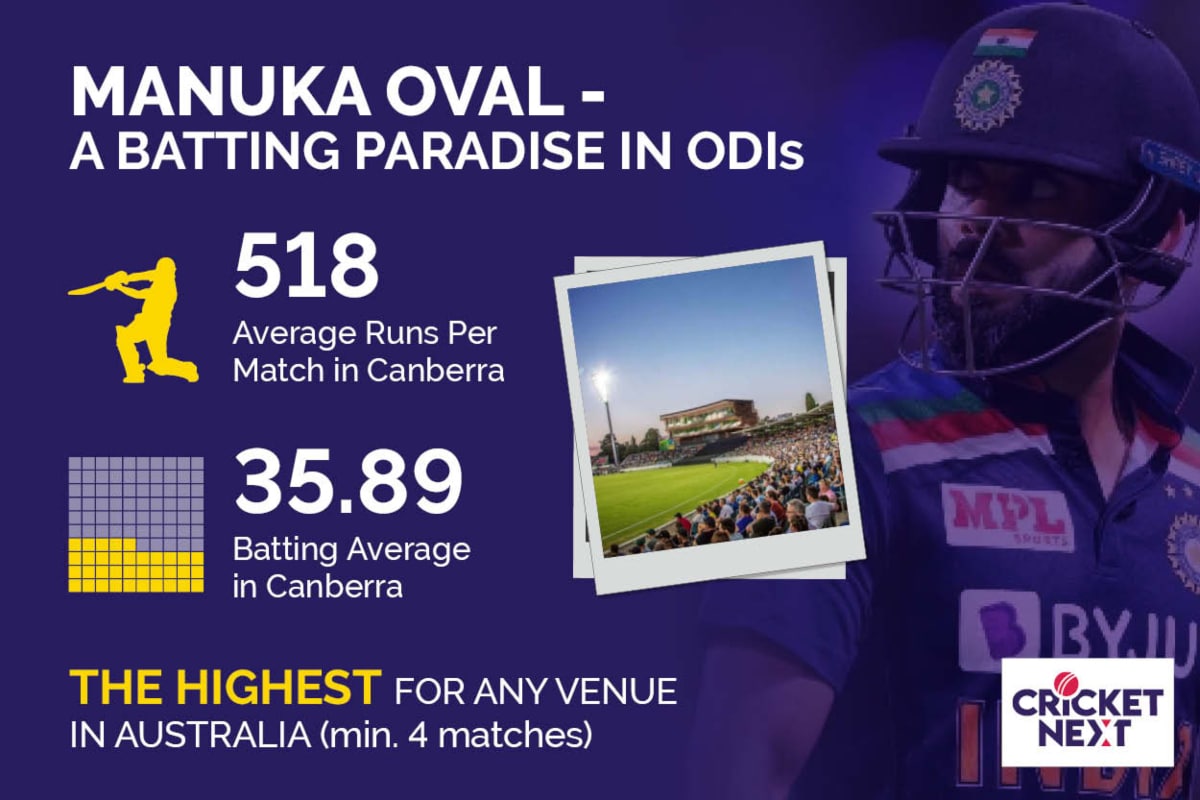
518 & 35.89: Average Runs Per ODI Match and Batting Average in Canberra
Both are the highest amongst all the venues in Australia (min. 4 matches hosted).
1.22: Ratio of Hundreds Per Match in Canberra
It is the best amongst all the venues in Australia (min. 4 matches). A total of 11 hundreds have been recorded in just 9 matches at the Manuka Oval.
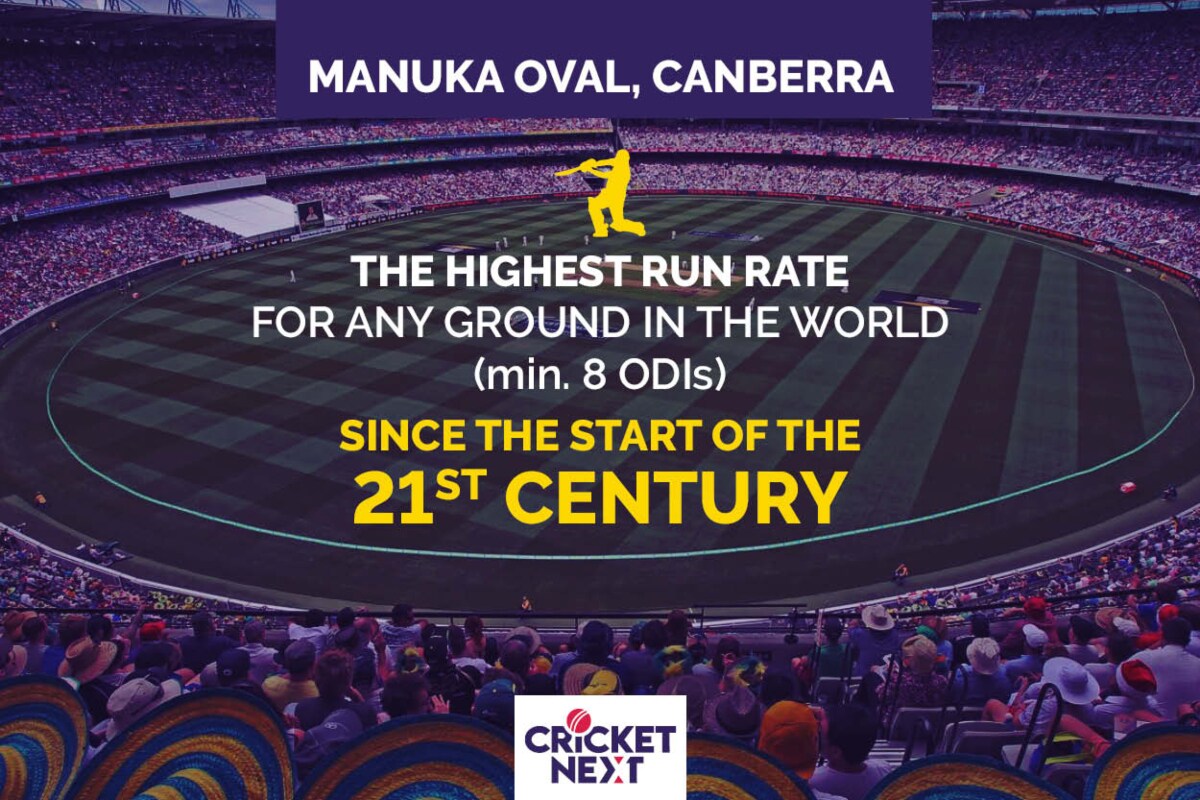
6.051: The Average Run Rate in Canberra since 1st January, 2001
It is the highest for any ground in the world (min. 8 matches) since the start of the 21st Century (1st January, 2001).
3-31 & 62: Peter Kirsten's Man of the Match Effort in the First Ever ODI in Canberra
South Africa clashed with Zimbabwe in the 1992 World Cup in what was the first ODI in Canberra. Peter Kirsten, bowling some right-arm off-break, broke the backbone of the Zimbabwe middle order dismissing Andy Waller, Dave Houghton and Ali Shah. He returned with 3-31 in 5 overs before anchoring the chase with an unbeaten 62.
0-2: India's Record at Canberra
India has lost both its matches at the Manuka Oval. Sri Lanka beat India by 8 wickets in a rain curtailed encounter in the Commonwealth Bank Series in 2008.
Australia beat India in a high-scoring match at the venue in 2016. The home team, propelled by a hundred from Finch and 93 by Warner and cameos from Steven Smith (51 off 29 balls) and Glenn Maxwell (41 off 20 balls), hammered 348 for 8. Centuries from Dhawan and Kohli led the chase but with almost no support from the middle and lower order, India collapsed after a scintillating double hundred partnership between the pair and ultimately were bowled out for 323.
4-0: Australia's Record at Canberra
Australia has won all its 4 matches at the venue.
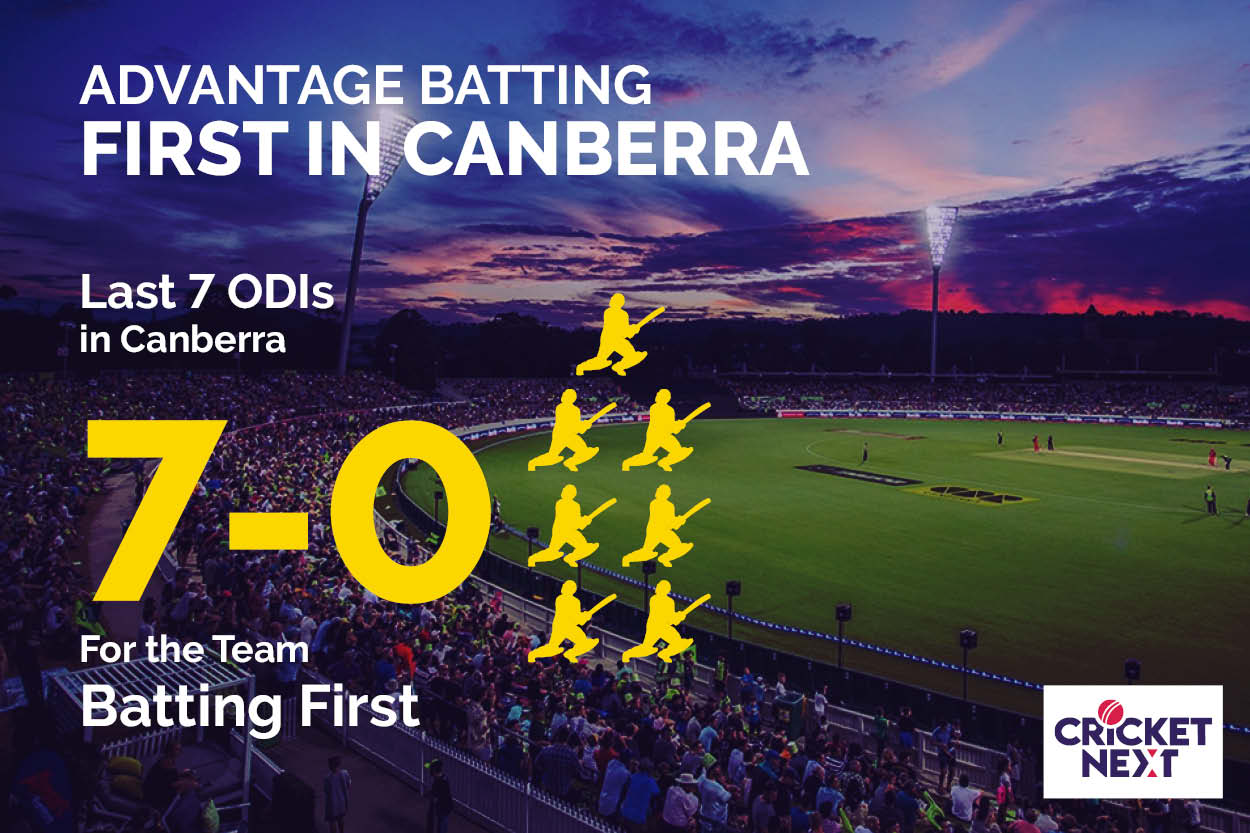
7-0: The Scoreline of the Last 7 matches For the Side Batting First
The side setting the target has won the last 7 matches at the Manuka Oval (starting from Australia vs West Indies in 2013). Three of these have been by massive above 100 margins!
7: Number of 300-Plus Totals in Canberra
There have been as many as 7 300-plus totals in 9 matches at the venue. South Africa's 411 for 4 against Ireland in the 2015 World Cup is the highest score in Canberra. Australia has scored in excess of 325 in all the 4 matches it has played at the Manuka Oval.
215 & 372: The Highest Individual Score in Canberra and The Highest Partnership in ODI History
Chris Gayle smashed 215 off just 147 deliveries (including 16 sixes) at the Manuka Oval against Zimbabwe in their 2015 World Cup encounter. It is one of the 8 double hundreds in ODI cricket history!
The match also witnessed the highest partnership in the history of ODI cricket as Gayle and Samuels put together 372 for the second-wicket.
347.71: Average First Innings' Total in Canberra in Last 7 Matches
Six of the these 7 first innings' totals have been in excess of 325. Bangladesh's 267 against Afghanistan in the 2015 World Cup is the only below-300 first innings' total at the venue since 2013.
| Rank | Team | Points | Rating |
|---|---|---|---|
| 1 | Australia | 6047 | 275 |
| 2 | England | 5959 | 271 |
| 3 | India | 9319 | 266 |
| 4 | Pakistan | 6824 | 262 |
| 5 | South Africa | 4380 | 258 |
| FULL Ranking | |||


