STK: This Solid Technology Fund Is Now Available At A Discount

Columbia Seligman Premium Technology Growth Fund targets capital appreciation and current income with a portfolio of technology stocks along with a flexible option overlay strategy to mitigate downside volatility.
The management team is led by Paul Wick, a highly regarded technology veteran with 33 years of industry experience.
The fund usually trades at a premium over NAV but is currently available at a small discount.
The portfolio tends to hold more mature technology companies with real earnings and tends to avoid "hyper-growth" companies with extremely high valuations and no earnings.
STK has the excellent long-term performance. But it has lagged some of its technology peers recently. This is largely due to the option overlay strategy and avoiding "hyper-growth" stocks with little or no earnings.

![]()
(Data below is sourced from the ColumbiaThreadNeedle website unless otherwise stated.)
Written by George Spritzer, co-produced by Alpha Gen Capital
Investment Objectives
The Fund seeks long-term capital appreciation by building a concentrated portfolio of technology stocks. The Fund also uses a rule-based option call writing strategy designed to provide current income and reduce downside volatility.
The Fund's Option Call Writing Strategy
Under normal market conditions, the fund invests in a technology-related stock portfolio and writes call options on the Nasdaq 100 index (or equivalent ETF) using a rules-based strategy. The aggregate amount of call options will typically range from 25% to 90% of the fund's holdings. The fund can also sell additional options on individual stocks on a discretionary basis (up to 25%).
Some other covered call funds mainly sell options on individual stocks. But I think STK's core strategy of writing options on the Nasdaq 100 index has some advantages since the index option contracts are more liquid. This means less negative slippage from the bid-asked spread and a reduction in adverse market impact when executing trades.
STK uses an opportunistic covered call option strategy. This is in contrast to many other covered call CEFs that use a constant option writing percentage with little variation. STK uses the VXN index as an indicator. The VXN is a leading barometer of investor sentiment and market volatility. It is similar to the VIX, but the VXN is based on the Nasdaq 100, while the VIX is based on the S&P 500.
The table below describes the rules-based strategy:
When The VXN Index is: | Aggregate Written Call Options as Percentage of Fund's Stock Holdings |
17 or less | 25% |
17 - 18 | Increase up to 50% |
18 - 33 | 50% |
33 - 34 | Increase up to 90% |
34 - 55 | 90% |
> 55 | 0 to 90% |
In addition to the rules-based strategy above, the Fund may write additional calls of up to 25% of the value of the Fund's holdings (to a maximum of 90%) when the portfolio managers believe call premiums are attractive relative to the risk of the price of the NASDAQ 100.
The Fund may also buy back a written call option if the managers believe that most of the premium (typically, 70% or more) to be received by the Fund has been captured before exercise.
In the last semi-annual report from June 30, the fund was not short any Nasdaq 100 options even though the VXN was around 30. This was probably caused by profit taking on calls before the expiration date.
They were short some call options calls and even two puts options on individual stocks based on discretion of the portfolio managers.
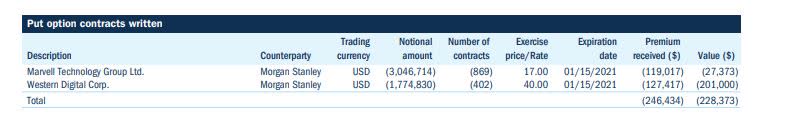
Note: From a risk perspective, selling a naked put is the same as writing a covered call. They have identical profit and loss graphs if you use the same strike prices and expiration dates. So selling naked puts on Marvell Technology (NASDAQ:MRVL) and Western Digital (NASDAQ:WDC) is equivalent to writing covered calls against the common.
As of today (November 29, 2020), the VXN index is around 26, which means about 50% of the portfolio has Nasdaq 100 calls written against it, based on the rules-based strategy.
STK Investment Process
The portfolio has a growth focus but the managers also look carefully at valuation. Investment selection is driven by rigorous bottom-up fundamental analysis and valuation analysis by an experienced team of technology professionals led by Paul Wick. The growth-at-a-reasonable-price (GARP) investment style generally results in more consistent performance and a lower standard deviation compared to their technology peers.
STK Distribution History - No Cuts in Ten Years
For retired investors who like steady consistent income, STK has been an excellent performer. It has a managed distribution policy and has paid a steady quarterly distribution of $0.4675 per share since inception in 2010. On top of that, it also paid out special year-end distributions of $0.7806 in 2017 and $0.6521 in 2018.
STK currently trades well above its inception share price of $20 in 2009. This is impressive given the steady flow of distributions it has paid out since then.
Top Sectors (as of Sept. 30, 2020)
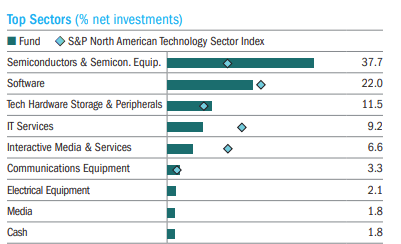
In the chart above, you can see that semiconductors have by far the largest sector weighting at 37.7% which is more than double the weighting in the benchmark - the S&P North American Technology Sector Index.
Performance
Below is the total return NAV and market price performance record for STK since 2010 compared to the MSCI ACWI global equity index. Note that the NAV of STK has outperformed the benchmark global equity index every year since 2014. It did underperform somewhat in the 2011-2013 time period. The outperformance since 2014 is largely because of the strong technology bull market.
But compared to some high-flying ETFs like ARKK and ARKW, STK has certainly underperformed recently because of its GARP investment style with an emphasis on more mature technology stocks with consistent earnings. But looking forward over the longer term, I believe that STK could outperform some of the high-flying "super growth" ETFs since these things tend to run in cycles.
STK NAV Performance | STK Price Performance | MSCI ACWI Index | |
2010 | +13.22% | +5.72% | +12.67% |
2011 | - 7.66% | - 9.67% | - 7.35% |
2012 | +0.03% | +3.71% | +16.13% |
2013 | +18.49% | +12.05% | +22.80% |
2014 | +22.14% | +47.17% | + 4.16% |
2015 | + 8.42% | + 5.05% | - 2.36% |
2016 | +15.25% | +17.07% | + 7.86% |
2017 | +32.90% | +34.51% | +23.97% |
2018 | - 7.76% | -14.42% | - 9.41% |
2019 | +51.06% | +53.18% | +26.60% |
YTD | +19.23% | +18.04% | +12.08% |
Source: Morningstar
STK Discount History - Last Five Years
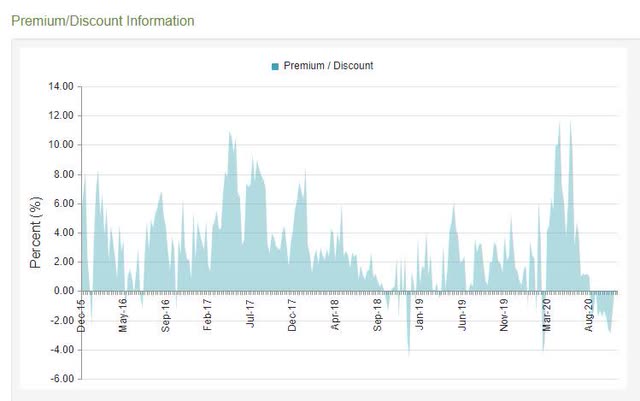
SKT is currently trading at a slight discount of -0.43%. Its 3-year average premium has been +2.19%, while its 5-year average premium is 3.02%. Looking at the 5-year discount chart above, you can see that STK normally only trades at a discount for brief periods.
NAV Correlations Compared to Other Funds
I looked at the NAV correlations of STK with some other CEFs and ETFs. I was surprised to find that STK correlates closer to global index ETFs than to some of its technology peers:
STK versus ACWI 96% iShares MSCI ACWI Index
STK versus SPY 94% S&P 500
STK versus BST 90% Blackrock Science & Technology CEF
STK versus IYW 90% iShares US Technology ETF
STK versus ARKK 85% ARK Innovation ETF
Source: cefanalyzer
Fund Management
Paul Wick: 33 years of industry experience; 11 years as a fund manager
Christopher Boova: 25 years of industry experience; 4 years as a fund manager
Braj Agrawal: 19 years of industry experience; 10 years as a fund manager
Vimal Patel: 24 years of industry experience; 2 years as a fund manager
Jeetil Patel: 22 years of industry experience; 5 years as a fund manager
Shekhar Pramanick: 27 years of industry experience; 2 years as a fund manager
Ticker: STK Columbia Seligman Premium Technology Growth Fund
- Pays Quarterly Distributions
- Total Assets = $408 Million
- Fund Inception Date: Nov. 25, 2009
- Last Quarterly Distribution = $0.4625
- Annual Distribution = $1.85
- Annual Distribution (Market) Rate = 7.23%
- Fund Expense ratio = 1.15%
- Discount to NAV = -0.43%
- Average Daily Volume = 63,150
- Average Dollar Volume = $1,600,000
- No leverage used
Summary
Some of my articles on Seeking Alpha highlight closed-end fund issues that are good for a "swing trade" because of mean reversion of the discount. But STK is also a good candidate for a longer term buy and hold investor who is looking for a steady income stream.
STK can also be used to complement some of the higher risk technology ETFs like ARKK or individual stock holdings like TSLA. It is fairly liquid and easy to purchase. The bid-asked spread is often only one or two cents but occasionally the spread widens out to five cents or more when limit orders should definitely be used.
Thanks for reading! If you liked this article, please scroll up and click "Follow" next to my name to receive future updates.
Marketplace Service For Those Hunting For Yield
George Spritzer's top investment ideas are being featured on Alpha Gen Capital's "Yield Hunting" marketplace service.
This service is dedicated to yield/income investors who wish to avoid market froth. We encourage investors to benefit from yield opportunities within closed-end funds, business development companies, and other niche areas. For safe and reliable income streams, check out Yield Hunting.
Disclosure: I am/we are long STK. I wrote this article myself, and it expresses my own opinions. I am not receiving compensation for it (other than from Seeking Alpha). I have no business relationship with any company whose stock is mentioned in this article.
