Vipshop Holdings: Undervalued Player In Chinese E-Commerce, But Unlikely To Outcompete Its Peers

An initial DCF valuation reveals that it is slightly undervalued.
Vipshop Holdings has a unique business model given its first mover advantage in the discount retailing industry, and is likely to benefit from the e-commerce boom in China.
However, its move into offline retailing may incur significant opportunity costs, which may result in less than desirable growth compared to its peers.
Therefore, more needs to be done to translate their unique business into market share and catalyze customer acquisition.
Editor's note: Seeking Alpha is proud to welcome BK Tan as a new contributor. It's easy to become a Seeking Alpha contributor and earn money for your best investment ideas. Active contributors also get free access to SA Premium. Click here to find out more »
Being one of the main competitors in the Chinese online retailing industry, Vipshop Holdings (VIPS) emerges as a value pick with a slight potential for upside. While Vipshop's unique position in a growing industry allows it to leverage on growth, its venture into physical retailing presents a competitive risk that diminishes its outlook. This can strategic move can incur significant opportunity costs especially when looking at the payoffs its competitors have reaped by expanding their presence online.
In the next section I will first outline the valuation model and the assumptions driving the model that led me to the target price of $27.19. I will then follow up with a discussion on the growth opportunities for Vipshop Holdings in the Chinese e-commerce landscape, contrasting with why they are unlikely to outcompete its peers in spite of them, and ending off with how they can catalyze its growth in the long run to make it a more attractive investment.
Discounted Cash Flow Valuation Model
As with most traditional valuations, I will make use of a traditional unlevered discounted cash flow model to arrive at the target price. For each part of the valuation model, I will walk through the choice of numbers that contribute to its implied growth rate, as well as discuss some of the assumptions I have made in the process. All figures and tables here are generated from their annual reports.
Projecting Total Revenue
For its total revenues, we can clearly see a decline in year-on-year growth rates from 40.76% in FY16 to 10.02% in FY19, which is approaching the expected annual growth rate of Chinese e-commerce according to Statistica at 8.6%. Hence, I will assume a very plausible scenario where Vipshop Holdings is able to sustain the average growth rate of 8.6% towards 2024. For the FY20 growth rate, I will use a growth rate of 16%, to reflect how pandemic stay-at-home conditions have resulted in a boom in e-commerce sales. Although the choice of 16% is rather arbitrary, doubling the average expected annualized growth rates serves as an estimate of a best-case scenario for Vipshop Holdings this year. As a result, we can expect approximately 107 Billion RMB in sales this year, growing to 150 Billion in RMB according to this projection.
![]()
Projecting Cost and Expenses
Cost and expenses will follow a standard formula of projecting expenses as an average percentage of revenues each year because most expense needs scale with how much the firm is able to sell. For cost of revenues, using this approach assumes that they are able to procure inventory from its suppliers at the average rate in the past, which is by no means a heroic feat. As for the internal other expenses such as fulfillment expense, marketing expense, technology and content expenses and general and administrative expenses, projecting based on the average expense as a percentage of revenue implies that they are on average as operationally efficient as the past.
To prepare the cost and expenses, we have to first subtract the share-based compensation expense from their respective cost components. These compensation expenses were sourced from the annual report. This is for the purpose of projecting the compensation expense as its own type of expense separate from the other components of operational expense. Once separated, the core expenses are projected as a percentage of revenues. Likewise, I will project share based compensation as an average percentage of revenue, assuming no changes in pay structure, and add them back to their respective components as shown below.
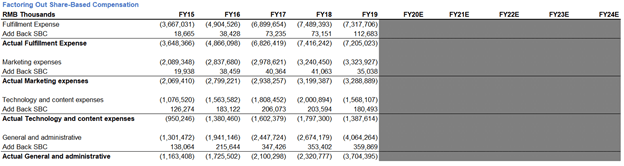
(Subtracting Share-based compensation expense from their respective expense categories)
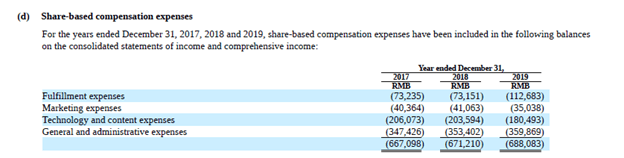
(Share Based compensation for 2017-2019 as an example)
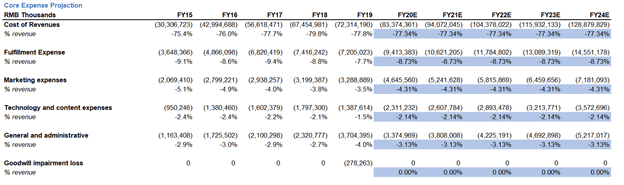
(Projecting core expenses)
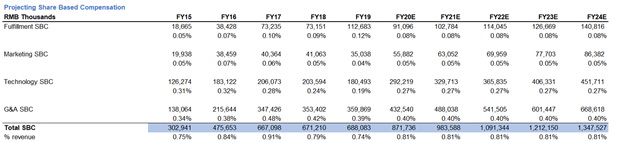
(Projecting Share Based Compensation Expense)
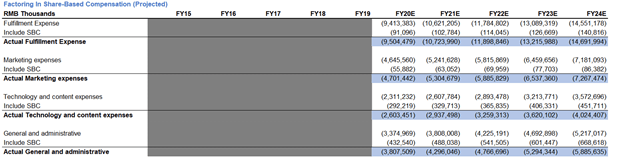
(Adding everything back together)
Since goodwill impairment loss is a non-recurring item, I will assume that there is no such expense in the future.
Depreciation and Amortization Schedule
Projecting Revenue and operational expense will allow us to compute EBIT in the income statement further below. However, in order to arrive at the unlevered free cash flow, we need to adjust EBIT by the depreciation and amortization expense each year, and by any changes in working capital. As a starting point, I will assume that the average useful life of new property, plant and equipment (PPE) is equal to the weighted average useful life of related assets in FY19, according to their proportion of total PPE in FY19. The average useful life for each item is simply the average of the range of useful life declared in the annual report. For leases, I will use the average remaining lease term of 4.71 years.
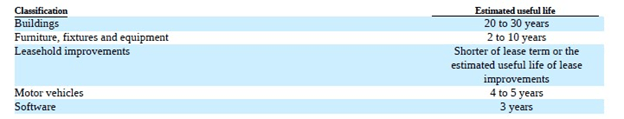
(Average Useful Life according to their 2019 annual report)
As an example, since buildings have a 2019 carrying value is 6,689,846,000 RMB out of the total PPE and deposits' carrying value of 14,934,045,000 RMB, it will carry a weight of 44.80%*25 years = 11.20 years. The same process is done for all PPE with definite useful lives, and summed up and divided by the percentage of PPE with useful lives to obtain a weighted average of 17.26 years.
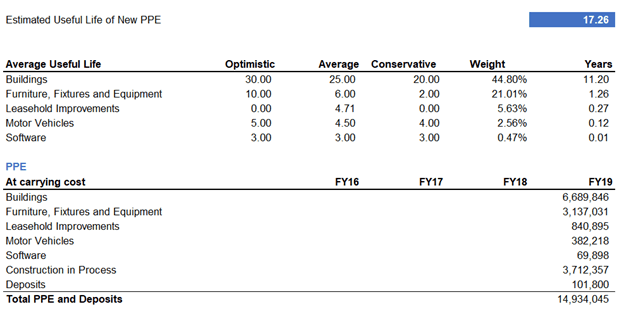
(Computation of Useful Life)
This means that any new PPE added through capital expenditures (CAPEX) will depreciate over 17.26 years with no salvage value. In the case of CAPEX, since how much the firm can spend on property and equipment is related to how much revenue it earns, I will simply assume it follows an average percentage of revenues. In this case, new capital expenditures are added at an average of 3.3% of revenue. Lastly, I assume that historical depreciation of existing assets occurs at an average percentage of revenue again, at 1% of revenue each year. This allows me to build the depreciation schedule for all PPE, by taking the previous year's ending PPE, adding new CAPEX and subtracting historical depreciation.
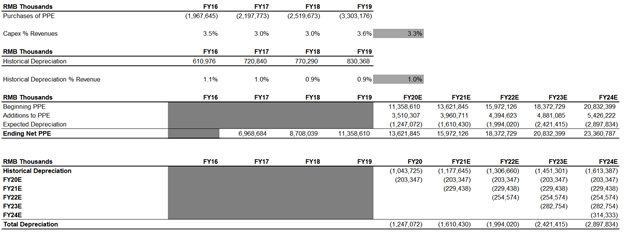
(Completed Depreciation Schedule)
As for intangible assets and land use rights, the firm has already disclosed their expected amortization expense. While I assume that additions to land use rights occur at approximately 1% of revenue every year, there will not be any additions to intangible objects.
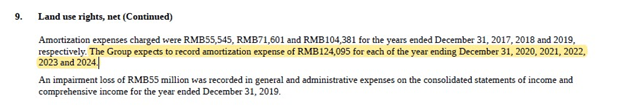
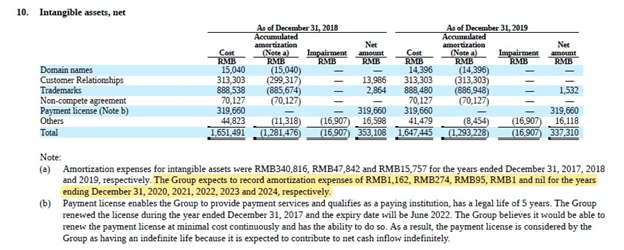
(Land Use Rights and Intangible Assets as disclosed in the notes to their financial statements)
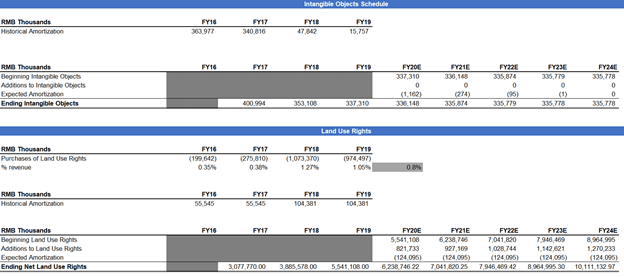
(Resulting Land use rights and Intangible Objects Schedule)
Lease Liabilities and ROU Assets
Lease liabilities represent the contractual payments that the firm is obliged to in exchange for being a lessee. However, by leasing these assets, they have the right to use them, which is recorded as a right of use (ROU) assets in the balance sheet. This asset is subsequently amortized overtime to reflect the maturity of operating leases. Since the firm has already declared their contractual lease payments and the discount rate, we can build a schedule for lease liabilities.
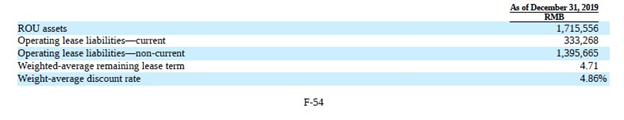
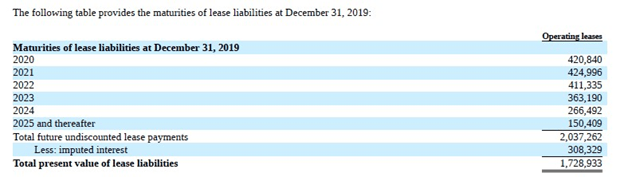
(Declaration of Lease Liabilities as disclosed in the notes to their financial statements)
The projected value of total lease liabilities every year is equal to the present value of all future operating lease liabilities, discounted by 4.86%. Since there are lease payments that occur after FY24 of value 150,409,000 RMB, representing 40% of the average lease payment of 377,371,000 each year, I will assume that the remaining lease payment is paid within 0.40 of a year, and is thus discounted by 5.40. As 5.40 is the implied years of lease remaining from its interest payments, I will amortize the remaining right of use assets over 5.40 years, incurring 317,780,000 RMB of amortization expense each year. While the annual report also shows the weighted average remaining lease term at 4.71 years, using the implied number of years will allow us to amortize ROU assets at almost the same rate that lease maturities are repaid, such that the total lease liabilities roughly matches the right to use these lease assets.
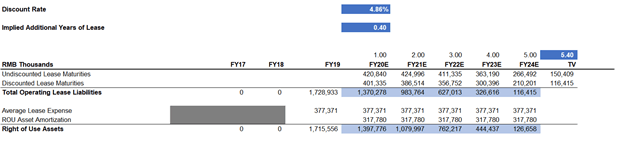
(Lease and ROU Asset schedule based on the contractual maturities of leases)
Finally, we can also assume that there will be no acquisitions in the future. This will allow us to hold goodwill constant.
Projecting Other Assets
To reach the unlevered free cash flow, we need to calculate the total cash flows from operations or provided to operations, which includes working capital and other non-financial assets. Working capital includes Accounts Receivable, Inventories and Accounts Payable, and they will be projected based on the basis that they remain as operationally efficient as the past. For instance, I assume that for inventories, the Days Inventory Outstanding (DIO) number for FY20-2024 is equal to the average DIO from FY17-19 at 37.61 days. This number is then multiplied by the average cost of revenues in a day to get the average inventory. Accounts Payable follows the same formula at a Days Payable Outstanding (DPO) average of 70.40 days. As an exception, since days receivable outstanding (DSO) drastically decreased from 24.58 to 5.67 in FY19, I will simply take the previous DSO number. Other assets and liabilities are simply projected similar to cost and expenses as an average percentage of revenue.
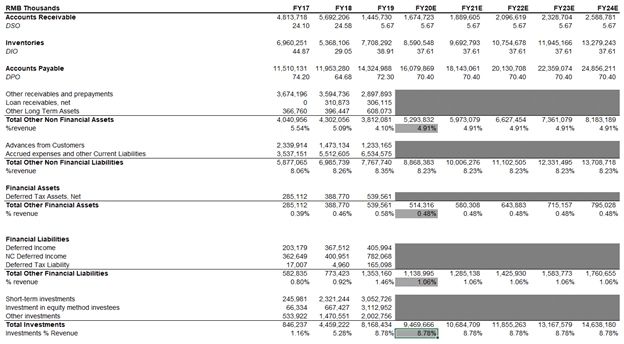
(Projection of working capital and other assets)
Debt and Equity Tabulation
As we round up our DCF calculations, this final part will deal with the computation of debt and equity.
Vipshop Holdings regularly makes use of a revolving credit facility in order to finance its operations, as opposed to issuing long term debt. As a benchmark, I will assume that they borrow the same sum of 1 Billion RMB each year to match previous years of borrowing. Since their current unrestricted cash of around 6B RMB is much more than their short term and long term borrowings, it is unlikely that they need to draw down their revolver to service more senior debt, other than simply financing their operations.
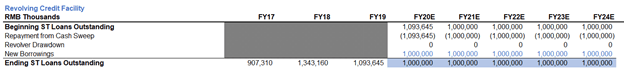
(Revolving Credit Facility)
As with all disclosed obligations, the schedule of long term debt payment can be built, assuming they do not issue new debt and finance primarily from short term debt. Since they did not explicitly declare their maturities but rather only their total payment obligations including interest, I will take the difference between the total amount paid at 77,117,000 and the current non-current financial debt of 64,515,000, and divide it by the implied number of years of debt to get average interest payments per year. Over here, since payments past 2024 is around 3 times the average interest payment per year from FY20-FY24, the implied number of years of debt is 5+3=8 years.
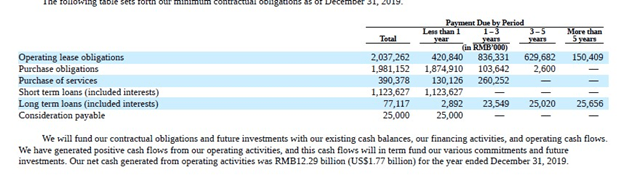
(Debt Obligations including interests from the 2019 Annual Report)
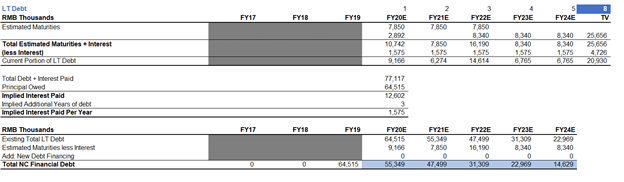
(Long Term Debt repayment schedule)
As of FY19, there were no other forms of debt besides revolver borrowings and long term debt.
For equity calculations, it is simply a matter of adding the previous year's equity amount to net income of the current year, subtracting dividends (which is assumed to be 0 since they have not declared any dividends as of date) and adding back share-based compensation expense for the year because more equity was added instead of compensating workers in cash.
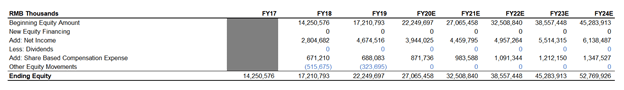
(Tabulation of Equity)
Balancing the Model
To balance the model, we have to complete the balance sheet, income statement, and finally the cash flow statement, which are shown below. Note that interest expense, interest income, and other operating income were all projected as a percentage of revenues. Other items such as impairment loss of investments, exchange loss, investment gain and share of gain in equity method investees were assumed to be 0 because these investments fluctuate significantly and it would be difficult to even predict if they will make a loss or gain in a given year, so it would be prudent to assume they break even. Income tax expense is simply the average effective income tax paid on the past few years, at 18%.
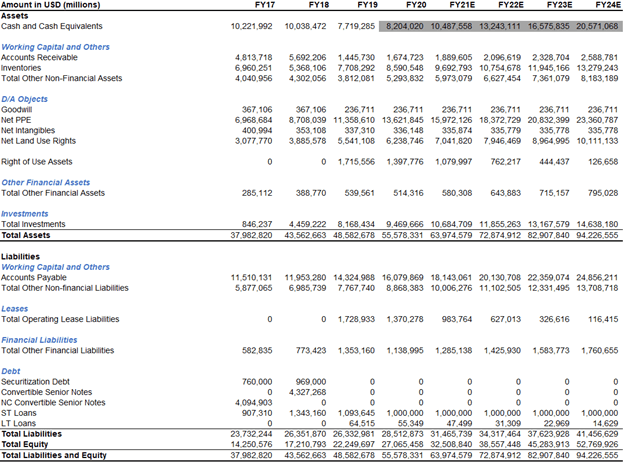
(Balance Sheet Output)
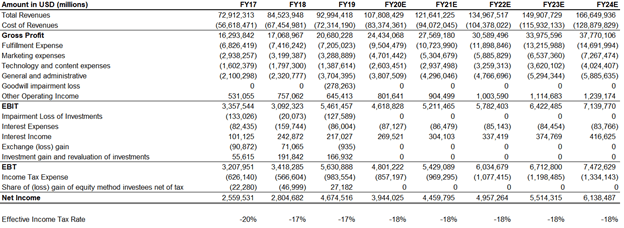
(Income Statement Output)
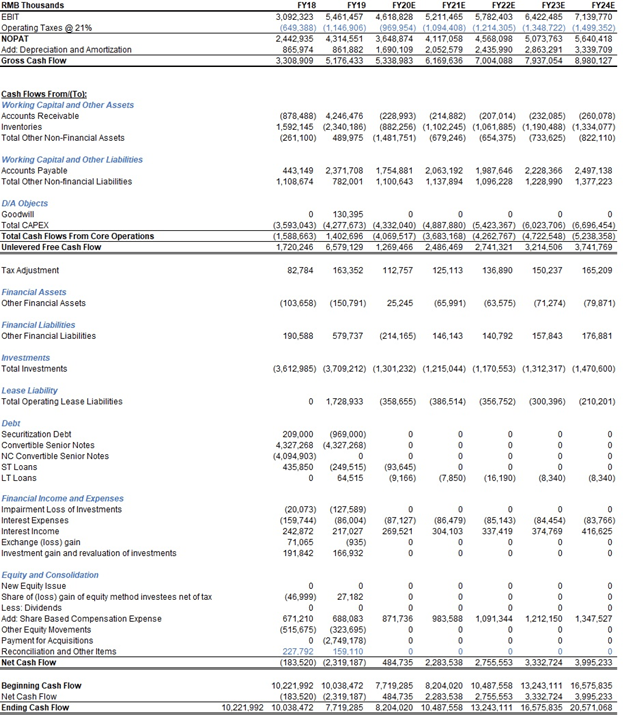
(Cash Flow Output)
Weighted Average Cost of Capital
For an unlevered discounted cash flow model, the relevant discount rate is the weighted average cost of capital, because the cash flows which are undiscounted are the cash flows before factoring in claims from debt and equity. This computation is shown in the table below.
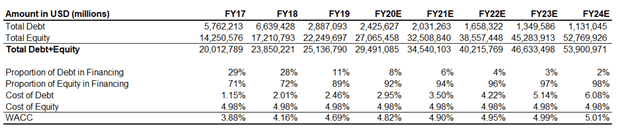 (WACC Tabulation)
Cost of equity is derived using the capital asset pricing model, which is equal to the risk free rate plus the firm beta multiplied by the market risk premium today. Assuming a 10-year treasury yield of 0.84%, and a market risk premium of 5.60% with a beta of 0.74, we get an implied cost of equity of 4.98%. The below shows the computation of cost of debt. While operating lease liabilities are not considered debt when accounting for it, I will treat it as such because it is a contractual obligation to fulfill in return for leasing the asset, similar to borrowing money. Note that the cost of debt is post-tax, factoring out the tax deductible effect of paying interest. Here, the corporate tax rate is simply the Chinese corporate tax rate of 25%.
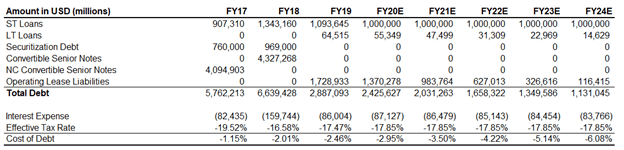
(Cost of Debt Calculation)
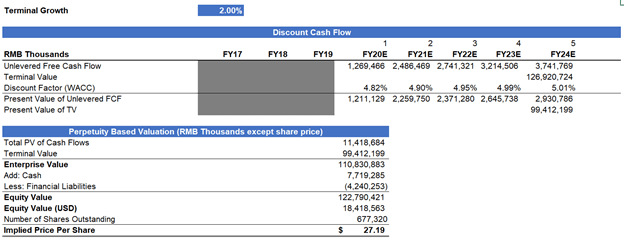
After the above, we can plug unlevered free cash flow and the WACC numbers, and arrive at an implied price per share of $27.19 taking an exchange rate of 1 RMB: 0.15 USD, higher than today's share price of $25.54. This DCF analysis assumes a terminal growth rate of 2%, which is a conservative number reflecting the average long term inflation rate of developed nations like the USA. At this target price, there remains a small potential for upside at approximately 6%, providing a marginal amount of investment value.
Growth opportunities in a booming online retailing landscape
Vipshop can be an attractive value pick with significant growth opportunities especially it resides within the booming e-commerce landscape in China. With the growth of the middle class in China, more individuals have greater purchasing power and thus the ability to afford internet based services such as e-commerce services. Furthermore, since e-commerce services are a close substitute to traditional brick and mortar retailing with the added convenience of home delivery, the development of this industry will give consumers additional reason to switch away from the old retail paradigm, causing a further increase in demand for e-commerce services. As a direct consequence, e-commerce firms are expecting greater demand for their goods and services in the future. This has led to an expected annual growth rate of 15% from 2017 to 2024, or 9% from 2020 to 2024.
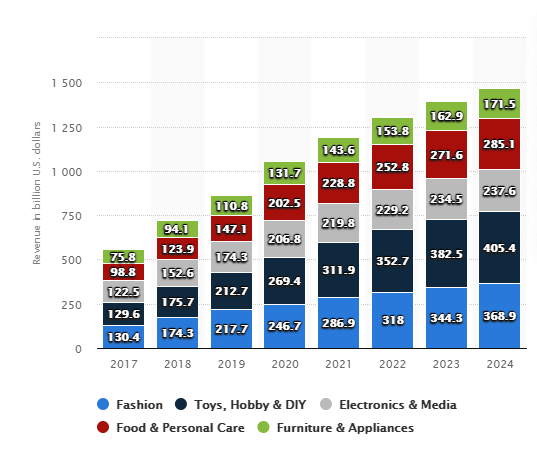
(Projected Revenue growth for Chinese e-commerce)
The solid fundamentals of the e-commerce industry are also reflected in the stock prices of the main e-commerce firms in China. Especially with this year's COVID-19 pandemic revealing an added plus of e-commerce being a pandemic-resistant business, it is no wonder that the main e-commerce firms have outperformed the S&P 500 by a large margin.
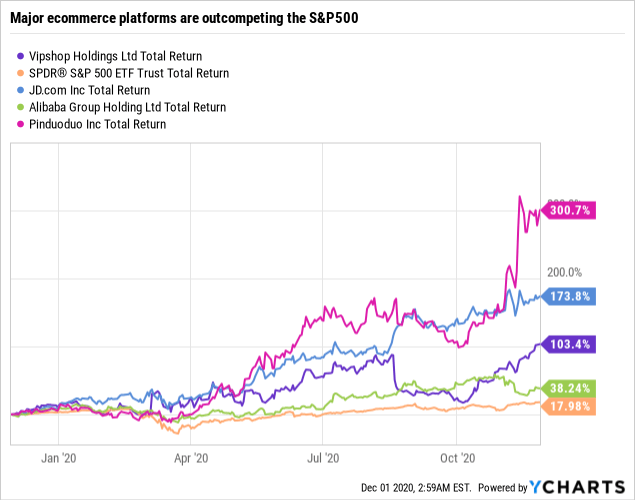 Data by YCharts
Vipshop Holdings and its unique strategic position
Aside from the growth potential attributed to the entire industry, Vipshop Holdings has a strong and unique position in the industry which makes it well poised to leverage gains. As a distributor for many domestic and international brand partners, Vipshop Holdings prides itself as preferred platform and partner for over 18,000 producers both domestically and internationally. With their flash sales model, they are able to monetize large volumes of inventory quickly, allowing suppliers to offload excess inventory rapidly, especially when producers are likely to produce more units than actually sold to cater for rapidly growing demand in the Chinese market. Furthermore, Vipshop Holdings is able to act as a platform for consumers to discover new brands, since they are more willing to try new items out if sold at a discount, improving the market awareness of their suppliers' product. Due to the added value they provide to suppliers in addition to their reputation as the foremost discount retailer in China, suppliers are less able to exercise their bargaining power against Vipshop Holdings , allowing the firm to procure inventory at preferential prices, and sell them at low prices to consumers
Because of their ability to procure large amounts of excess capacity from producers at deep discounts to retail price, Vipshop Holdings is able to enjoy significant economies of scale. This serves as a competitive moat against new entrants into the discount retailing segment of China's e-commerce landscape, as new entrants are unlikely to match the low prices of Vipshop Holdings without their preferential procurement deals with producers. Their strategic business has allowed them to occupy a niche area of discount retailing that competitors have not expanded into, and maintains its position as a unique player among Chinese e-commerce firms.
Furthermore, Vipshop Holdings' investment into offline retail outlets allows their brand to have added visibility, and complements their online channels for an omni-channel shopping experience. In addition, since low cost goods have traditionally been associated with inferior goods, consumers may demonstrate a natural aversion away from Vipshop Holdings if they are a first-time buyer online. This problem of inferior goods is exacerbated with third-party vendors in online retailing, where product quality is not easily observable. Thus, establishing an offline channel can be a way for customers to easily see the quality of the goods for themselves, and it is easy to see how their expansion into physical retailing can help to improve visibility among consumers.
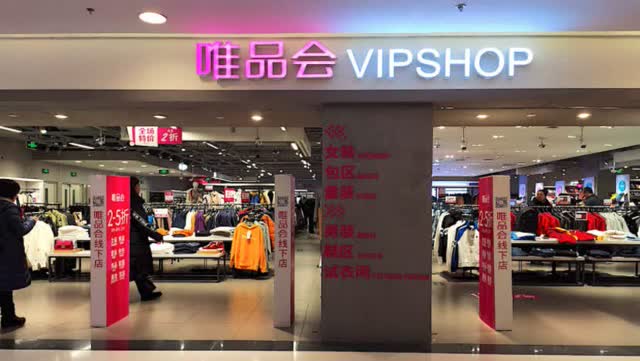
(Image of an offline Vipshop Outlet in Beijing)
Vipshop Holdings also touts this as an opportunity to develop their position in the offline discount retail market. Unlike in the United States where there are large discount retailers such as TJMax or Ross, the market for discount retailing is largely fragmented in China, with the top 100 retail chain operators only accounting for 6.3% of China's retail market. While prospects currently look bleak for offline retailers, industry consolidation is a real possibility, and can be fulfilled given the resources available to Vipshop Holdings as a large publicly-listed company that has a first-mover advantage into offline discount retailing. This presents significant profit potential in the long run.
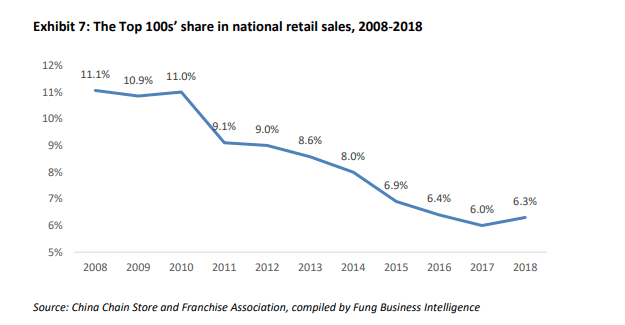
(Share of Top 100 retailers in national retail sales)
Brand Loyalty as a Competitive Advantage
Because consumers are able to obtain high quality brand name goods at a discounted rate, they are likely to continuously source their apparel purchases from Vipshop Holdings. This is why another key strength of Vipshop Holdings is its brand loyalty, and their ability to retain repeat customers over time. The statistics show this quite clearly. As the number of active users (defined as customers who have purchased at least once in the year) per registered member stabilizes from 28.7% in 2015 to around 18.3% from 2017-2019, the percentage of repeat customers (who have purchased more than once in the year) among active user has increased drastically from 66.6% to 79.7% in the same time period. This bodes well for the future revenue prospects of Vipshop Holdings, as a large percentage of total orders have historically originated from their repeat buyers as opposed to their one-time buyers.
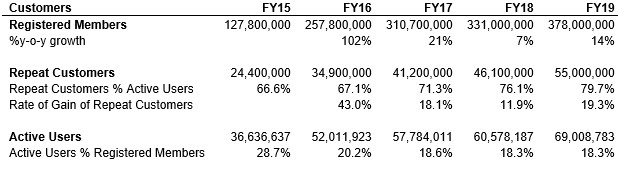
(Rate of gain of Active Users: Data sourced from 2015 to 2019 Annual Reports)
Promising business model, but there are competitive risks
In spite of its strengths, there are still some competitive risks that we have to acknowledge.
Vipshop Holdings' nature as a discount retailer makes it extremely difficult to command a price premium, as most of their consumers are mostly price sensitive. It then follows that there is likely to be a more than proportionate fall in revenue in the event of a price hike. This leads to additional pressures to keep prices low, meaning that they will have to work their way around managing relationships will with existing brand partners in order to continuously negotiate preferential deals. Even though the risk of them being unable to negotiate low-cost deals from producers is low, the fact that their whole business model hinges on procuring at low prices presents a real competitive risk.
While Vipshop Holdings' expansion into physical retailing can be seen as a move to complement their existing business, investors have been skeptical about this strategy. According to Caixin Global, when they announced their plan to acquire Shan Shan Outlets for RMB 2.9 Billion in 2019, their stock fell by 7.51%. There is good reason for their reaction to this news. Omnichannel shopping does not necessarily fit into the growth narrative of e-commerce. In fact, we see the opposite trend happening. More recently, shelter-at-home pandemic conditions have challenged the relevance of traditional sale and retailing paradigms, with more physical retailers opting to move online in a bid to capture more consumer traffic in the digital world. In the first half of February, 30,000 offline retailers have already moved daily to Taobao, China's largest customer-to-customer online marketplace. As consumers gradually move online in favor of online stores over offline ones, there may be serious implications for profitability in the long term.
Do not get me wrong here - their expansion into physical stores does allow for business synergies with their existing discount retailing, especially with a large potential for industry consolidation. But the diminishing returns on brick and mortar retailing has certainly increased the opportunity costs associated with venturing into physical retailing.
The opportunity costs of offline retailing
Offline retailing may prove to provide insufficient returns in the long run to outcompete its competitors. This problem is exacerbated with the small market share of Vipshop Holdings. Among the key e-commerce players in China, the active user growth rates of Vipshop for the past 5 years appear relatively lacklustre compared to its peers, demonstrating an annualized growth rate that is on par or lower than most of its competitors. This is in spite of the fact that most of its competitors have higher active user counts, which should imply greater difficulty growing because they already have such a large consumer base.

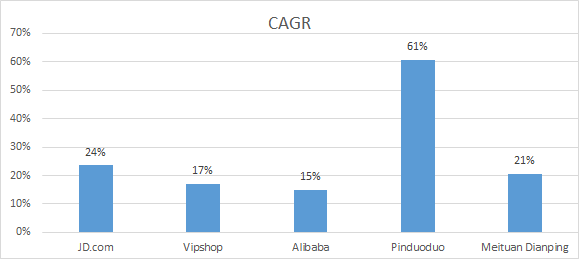
(Trend of annual active users and implied CAGR, sourced from relevant annual reports)
Part of the reason why this is the case is because Vipshop Holdings' competitors are able to consistently leverage on high growth areas and pivot their businesses towards addressing the needs of their consumers. A 2017 Total Retail Survey by PwC showed that 70% of Chinese shoppers believe that personalized marketing experiences are important, and that Chinese consumers are almost twice as likely to click on an advertisement that is relevant to them than the global average (31% vs 16%). Because Chinese consumers hold real-time personalized offers with more importance, e-commerce platforms need to leverage on data analytics to deliver what consumers want directly to them in order to improve customer satisfaction and encourage repeat purchases. Which is why competitors such as JD.com (JD) and the Alibaba Group (BABA) have undergone strategic partnerships with other firms to source external data to improve their own marketing functions. In 2015, under a strategic partnership between JD.com and Tencent (0700), JD's consumer consumption data was linked with Tencent social data in order to better provide targeted marketing to consumers on the WeChat network. This partnership allowed JD to welcome many new first-time buyers, and is still an important source for customer acquisition for JD today. Other firms like Unilever (UNAT) and The Hershey Company (HSY) have also partnered with Alibaba to leverage similar data driven marketing solutions. In the data analytics realm, Vipshop Holdings is expected to lag behind its peers simply because it is only running on its internal consumer data, lacking partnerships with external data sources.
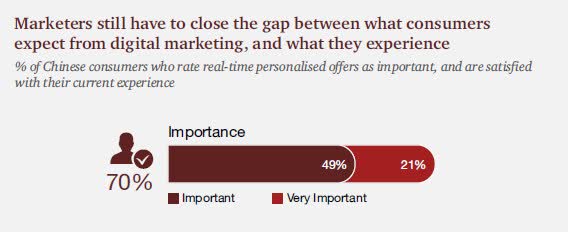
(Customers place a premium on having targeted advertisements)
In the Chinese market, there is a diminishing distinction between what is considered a social media network, and an e-commerce service provider. E-commerce platforms have started using livestreaming and short video sharing to as a marketing function to promote their goods. Leveraging on social media and livestream networks can pay off huge dividends because firms are easily able to translate user engagement to active buyers on their e-commerce platform by simply integrating a purchase button on the livestream page. We return to the same PwC Total Retail survey which indicates the significant impact of effective social engagement with 79% of Chinese Customers, saying that "positive interactions with brands on social media have driven them to endorse the brand more and 71% of customers have spent more as a result".

(Live streamer on Taobao live markets a piece of clothing, which is immediately purchasable by clicking at the bottom of the screen - image from screengrab)
We can clearly see the impact of integrating social media engagement tools into e-commerce by looking no further than Pinduoduo (PDD). They have gamified the whole process of e-commerce, encouraging users to share deals and encourage group purchases by offering discounts if enough people purchase together. Users are also incentivized to play certain games with friends in order to obtain certain discounts. This has resulted in their explosive growth, to become the second largest e-commerce platform on an active user basis in just a short few years after their IPO.

(Team Purchase function in Pinduoduo)

(Pinduoduo's Gamification of e-commerce)
Diversifying into other high-growth areas also appears to be a trend among the top competitors in the e-commerce landscape, something which Vipshop Holdings is also lacking in. For instance, Alibaba has invested into cloud computing networks to complement their e-commerce services. As data on consumers balloon over time, their cloud computing network will be able to assist with rolling out efficient artificial intelligence models for targeted advertisements. JD.com on the other hand has focused their efforts into developing state-of-the-art delivery and logistical networks, utilizing artificial intelligence and new modes of transport allowing them to enhance their fulfilment capabilities while serving as an external logistical service provider for businesses.
While its competitors were focusing on how to better acquire customers by leveraging on the growth of social media, livestreaming and internet services in general, Vipshop Holdings' plan to improve product visibility and acquire additional customers through physical retail seems to be very much ambitious in comparison.
So is Vipshop Holdings still a good buy?
As a result of their ventures to physical retailing, there might be concerns about their long run performance, and whether they will lag behind their peers. Personally, I believe that the minute upside potential for Vipshop Holdings stemming from its valuation does not justify the opportunity costs and downside risks of going to physical retailing. But this position is not a permanent one. Right now, its limiting factor is its small market share, and much more needs to be done to catapult it into a more competitive position with respect to industry giants such as JD.com or Alibaba.
Specifically, I would like to see more evidence of them addressing tastes and preferences of consumers, and moving more into the digital world instead developing offline retail modes. Their business model remains a compelling competitive strength in China's e-commerce landscape. However, I still believe they need to be able to translate their strategic position into pure market share.
Disclosure: I/we have no positions in any stocks mentioned, and no plans to initiate any positions within the next 72 hours. I wrote this article myself, and it expresses my own opinions. I am not receiving compensation for it (other than from Seeking Alpha). I have no business relationship with any company whose stock is mentioned in this article.
