Direxion Daily S&P 500 Bull 3x Shares ETF: Create Your Own Santa Claus Rally

The Direxion Daily S&P 500 Bull 3x Shares ETF tracks the S&P 500 Index in three times accelerated mode.
Sector analysis reveals the strength of its holdings.
With market signals being only slightly positive, possible gains are on the low side through ETFs like SPY and IVV as from December.
On the other hand, SPXL's accelerated mode allows for much higher gains, if handled with care.
Direxion Daily S&P 500 Bull 3x Shares ETF (SPXL) tracks the S&P 500 Index just like the SPDR S&P 500 ETF (SPY) or the iShares Core S&P 500 ETF (IVV) with the latter forming part of its holdings at about 76%.
More importantly, it does the tracking in three-times accelerated mode. This means that when SPY or IVV climb by 5%, this translates into whopping gains of 15% for SPXL, except for the effects of compounding as I will explain further below.
For investors used to the double-digits growth of the technology sector, SPXL does offer the possibility to make big gains in what is perceived to be a rather monotonous December stock market.
The leveraged ETF is structured by holdings of assets including derivatives to maintain its share price equal to three times the S&P 500 index it tracks.
Figure 1: Sector breakdown and top 10 holdings.
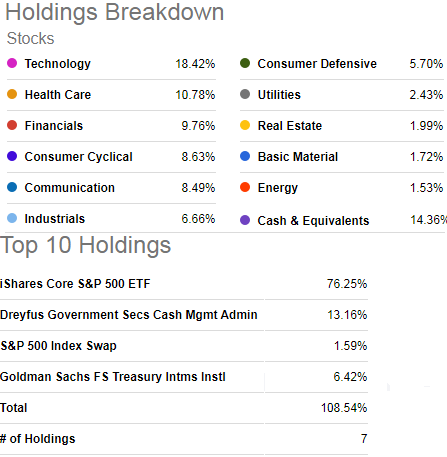
Source: Seeking Alpha
After breaking up the ETF, I perform a sector analysis in order to grasp the macro-trends which are likely to determine the direction in which it moves.
Sector analysis
First, looking into the rear mirror, the last time I covered the mighty SPY was in May and I was bullish (the only one at that time) on the ETF. There has been more than 20% upside since then.
I was bullish primarily because of the productivity aspect of work from home as well as the resiliency of many industrial names despite being affected by supply-chain constraints.
Additionally, I was mainly optimistic about the technology, healthcare and communications sectors together with some industrials forming part of SPY's underlying fund.
Six months later, promising vaccine news have spurred a major shift in investors' money into cyclical including financials and industrials. As for tech which stills constitutes a sizeable part of SPXL holdings at 18.5%, analysts are divided. One group has been predicting a fall as the market digests its gains after the new records established by the S&P 500 reaching the 3630 level.
On the other hand, there is another group which sees FANG coming back to strength due to cloud adoption gaining continued traction among companies and the low interest rates favoring their cash-rich status. Here, semiconductor names which have benefited from orders emanating from the auto industry could help in the upside.
Moreover, two sectors which were absent from the recovery, that is financials and industrials, are up by 18% and 15% respectively and the increase in commodity prices like copper suggests that manufacturing's pace is accelerating.
Pursuing further, the healthcare sector which has already gained 35% since March lows should know more subdued gains going forward after vaccine development euphoria as focus now turns to vaccine manufacturing and distribution.
Also, as infection rates increase, central bankers' dovish tone is likely to persist going into 2021, giving further impetus to risk assets.
On the other hand rising death rates, social distancing and lock-downs may pressure investor sentiment going into the new year. Also, with the current tenant in the White House showing a degree of resistance to perform a smooth transition, there are plenty of events which can cause volatility till January.
Therefore, this does not appear to be a smooth ride to the top of the December slope and calls for a different trading strategy unless you are a long-term buy-and-hold investor.
Advantages of SPXL
Mixed signals mean that the ingredients are not present for SPY and IVV to rise as during the July to August period. The subsequent erratic growth path of IVV as from the beginning of September provides an idea of things to come.
Figure 2: Comparison of SPXL and IVV
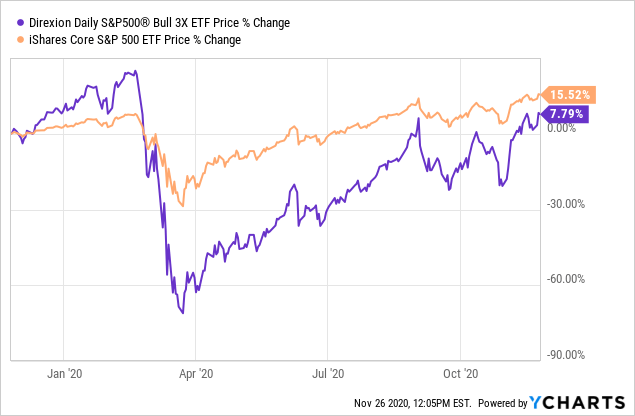
On the other hand, the fact that SPXL magnifies IVV's rise by three times means that there are opportunities for traders to make double digits gain after accounting for fees.
Hence, after a relative calm period spanning from the end of June to the beginning of September, volatility, as measured by the widest intra-day share price variation of SPXL is on the rise again. In this case, I obtained the variation by subtracting the lowest from the highest daily prices.
Thus, there has been two instances when the variation exceeded the 10% mark and two reaching 9% each. Still, one should not expect the brutal price movements of March where gains in excess of 25% were possible unless some extreme investor sentiment crops in.
Figure 3: Intra-day daily variations of 9% and above.
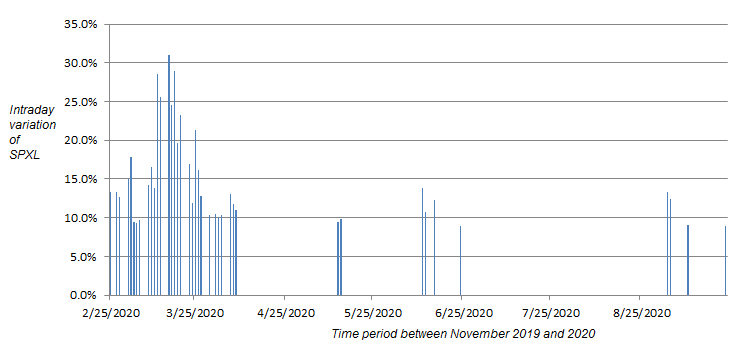
Source: Chart compiled from data from finance.yahoo.com
Looking across the bullish investment tool space, another one which also forms part of the leveraged equities category is the ProShares UltraPro S&P 500 (UPRO) ETF. The latter is also commonly used to adopt highly bullish positions on the S&P 500 and its one-year performance beats SPXL by about 2%. The ProShares ETF is also slightly less expensive to trade at an expense ratio of 0.92%.
Figure 4: Comparing SPXL and UPRO.
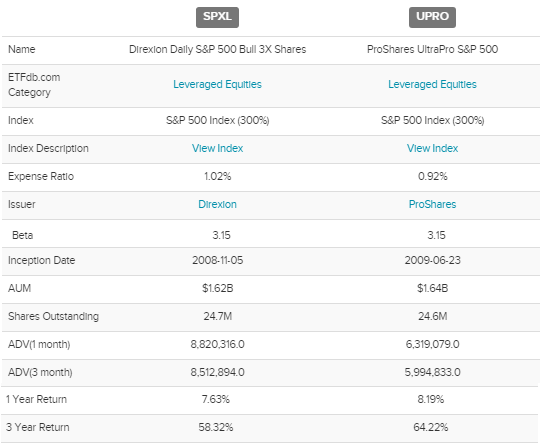
Source: etfdb.com
On the other hand, UPRO has a very high exposure at over 40% to the U.S. dollar and the currency is typically in demand in times of stress due to its traditional role as a haven. Now, with vaccine availability as from the beginning of 2021 and money supplies being at all-time-highs, there are inflation risks. To address the problem, some central bank actions could put pressure on the dollar.
Now, SPXL also holds cash and money market instruments such as the Dreyfus Government Cash Management Fund and Financial Square Treasury Instruments Fund but both are limited at 20% of holdings.
These instruments with assets in government securities seek to maximize current income to the extent consistent with capital preservation and also aim to maintain liquidity.
Therefore, SPXL has some strong points which make it attractive as a trading tool and this is the reason that despite bearing a higher expense ratio of 1.02%, it is traded more on an average volume basis.
Trading strategy
Trading the SPXL means being used to its inherent volatility whereby it replicates the movement of its underlying index by three times, either upwards or downwards. In this case, it is advisable for traders to closely follow the path and only place their bets during favorable moments.
Looking deeper for such moments, while SPY's path has been trending higher on a gently sloping path, the upward movement has been much steeper for SPXL and punctuated by episodes of "violent fluctuations" as in the beginning of June. However, as a trader, this episode can be very profitable resulting in a win of 17.5% just over 7 days from June 1 to June 8. During this time IVV appreciated only by 5.8%.
Figure 5: SPXL chart and performance.
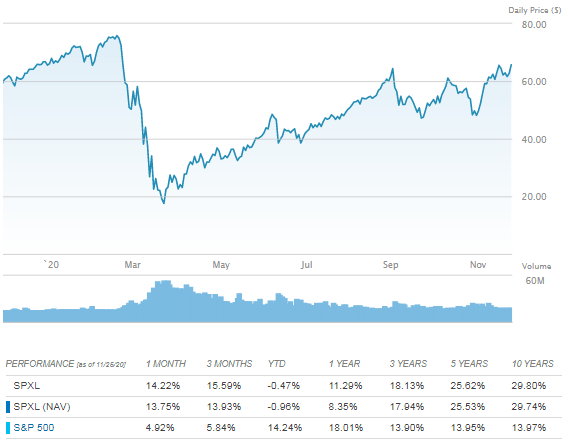
Source: etf.com
However, over a longer period of time, from June 1 to July 22, SPXL went up by 19.5% while at the same time IVV appreciated by 7.3% which means less than three times appreciation, not in line with the prospectus.
The reason for this discrepancy is due to the implications of SPXL's daily re-balancing of its portfolio using swap mechanisms, also called compounding effect. This effect is made worse by the high degree of leverage.
The discrepancy between what is theoretically possible according to the prospectus and the actual gains becomes more exacerbated when considering three-months and one-year time horizons. In addition to the compounding effect, this is simply due to SPXL also replicating the downsides of the index it tracks.
Therefore, it is generally not a good idea to adopt a buy-and-hold position and most documentation I have come across, advise to include SPXL as part of a day trade strategy. Still, for my part, I have successfully used leverage tools for up to six months but had already put a prior order on my trading system for a quick exit in case the downwards movement was too steep.
This said, it is hard to ignore those fantastic upsides of 25.62% over three years when the S&P 500 appreciated by only 13.95%. The upsides possible through the SPXL become more evident when the market is positive but not moving by much.
Thus, SPXL is an ETF to take advantage of this monotony especially when financials which constitutes nearly 10% of holdings has still not recovered from the March crash despite banks being highly trusted in contrast with the last recession in 2008.
Figure 6: Performance comparison with financials still at -5%
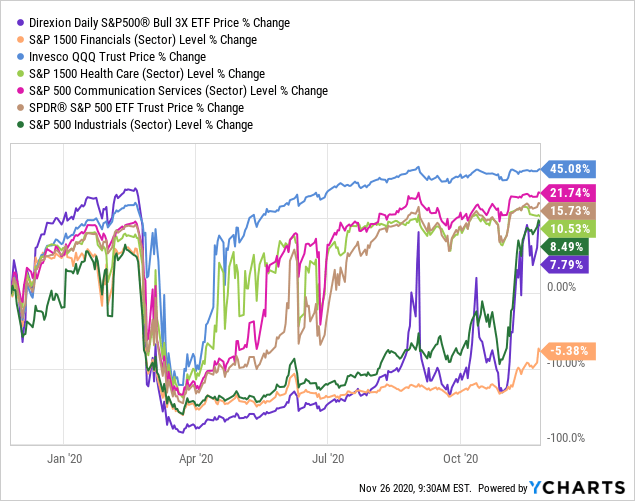 Data by YCharts
The takeaway here is that in contrast to tech stocks, SPXL's share price fluctuations can be painful during downsides and it is better to exit with a small loss than hope for an elusive upside.
Conclusion
Keeping political biases aside, it's always easy to build a pessimistic case for the transition of power. Whatever scenario you're looking at, it is important to balance the medium-term returns and short-term opportunities. In this case, investor pessimism can increase, leading to lower asset prices and therefore better investment opportunities.
However, price momentum indicators do not point to a possible downside in the S&P 500 for now and with no strong catalysts to move the market in sight, other factors have to be considered. Moreover, with the large November gains behind us, there is less likely to be a Santa Claus rally.
Still, other stocks in the industrials and financials sectors still have to catch up. Therefore, after having already gone through the $57 support level, SPXL should progress to $72-75 range after a momentary retrenchment.
This would mean gains exceeding the 12-15% range constituting a rally in December and at the same time permitting a diverse approach to managing money, by SPXL's diverse sector exposure.
Finally, while it is important to be on the watch for "3 times deceleration" events, historical data shows that leveraged ETFs can also be used as part of one's portfolio for longer term growth.
Disclosure: I/we have no positions in any stocks mentioned, and no plans to initiate any positions within the next 72 hours. I wrote this article myself, and it expresses my own opinions. I am not receiving compensation for it (other than from Seeking Alpha). I have no business relationship with any company whose stock is mentioned in this article.
Additional disclosure: This is an investment thesis and is intended for informational purposes only. Investors are kindly requested to do additional research before investing and most welcome to request any clarification through the comments.
