Sage Group: Poor FY20 And Margin Reset Indicate Ongoing Struggles

Sage's FY20 results last Friday were poor, and the FY21 margin reset surprised investors, sending shares down 13.4% that day.
We find the way management reports performance potentially misleading, and underlying figures are more consistent with a struggling business.
“Renewal by Value” has stagnated, “organic” growth has been falling, and the underlying EBIT has shrunk by 20% since FY18.
At 599.4p, shares are trading at a 21.3x P/E; the dividend represents a 2.9% yield and is targeted to grow only "in real terms".
With Sage seemingly continuing to fall behind competitors, this is not cheap enough. We would avoid this stock.
Introduction
We review our Neutral rating on Sage Group PLC (OTC:SGGEF) (referred here as "Sage") after FY20 results last Friday sent shares down 13.4% (in U.K. pounds in London). Since we initiated our coverage at Neutral in September 2019, Sage shares have lost 9.9%, including 17.7% year-to-date (after dividends).
We also initiated a Buy rating on Sage's main competitor, Intuit (INTU), in September 2019. Since then Intuit shares have gained more than 30%.
Neutral Case Recap
Our Neutral rating on Sage last September has centred on the low quality of its business, with negative attributes including:
- Sage is spread too thin geographically, is not focused on the "white space" growth potential among small business customers and has a more limited platform
- Organic growth in total revenues had been at approx. 6% (up to FY19), with growth in recurring revenues offset by the shrinkage of other revenues
- Margins are under pressure due to the need to increase R&D investment and continuing to invest in sales
- A material technology risk, with new products from Intuit and Xero (OTCPK:XROLF) potentially disrupting its key markets (the U.S., the U.K., France)
- Investor distributions would be limited to the dividend, which is only targeted to grow with inflation, with the rest of the Free Cash Flow potentially being spent on more large acquisitions.
Where we thought we were most likely to be wrong was on Intacct, a fast-growing U.S. business acquired for $850m in 2017, which may generate huge revenues when cross-sold to Sage customers outside the U.S.
Since then Sage has actually performed worse than we expected, with FY20 results adding to evidence that it is struggling, as explained below.
FY20 Profit Decline
Sage's FY20 results were poor, but not a surprise as management has repeatedly guided down expectations, most recently in the Q3 FY20 trading update in July.
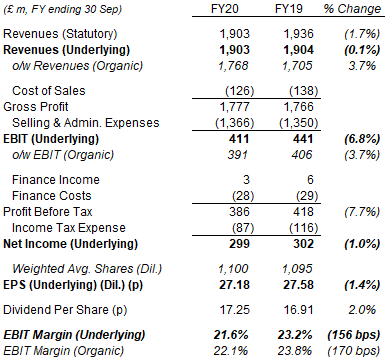
On an underlying basis, revenues were flat (down 0.1%) year-on-year, EBIT was down 6.8% and Profit Before Tax was down 7.7%; however, a lower tax rate due to one-off items (especially the French patent box tax legislation) meant that the declines in Net Income and EPS were only about 1%:
| Sage P&L (FY20)
Source: Sage results release (FY20). |
FY21 Margin Reset
The real disappointment in FY20 results was the FY21 outlook, which included a margin reset of “up to” 3 ppt, to fund "investments" in R&D and sales & marketing. Sage also guided for FY21 “organic” recurring revenue growth to be 3-5% and for other revenues “to continue to decline”:
| Sage Outlook (FY21 & Beyond)
Source: Sage results presentation (FY20). |
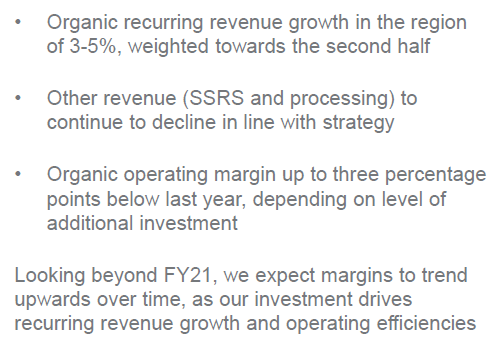
If we assume non-recurring revenues will decline by 10% in FY21 (they were down 26% in FY20), the outlook would imply roughly flat revenues and an EBIT decline of up to 15% in FY21.
Management did not provide any medium-term outlook, except for EBIT margin to rise “over time”. CEO Steve Hare expressed an “ambition” for double-digit revenue growth but did not give any timescale:
“I absolutely want Sage to be in a position where it's delivering double-digit growth. But at the moment, it is extremely difficult to see the timescales and indeed the sustainability of that... our medium-term ambitions remain the same. We want to grow double digit, and we want to do that efficiently ... we want to deliver increasing margins over time. But ... we're not going to give timescales.”
Steve Hare, Sage CEO (FY20 earnings call)
Potentially Misleading Financial Metrics
We have always found Sage performance hard to analyse, as many management metrics are confusing or even potentially misleading. However, as we will explain below, the figures and other underlying results are more consistent with a struggling business.
Sage has always preferred to focus on “recurring revenues” and “organic” growth rates. In FY20, “organic recurring revenue growth” was 8.5%:
| Sage Mgmt. Financial Highlights (FY20)
Source: Sage results presentation (FY20). |
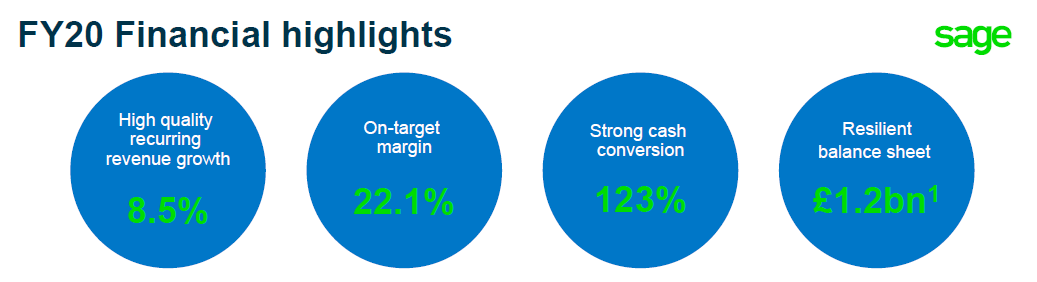
However, "organic" total revenue growth was only 3.7%, and underlying revenues actually fell slightly (by 0.1%). “Organic” is defined as excluding businesses that management has sold or has decided to sell, which means there is scope to simply not count businesses that were not performing. The set of “held for sale” businesses has continued to expand, with lines worth another £100m of revenues (and £15m of EBIT) added in FY20.
"Recurring" revenues are also not a stable, homogeneous group, and contain lines that are being migrated to other lines and/or are shrinking:
| Sage Recurring Revenue Lines (FY20)
Source: Sage results release (FY20). |
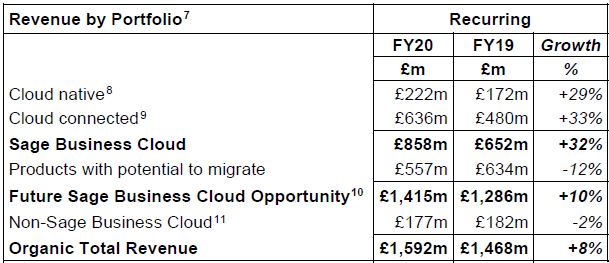
We believe the emphasis on “recurring” revenues can also be overstating Sage's growth, because at least part of the new "recurring" revenues come from cannibalizing existing non-recurring revenues.
Another set of metrics management has preferred to emphasise is the penetration levels of subscription revenues and Sage Business Cloud revenues:
| Sage Strategic Key Performance Indicators (FY20)
NB. ARR = Annualized Recurring Revenues. Source: Sage results presentation (FY20). |
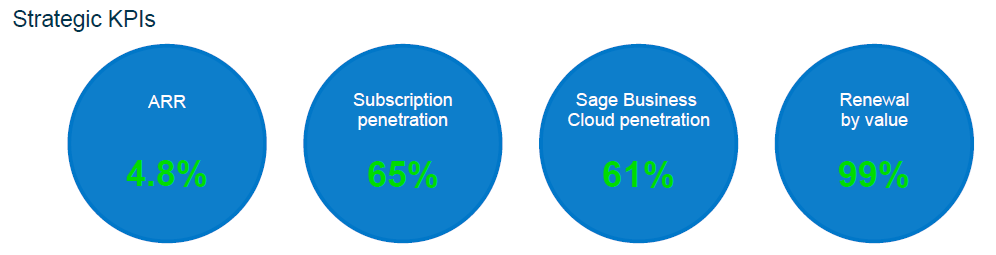
Subscription-based revenues are superior, but their increase in Sage's revenue mix has not led to improvement in performance, as we will show below.
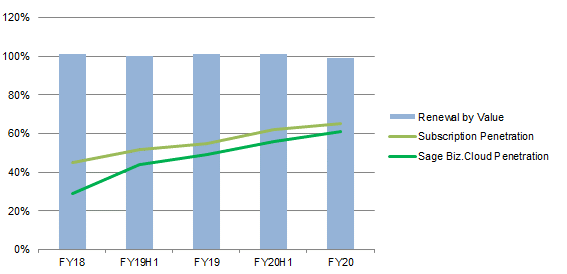
No Improvement in Renewal by Value
“Renewal by Value” is a measure that compares the recurring revenue run-rate for existing customers between the start and end of each year. It includes the benefits of price increases and upsell, and should increase as the quality of the the existing customer base improves.
However, despite the rise in subscription and Sage Business Cloud penetration rates, Renewal by Value at Sage has stagnated at round 100% since FY18:
| Sage "Renewal by Value" vs. Subscription Penetrations (FY18-20)
Source: Sage company filings. |
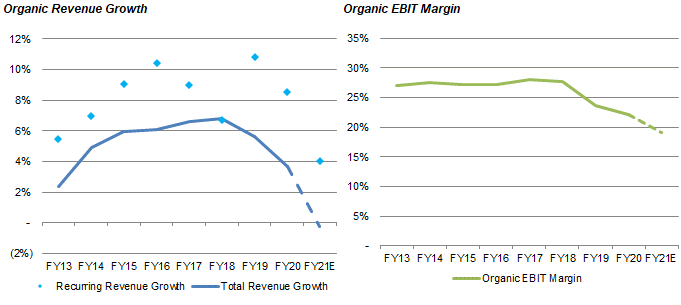
Falling “Organic” Revenue Growth & EBIT Margin
Even if we use management's “organic” measures (i.e. excluding sold/for-sale businesses), they show a deteriorating performance:
- “Organic” recurring revenue growth went from 10.8% in FY19 to 8.5% in FY20, and is guided to be 3-5% in FY21
- “Organic” total revenue growth went from 6.8% in FY18 to 3.7% in FY20, and is likely zero in FY21
| Sage “Organic” Revenue Growth & EBIT Margin (FY13-21E)
NB. FY ends 30 Sep. Source: Sage company filings. |
With Renewal by Value at close to 100% each year, the slowing recurring revenue growth means Sage is signing up fewer new customers each year.
As shown above, “organic” EBIT margin has also been declining since FY18.
Some investors believe that Sage's total revenue growth has been poor because of an ongoing migration to recurring revenues. However, we do not believe this explains why total revenue growth has continued to trend down. The effect of migration from one-off licenses to subscription should only last a few years, depending on the length of the licenses and the pace of migration. For every customer who migrated, there would be a hit in year 1 but a gain in each year after. This means that, unless the pace of migration has accelerated markedly, the effect should be relatively smaller each year, and overall growth should accelerate.
And the pace of migration has not accelerated - the rise in subscription and Sage Business Cloud penetrations have been broadly constant.
“Organic” Revenue Growth Stagnating in £ Terms
“Organic” recurring revenue growth in U.K. pound terms has been relatively flat in each region over time, once one-off changes are excluded; H1 FY20 growth, before COVID, was broadly similar to the prior year:
| Sage “Organic” Revenue Growth in £ (FY17-20)
NB. FY ends 30 Sep. Source: Sage company filings. |
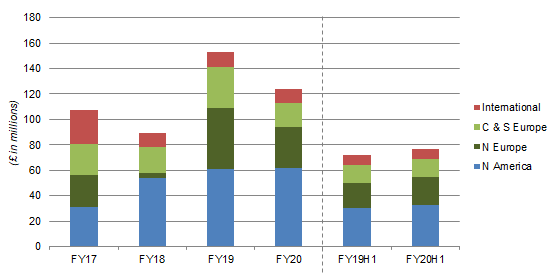
(One-off changes include: North America growth had a step change in FY18, helped by the Intacct acquisition in late FY17; North Europe growth was strong in FY19, helped by the the U.K. government's "Make My Tax Digital" initiative and a weak prior year.)
Again, this is not consistent with an improving business. As the base of recurring revenues becomes larger, the growth in U.K. pound terms each year should also be larger, because price rises, cross-sell of new products, etc., would be applied to a larger base.
Some investors believe Sage's total revenue growth has been decelerating because of a faster migration to recurring revenues. However, if migration has accelerated, recurring revenue growth in U.K. pound terms should not be flat.
Weak “Organic” Growth Outside U.S. & U.K.
Sage’s “organic” (total) revenue growth has been weak outside the U.S. and the U.K., as shown in the charts below.
In North America, “organic” revenue growth has been at about 8% in the last 2 years, helped by Intacct (acquired in late FY17). Excluding Intacct, growth has been at only 4% in both FY19 and FY20:
| Sage Revenue Growth – Noth America (FY13-20)
NB. FY ends on 30 Sep. Source: Sage company filings. |

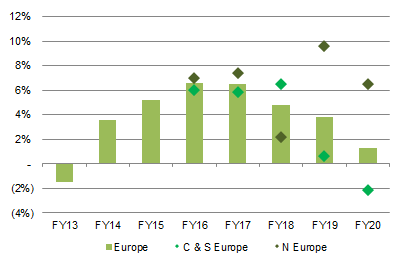
In Europe, “organic” revenue growth has been trending down since FY17, has been stronger in Northern Europe (primarily the U.K., which received a boost from the government's “Make My Tax Digital” initiative in FY19) recently, but has seen near-zero or even negative growth rates in Central & Southern Europe. Revenues in the key French market was down 1% organically in FY20, and management is selling Sage's businesses in Poland and Switzerland:
| Sage Revenue Growth – Europe (FY13-20)
NB. FY ends on 30 Sep. Source: Sage company filings. |
International, which includes Africa & Middle East, Australia and Asia, has been weak since FY18:
| Sage Revenue Growth – International (FY13-20)
NB. FY ends on 30 Sep. Source: Sage company filings. |

Underlying EBIT Now 20% Lower Than FY18
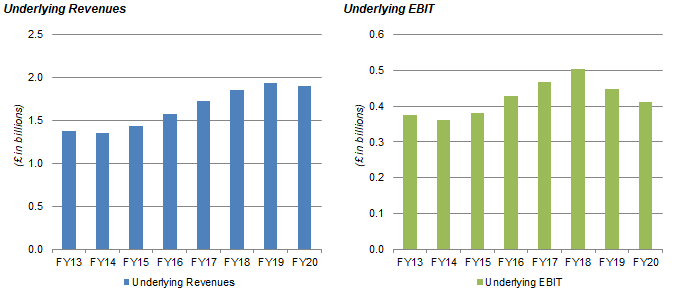
The reliance on “organic” financials can potentially be misleading, as they exclude the (poor) businesses put on sale each year. On an underlying basis, EBIT has shrunk 20% between FY18 and FY20, and could fall by 15% in FY21:
| Sage Underlying Revenue & EBIT (FY13-20)
Source: Sage company filings. |
We believe Sage has continued to be outcompeted by Intuit, Xero and other software companies. Intuit, for example, has continued to grow revenues at near 10% annually. Sage suffers from a material technology risk where its products can become obsolete over time.
Valuation
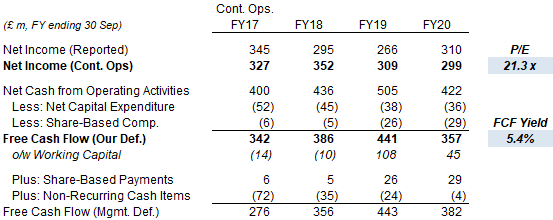
At 599.4p, relative to FY20 financials, Sage shares are trading at a 21.3x P/E and a 5.4% FCF Yield; the Dividend Yield is 2.9% (17.25p):
| Sage Earnings, Cashflows & Valuation (FY17-20)
Source: Sage company filings. |
The full-year dividend was raised by 2% in FY20, in line with Sage's policy of “maintaining the dividend in real terms” (having been downgraded from a "progressive" policy of dividend growth when the current CEO took office).
Net Debt / EBITDA was at 0.3x, compared to the 1.0-2.0x target, though we expect the margin reset would push the ratio up by about a tenth in 2021.
We do not expect the amount of capital returned to shareholders to increase substantially in the near term, Management “don't see (buybacks) as a sensible use of our funds at this stage”, and has told investors to expect more acquisitions:
“Large-scale M&A, probably not on the radar, as you say. But having said that, some acquisitions absolutely are on the radar.”
Steve Hare, Sage CEO (FY20 earnings call)
Conclusion
Sage's FY20 results last Friday were poor, and the FY21 margin reset surprised investors, sending shares down 13.4% that day.
We find the way management reports performance potentially misleading, and underlying figures are more consistent with a struggling business.
“Renewal by Value” has stagnated, “organic” growth has been falling, and the underlying EBIT has shrunk by 20% since FY18.
At 599.4p, shares are trading at a 21.3x P/E; the dividend represents a 2.9% yield and is targeted to grow only "in real terms".
With Sage seemingly continuing to be outcompeted by competitors, this is not cheap enough.
We would avoid this stock, and reiterate our Neutral rating.
Note: A track record of my past recommendations can be found here.
Disclosure: I am/we are long INTU. I wrote this article myself, and it expresses my own opinions. I am not receiving compensation for it (other than from Seeking Alpha). I have no business relationship with any company whose stock is mentioned in this article.
Editor's Note: This article discusses one or more securities that do not trade on a major U.S. exchange. Please be aware of the risks associated with these stocks.
