Arthur J. Gallagher: Maintaining Its Sound Financials To Achieving Real Growth

Arthur J. Gallagher & Co. has nurtured its revenue and income growth over the years. However, the series of acquisitions and the accumulation of assets could hamper its growth.
As it maintained its adequacy and sustainability, dividend growth has accelerated over the past decade.
Despite the high P/E Ratio and the decreasing trend a few days ago, the bullish trend persists and agrees with the estimated value of the price.
The company proved that the pandemic could not slow down its growth with its acquisition of AWIS Group and Optimum Talent, Inc. in the middle of 4Q.
The disruptions by the pandemic did not slow down durable Arthur J. Gallagher & Co. (NYSE:AJG) with its well-maintained operations that could be boosted by its recent acquisitions. Moreover, the sustained dividend growth and the bullish stock price testify to its undeterred growth that promises long-term security to its shareholders. As everything is gradually reopening, things may work in favor of the company, given its increasing viability and operating capacity.
Analyzing the Sound Financials of the Company
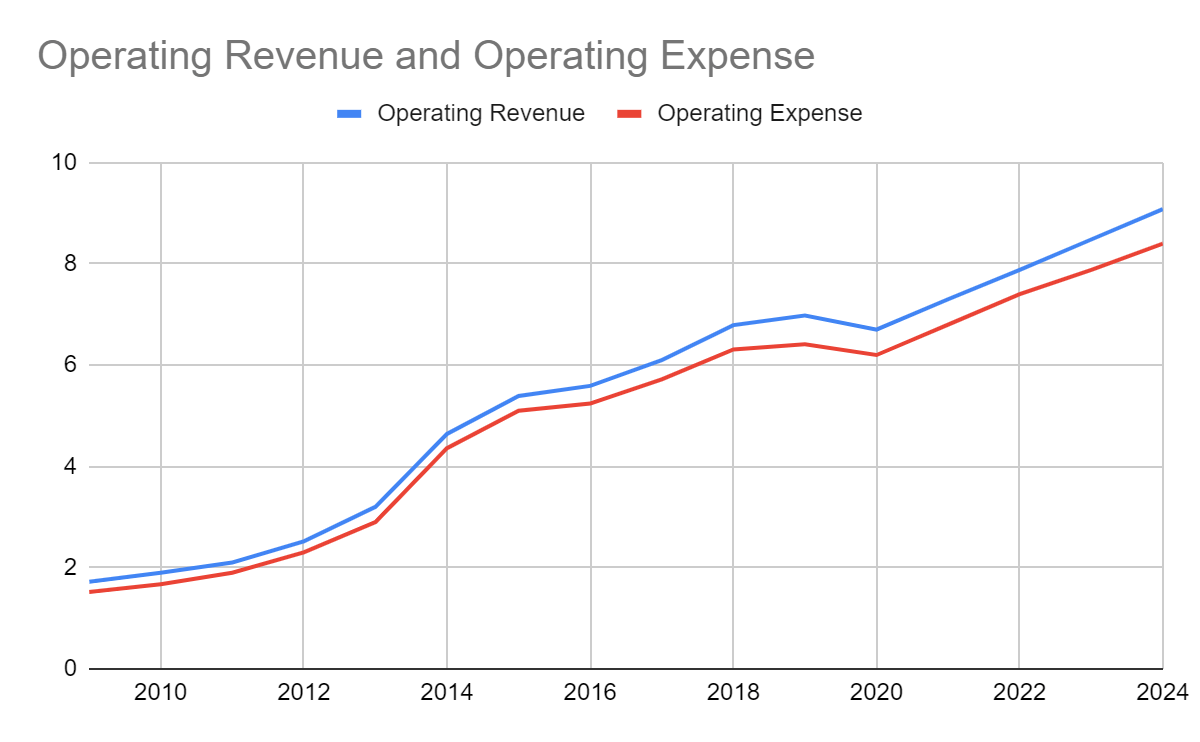
Operating Revenue and Operating Costs
With the increasing importance of the insurance industry matched with the company's prudence and popularity, the company has flourished over the years. Along with Marsh & McLennan (NYSE:MMC), Aon plc (NYSE:AON), Willis Towers Watson (NASDAQ:WLTW), and Hub International (HBG), Arthur J. Gallagher remains one of the largest insurance brokers in the world. The continuous acquisitions and effectiveness in giving advice and arranging insurance for its clients helped the company maintain impressive operations. The operating revenue of the company is primarily composed of trust income, commissions, and sundry income. With an average annual rate of 16%, the company has observed consistent and dramatic growth over the years. From $1.72 billion in 2009, it continuously climbed up and amounted to $6.98 billion in 2019. With this, one can see that the revenue quadrupled for the last 10 years. Moreover, there were years when it increased noticeably like in 2013-2015, when it changed by 27%, 45%, and 17%, respectively. Although the increase has decelerated since 2016, the company managed to sustain it and maintain its standing in the market. With its inclusion in the Fortune 500 in 2016, the company showed how its revenue has relatively grown in just a few years. Since then, it stayed and continued to climb up in the ranking.
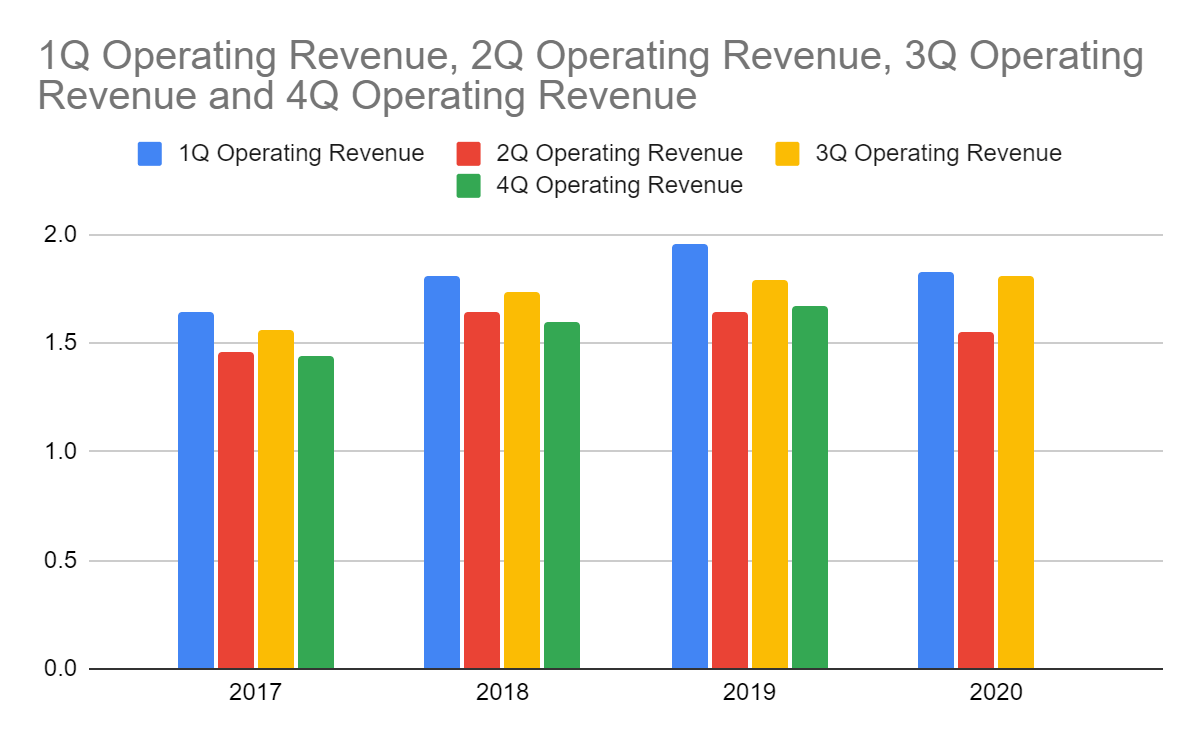
Meanwhile, as the pandemic entered and struck the global market, it did not go easy with the financial sector. During the first quarter, the operating revenue fell from $1.96 billion to $1.83 billion. Although the value remained adequate, the decrease was visible. It fell again in 2Q from $1.64 billion in its comparative quarter to $1.55 billion. The restrictions caused by quarantine measures and the surge in unemployment heavily impacted the company's revenue although the values remained reasonable, given the current situation. Things went differently in 3Q as the company has adjusted to the current situation and the economy has slowly reopened. The operating revenue increased from $1.79 billion to $1.81 billion. The adaptability and resilience of the company's operations played a pivotal role in achieving revenue growth in the quarter. With an accumulated revenue of $5.19 billion, the company was able to manage the operations well, minimize the impact on the revenue, and adapt despite the circumstances. Given this, the company may see better results in 4Q, especially it has recently acquired companies that may stimulate its growth. The operating revenue may still increase to $7 billion. The estimation using the Linear Trend Analysis was more conservative and realistic as the value may decrease to $6.7 billion. But for the following years, it may further increase from $7.3 billion to $9 billion.
On the other hand, the operating expenses were kept lower. Its growth has been similar to the revenue as it also quadrupled from $1.52 billion in 2009 to $6.4 billion in 2019. Nevertheless, the efficiency has improved over the years. Although their trend has been identical, the company maintained a wide gap above $200 million. Over the past decade, it widened which showed an upward movement of the operating profit. In 2019, it almost tripled and amounted to $570 million. With this, one can observe that the company has maintained both revenue growth and efficiency so the viability of the operations increased. As estimated, the operating costs may also decrease to $6.2 billion as the operations contracted in the first half due to the pandemic. It may increase again as the operations go back to normal from $6.8 billion to $8.4 billion while the operating profit may catch up at $680 million in 2024.
Taken from MarketWatch: Arthur J. Gallagher & Co.'s Annual Financials
 Taken from MarketWatch: Arthur J. Gallagher & Co.'s Quarterly Financials
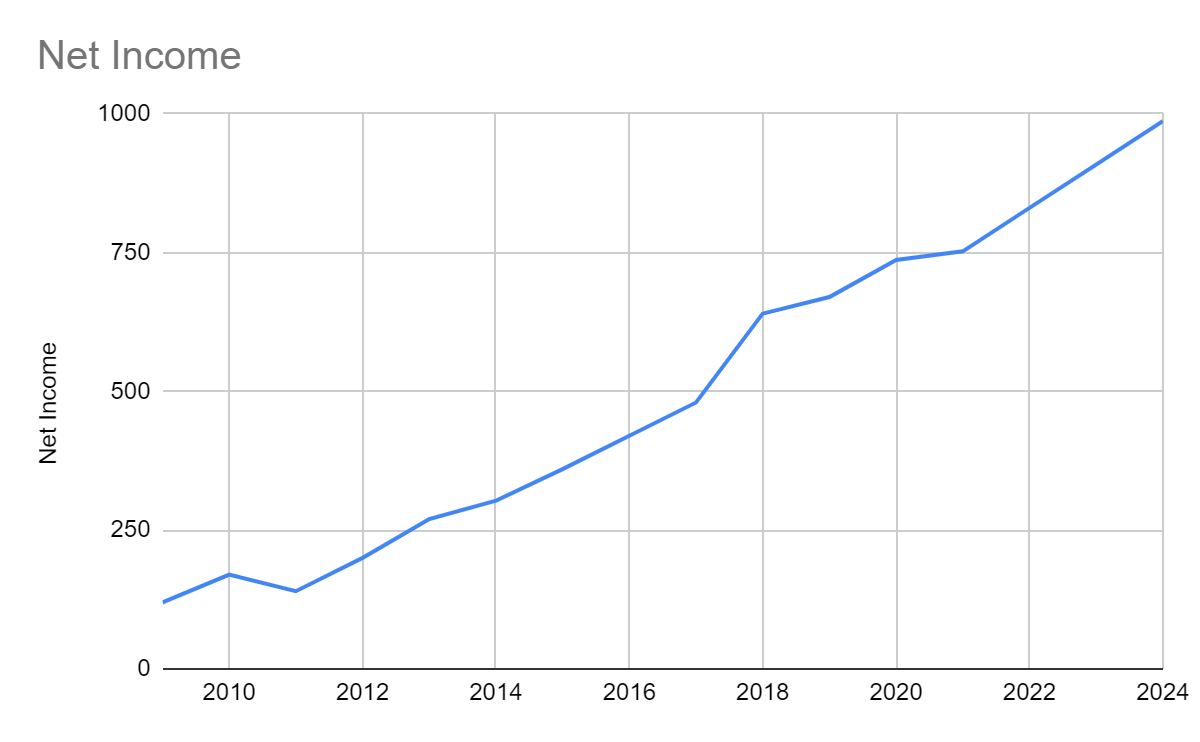
Net Income
Likewise, non-operating income has consistently increased which suggests that the company has maintained profitability in both core and non-core operations. Despite several substantial changes in exceptional expenses, it was offset by the positive trend of the miscellaneous expenses. With this, net income has dramatically increased over the years. Except in 2011 due to higher taxes, net income had an uninterrupted growth over the past decade. From 2009 to 2019, it had a growth rate of 20% on average which may explain the steeper trend of net income. From $120 million, it kept increasing to $670 million in 2019. With this, net income in the previous year was already about five or six times its value which showed its rapid growth.
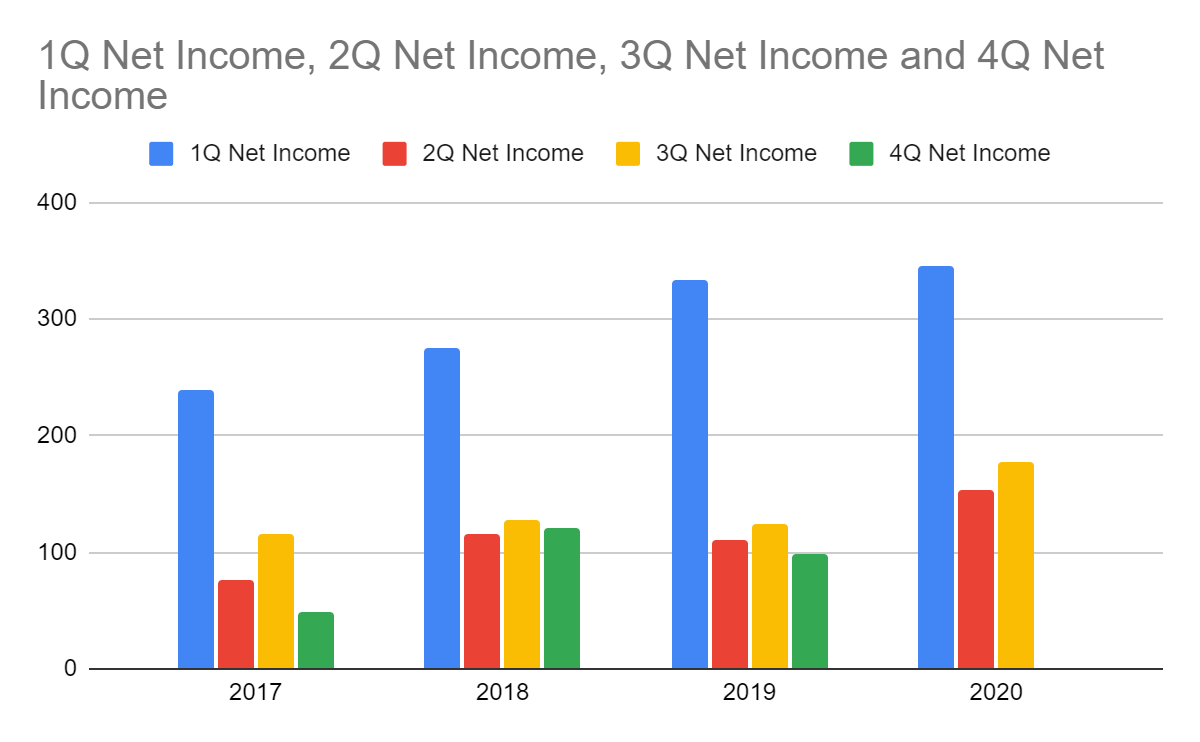
Moreover, even if the pandemic posed threat to its operations, the durable company remained unfazed. Even if the operating revenue decreased in the first half, the company showed its efficiency that it has been utilizing to become one of the biggest insurance brokers in the world. The combination of its contraction and efficiency during the first half helped the company maintain its viability as the operating income remained higher. Also, its core-operations were well-managed and viable. As a result, net income in all quarters was higher than in the previous year. With an accumulated value of $677 million, it was 19% or $100 million higher than the value in 2019 at $568 million. Even if the value for 4Q 2019 will be included, the three-quarter earnings in 2020 would still be higher. Given the reopening of the economy, things may get better and further stimulate the operations of the company. As estimated using the average of the three quarters, net income may increase to $900 million at the end of the year. But the estimation using the Linear Trend Analysis showed lower and more conservative results. Hence, net income may increase to $736 million and would consistently climb up to $980 million for the following years.
Taken from MarketWatch: Annual Financials
Taken from MarketWatch: Quarterly Financials
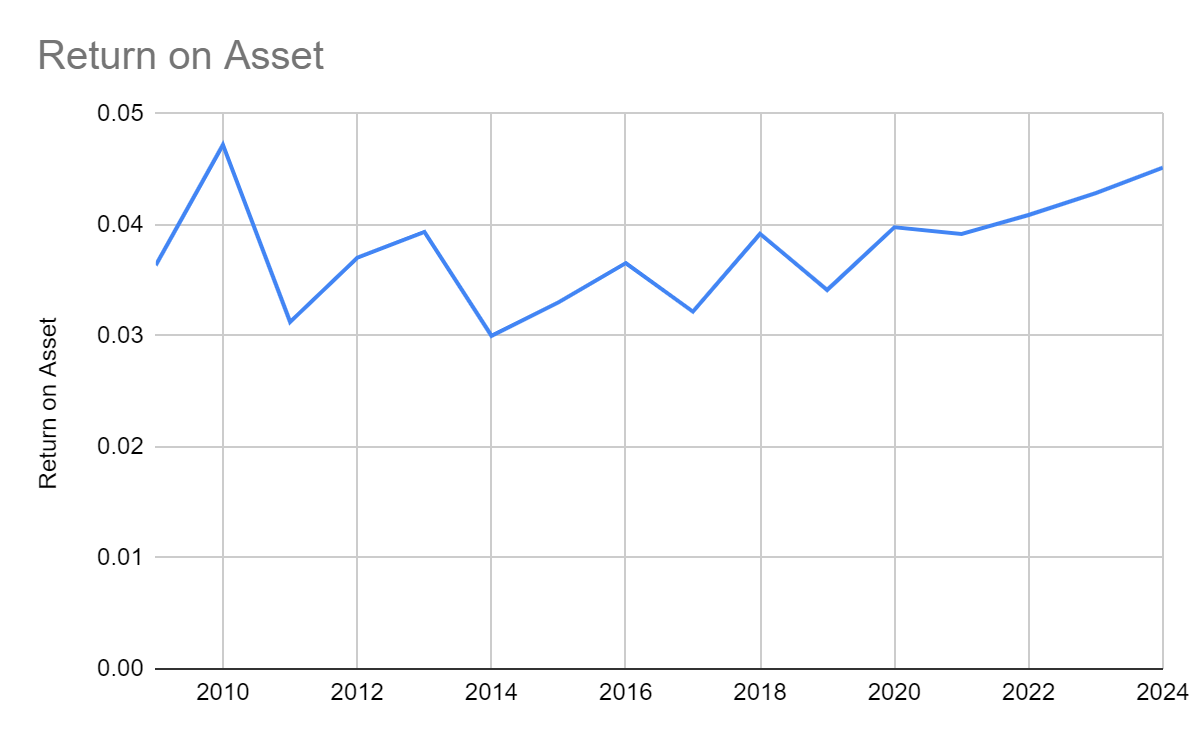
Return on Asset
As one of the largest insurance brokers in the world, Arthur J. Gallagher continued to have a large amount of assets over the years. The assets were primarily composed of intangibles, cash, receivables, and fixed assets. From $3.3 billion in 2009, it rapidly grew and became about six times higher at $19.4 billion in 2019. It was primarily driven by its series of acquisitions as it increased the size and capacity of its operations. Given the continuous enlargement of the company, one must check the profitability of its operations in terms of assets using Return on Asset (ROA). For the last 10 years, its ROA remained stable at 3%. However, it never went above the ideal level of 5%. But it was above the average ROA of the industry as many companies incurred losses or realized smaller earnings relative to their assets. With this, one may think that the profitability of the company has been low but relatively ideal over the years. As discussed in the previous section, the growth rate of net income was high at 19%. It could be proven as the most recent value was already about five or six times the original value. With this, the low ROA was driven by the rapid increase in its assets and acquisitions. While it showed high solvency and profitability, the company must be more prudent in managing its assets and acquisitions. It may choose to forego its underperforming assets and business units that could hamper its growth.
On the other hand, the company managed to realize increasing earnings since 2014, given the generally upward trend. Moreover, despite the pandemic. it could have posed threats to its operations, given the large amount of assets mixed with restrictions in the operations that decreased its sales. But the company managed to be efficient and handle its operations well to remain reasonably viable. Also, the accumulated earnings were higher than the previous accumulated value and even the value in the whole FY 2019. With this, income growth was not interrupted. It even sped up. Given this, the estimation using the Linear Trend Analysis showed a continuous increase in ROA which may surpass 4% for the following years.
Taken from MarketWatch: Annual Financials
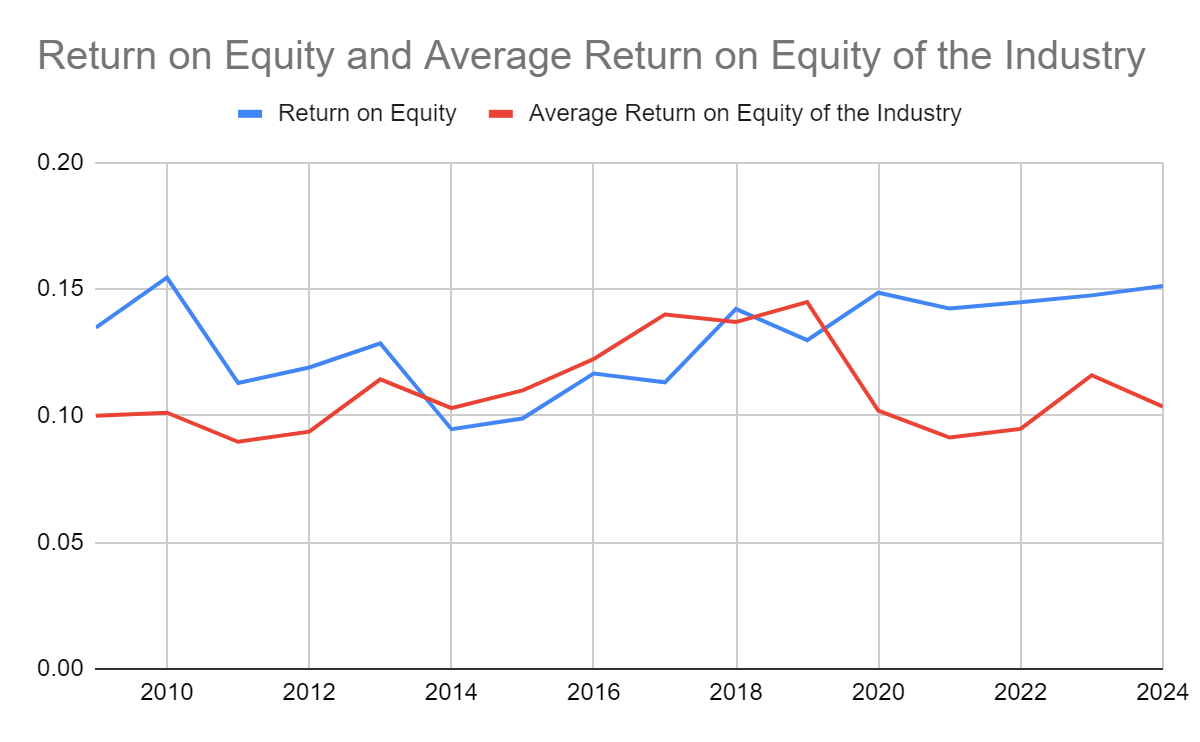
Return on Equity
Like the assets, the company's equity has increased substantially over the years. From $890 million in 2009, it has accumulated to $5.16 billion and has become five or six times larger than its original value. With its value being 27% of total assets, it has always been a primary source of the company's financial leverage. It can also be proven with the increasing number of common shares that almost doubled so the interests of the shareholders have increased dramatically. Given this, one may check how much profit the company has made in terms of equity using Return on Equity (ROE).
Except in 2014, the ROE of the company never went below 10%. For every equity added, the company earned 10% of it. If one would compare it to the industry as a whole, he could see it near the average level. There were years when the company had higher ROE than the industry and vice versa. It was quite tough to identify whether the company was performing above or below average. But given the average ROE of the company, 12.23% compared to 11.42% of the industry, one could see that the company has been doing better than many of its competitors. Given this, it would be safe to say that the ROE for the last 10 years has been ideal. Moreover, using the most recent ROE and the Retention Ratio, the Sustainable Growth Rate (SGR) of the company was 7%. Hence, the company has the potential to further grow by 7% without increasing its borrowings. It proves that the earnings of the company have always been enough to sustain the growth in its operations. But as discussed in the previous section, the company must be more prudent in managing and purchasing assets due. It has to be more careful to sustain its rapid income growth and not increase its financial leverage to acquire and manage underperforming assets and business units that may hamper its growth. Meanwhile as estimated, ROE may continue surpassing the average of the industry as it may increase to 15%-16%.
Taken from MarketWatch: Annual Financials
Nurturing the Interests of the Investors
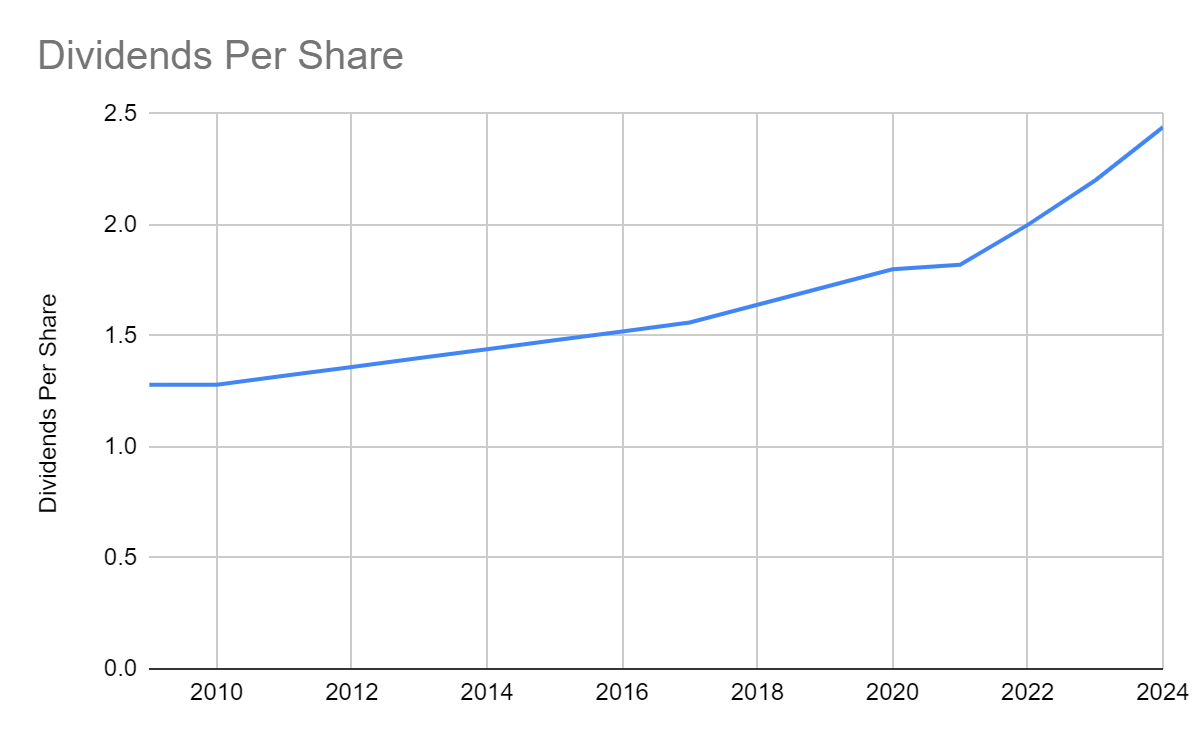
Dividends Per Share
Being a Dividend Contender, Arthur J. Gallagher has somehow proven its commitment to nurturing investors' interests. Although dividend growth paused in 2008-2010, it immediately resumed in 2011. Since 1995, the dividends have visibly grown without a dividend cut which may give assurance to many investors who value long-term growth and security. Although growth from 2009 to 2019 has been quite slow at 3%, it continued and the consistent growth in net income testified to the company's capacity to sustain dividend payments. From $1.28 in 2009 and 2010, the dividends per share have increased to $1.72 in 2019. The estimation using the Dividend Growth Model shows that the dividends per share may increase to $1.76 in 2020. But given the payment for the three quarters, the value would be higher at $1.8 per share. For the following years, the dividends per share may further increase to $2-$2.44.
Taken from Nasdaq: Dividend History
Dividends, Net Income, and Free Cash Flow
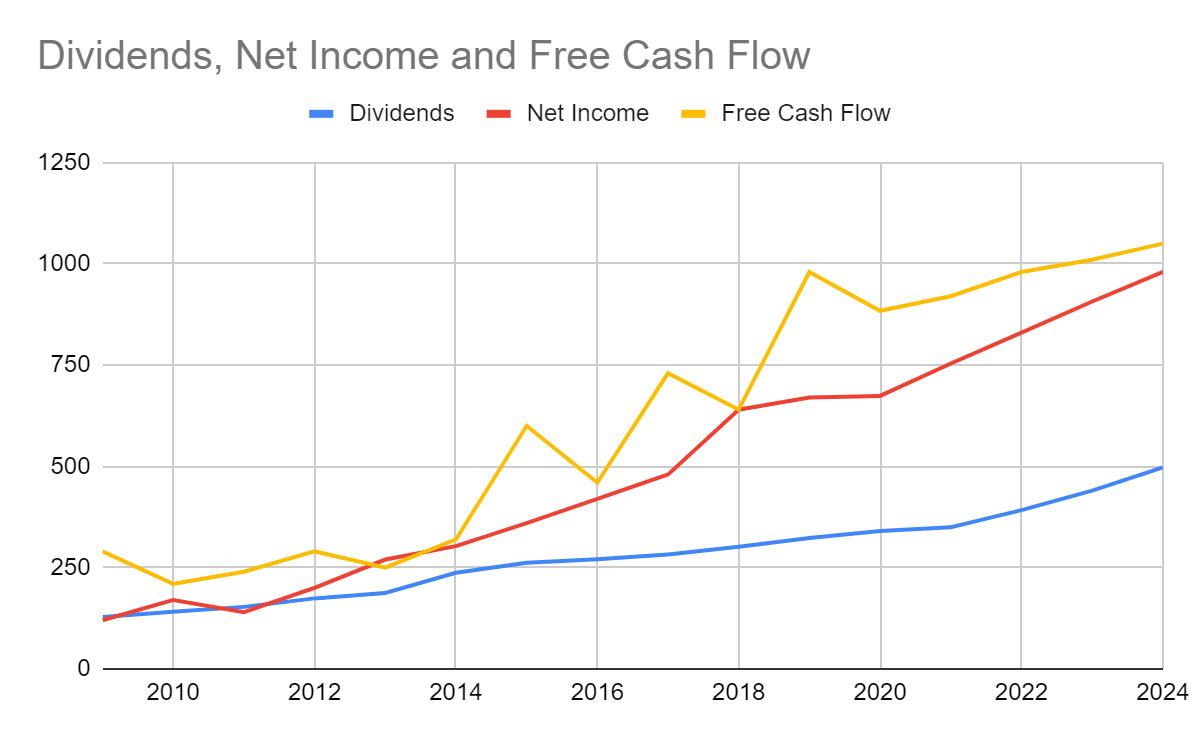
With the impressive growth in net income and the consistent increase in the dividends, the company remained adequate to pay the dividends. Except in 2011 when net income slightly fell, net income has always been higher than the dividends. From about 80%-90%, the Dividend Payout Ratio kept decreasing to 60%-70% in 2013-2017. It shows that the company has become more profitable and more prudent in managing its dividend payments. In 2018, the Dividend Payout Ratio fell to 46%. The dividends still grew although the value relative to net income became lower. Nevertheless, it was an ideal ratio since the company also had to sustain its operations to realize higher earnings and increase its payments. In 2019, it increased to 48%. Given this, we can see that despite the rapid growth in net income, dividend payments remained one of the company's priorities. It also ensured it had enough to sustain its growth. As estimated using both the Dividend Growth Model and the Linear Trend Analysis the Dividend Payout Ratio for the following years would remain within the range at 47%-48%.
Moreover, the similar trend of Free Cash Flow (FCF) confirmed the company's adequacy. It also showed sustainability since FCF also accounts for assets and liabilities for direct operations. Since it includes Capital Expenditures (CAPEX), increasing FCF may show that the company can sustain its operations. In 2019, both net income and FCF have been twice as much as dividend payments. After deducting it, the company would still have more than enough to pay its interest and non-interest borrowings. Given this, the company can operate at a large capacity and sustain its growth for a long period. As estimated, FCF may continue to increase from $800 million to $1 billion.
Stock Price
After hitting its all-time low at $67.64 last March 23, the stock price started increasing. Although the bullish trend persists, it seems that the price has started decreasing upon reaching its highest value at $117.43. The P/E Ratio is high at 28.85 which suggests overvaluation and that the price may decrease until it is set at its real value. On the other hand, the company still shows an impressive performance that may be boosted by its recent acquisitions. Given this, has the price reached its resistance? It may be confirmed using the Dividend Discount Model.
Current Price: $115.41
Average Dividend Growth: 0.03007193569
Estimated Dividends Per Share: $1.80
Cost of Capital Equity: 0.04566850445
Derived Value: $118.8806021 or $118.88
As the derived value suggests, the stock price is still undervalued in terms of dividend growth and the company's adequacy. Hence, the price may still increase and the bullish trend may continue. But the model is limited and other factors may affect the price.
Opportunities for Further Growth
Arthur J. Gallagher and AWIS Group
Two weeks ago, Arthur J. Gallagher announced its acquisition of AWIS Group. Arthur J. Gallagher is known for two things. First, it's one of the largest insurance brokers in the world. Second, it has been acquiring multiple companies over the years. While this act increased the assets tremendously relative to net income which lowered the ROA, the company maintained its standing in the market. Also, the addition of AWIS Group may help the company further boost its sales and earnings, given its good customer relationship in California. If this becomes successful and the company figures out the assets that could have been hampering its rapid growth, then long-term success may be guaranteed.
Arthur J. Gallagher: Building A Better Relationship with Clients while Developing Its Management and Employees
During the first week of November, the company announced its acquisition of Optimum Talent, Inc. and Effectus Consulting Pty. Ltd. The addition of the two may help boost the company's productivity and operations as a whole since it also engages in consulting and administration services. With this, the skills and leadership potential of its employees and management may be further developed. It may motivate them that may increase their productivity and interests which may, in turn, build a better relationship with its clients. Also, the added company to its consulting unit may improve its knowledge and capability on how to lead and deepen the connection with all its senior management across all countries. Hence, efficiency and more organized operations may be expected.
Key Takeaways
For almost a century, Arthur J. Gallagher & Co. continues to thrive and remains one of the leaders in the insurance brokerage industry. With sound financial health, the company continues to be durable. Despite the delays and restrictions caused by the pandemic, the operations of the company remained unscathed and made a series of acquisitions that may either boost or hamper its growth. With this, how should an interested investor make a good decision?
Short-term Investors: The bullish trend of the stock price persists despite the possibility of overvaluation as shown by the high P/E Ratio. But it seems to move in a generally decreasing trend for more than a week already. With this, one may think that the price is either overvalued or has reached its resistance level. Nevertheless, the estimation using the Dividend Discount Model agrees with the company's impressive performance and sustained dividend payments. The derived value shows that the price is undervalued and may increase to $118-$119. Given this, an investor may wait for a few days or a week before deciding since it's too early to tell that the price has started a bearish trend. Also, reading more press releases and other things that may cause market changes may help them.
Long-term Investors: For more than two decades, the company has sustained dividend growth. But the unchanged values in 2008-2010 did not help the company to qualify as a champion. Nevertheless, one can see how the value has changed over time while the company maintained it has adequate earnings to cover it. Also, FCF remained high which confirmed the viability and sustainability of the company. The cash inflows from operations and the expenditure on fixed assets showed the capacity of the company to sustain the operations and its growth for a long period. Moreover, its ROE has been ideal as it remained above the average of the industry. The value near to ROA also showed a sound financial position of the company, given that it was able to balance its financial leverage well. The almost equal partition between borrowings and equity increased the financial strength of the company to cover them. The only problem that one can see is the low ROA as the assets sped up due to its series of acquisitions over the years. The growth in earnings has been impressive but it does not seem to match the change in assets. Hence, the company must be more prudent in purchasing and acquiring assets as these may hamper its rapid growth. Although the growth in operations and long-term security are guaranteed, the company may have to work to stimulate its real growth.
Disclosure: I/we have no positions in any stocks mentioned, and no plans to initiate any positions within the next 72 hours. I wrote this article myself, and it expresses my own opinions. I am not receiving compensation for it (other than from Seeking Alpha). I have no business relationship with any company whose stock is mentioned in this article.
