EWC: Canadian Equities Look Promising Into The Next Business Cycle

EWC is an exchange-traded fund that offers investors the opportunity to get direct, targeted access to Canadian equities.
The EWC fund collapsed earlier this year, following a global market rout in light of the COVID-19 pandemic and as oil prices crashed aggressively.
However, with oil prices stable and following recent positive developments vis-à-vis vaccines, equities have risen and yields have at least firmed up.
While yields still remain low, and oil prices are still a little tepid, the new business cycle makes Canadian equities potentially quite attractive.
Following recessions, USD/CAD has shown the potential to fall, which is positive for U.S. holders of Canadian equities. EWC's main sector exposures also stand to possibly out-perform in an economic upswing.
iShares MSCI Canada ETF (EWC) is an exchange-traded fund that has been constructed to enable predominantly U.S. investors to get direct exposure to large and mid-sized companies in Canada that trade as equities. EWC can be used to express a view on Canada and Canadian business specifically.
EWC is denominated in U.S. dollars, and trades on the NYSE Arca exchange. The 12-month trailing yield, which is calculated by dividing all income distributions over the past twelve months into the most recent NAV, was 2.47% as of October 30, 2020. The expense ratio is 0.49% as stated in the prospectus (annual management fee).
As of November 19, 2020, the holdings within EWC are primarily geared towards the Financials (36.94%), Materials (12.53%), and Energy (12.40%) sectors, closely followed by Information Technology and Industrials. Other important sectors include Consumer Staples, Consumer Discretionary, Utilities, and Communication. The chart below illustrates this breakdown.
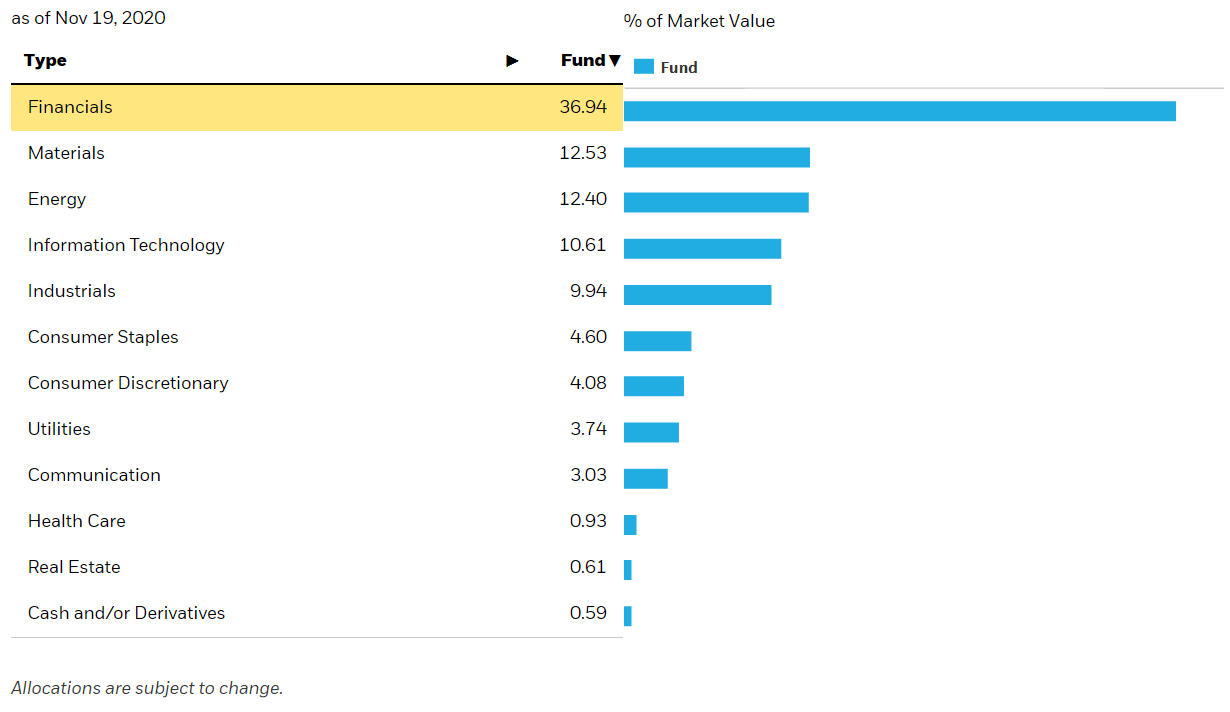 (Source: iShares.com)
The exposure to Financials is rather stark, and perhaps unexpected for many people who do not peruse EWC and simply view it as a more holistic ETF. The Financials stocks include Royal Bank of Canada (7.71% of the entire portfolio), Toronto Dominion (6.44%), Bank of Nova Scotia (3.95%), Brookfield Asset Management (3.71%), and Bank of Montreal (3.08%), among others.
This is not necessarily all bad, which I will explain shortly, however it has been a rather poor portfolio construction for 2020. Canada has been hit hard with oil prices crashing this year, in light of the COVID-19 crisis and ensuing economic crisis. The Department of Natural Resources Canada confirms that, historically, the Energy sector has contributed over 10% to overall nominal GDP, with 5.3% of the direct portion (being 7.2% in total) coming from petroleum. The chart below illustrates this.
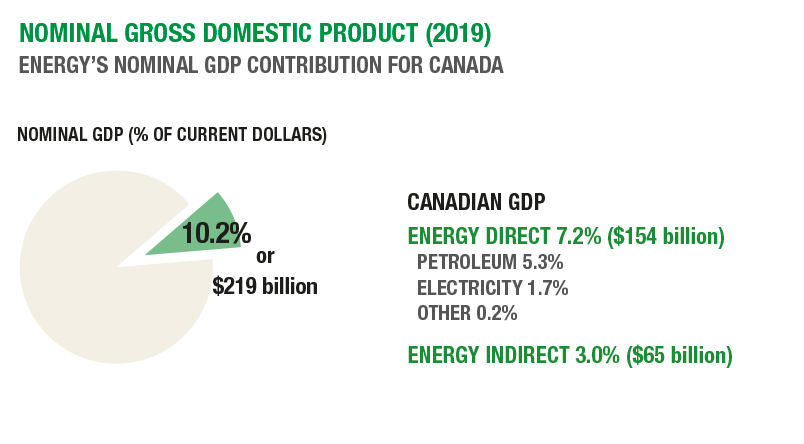 (Source: nrcan.gc.ca)
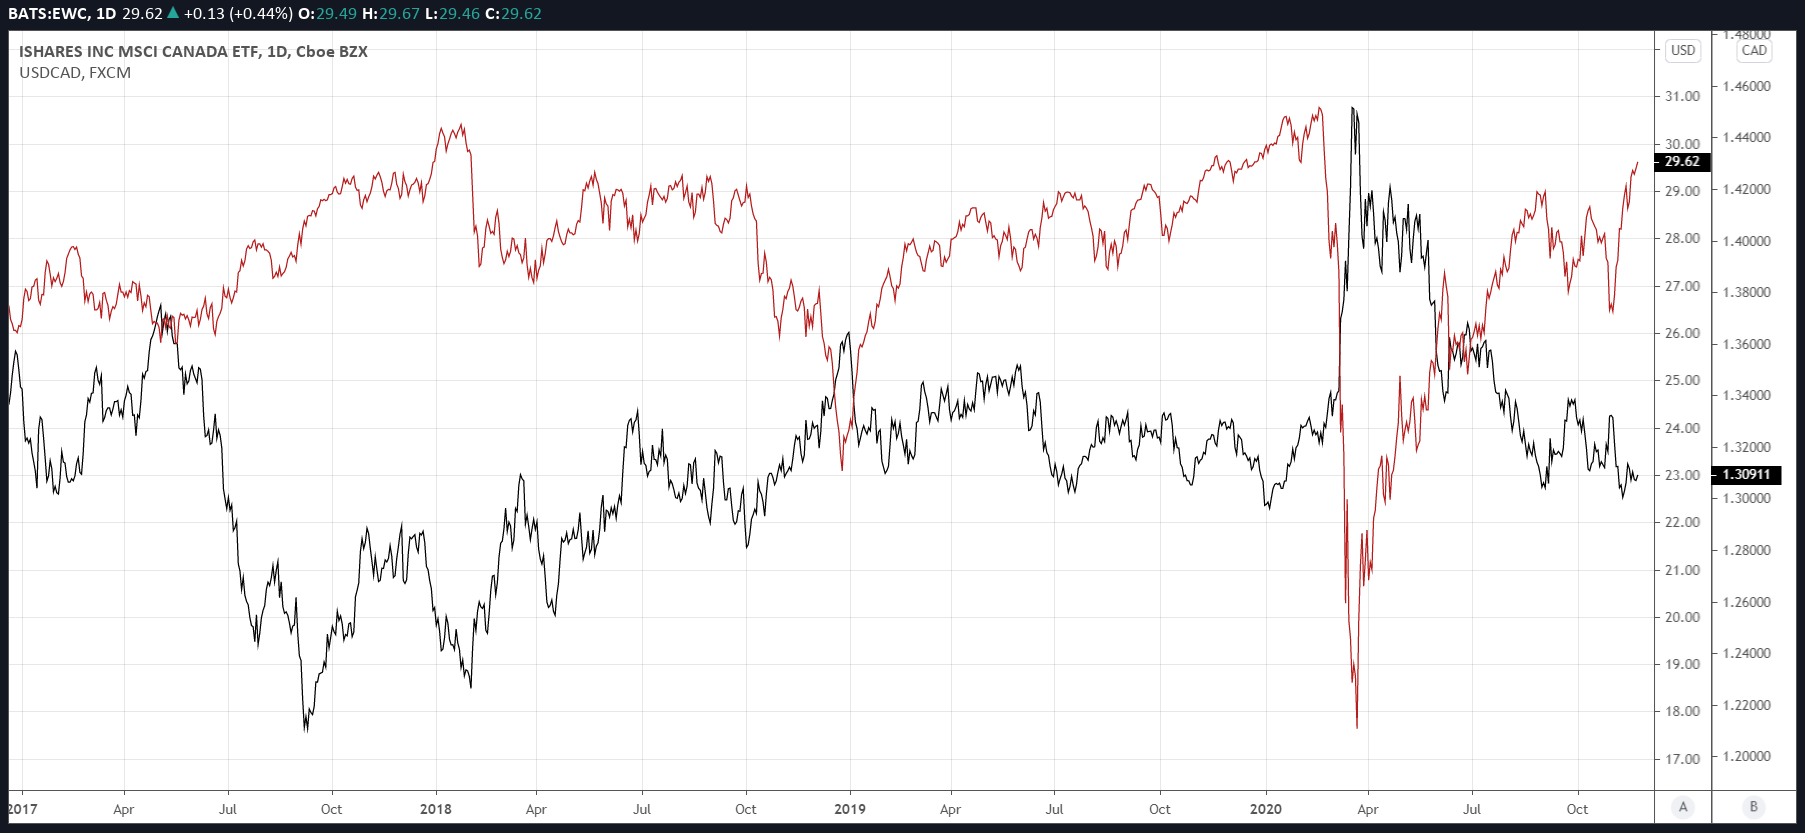
This large sliver would lend to there being a reasonably positive correlation between benchmark oil prices and the price of the EWC ETF. In the chart below, we chart these. Note that stronger oil prices correlate with equities as an asset class in general, especially equities that are also denominated in U.S. dollars (West Texas Intermediate, conventionally denominated in USD, I use as a benchmark via the front-month Crude Oil futures contract). EWC is illustrated by the red line; Crude Oil futures are illustrated by the black line
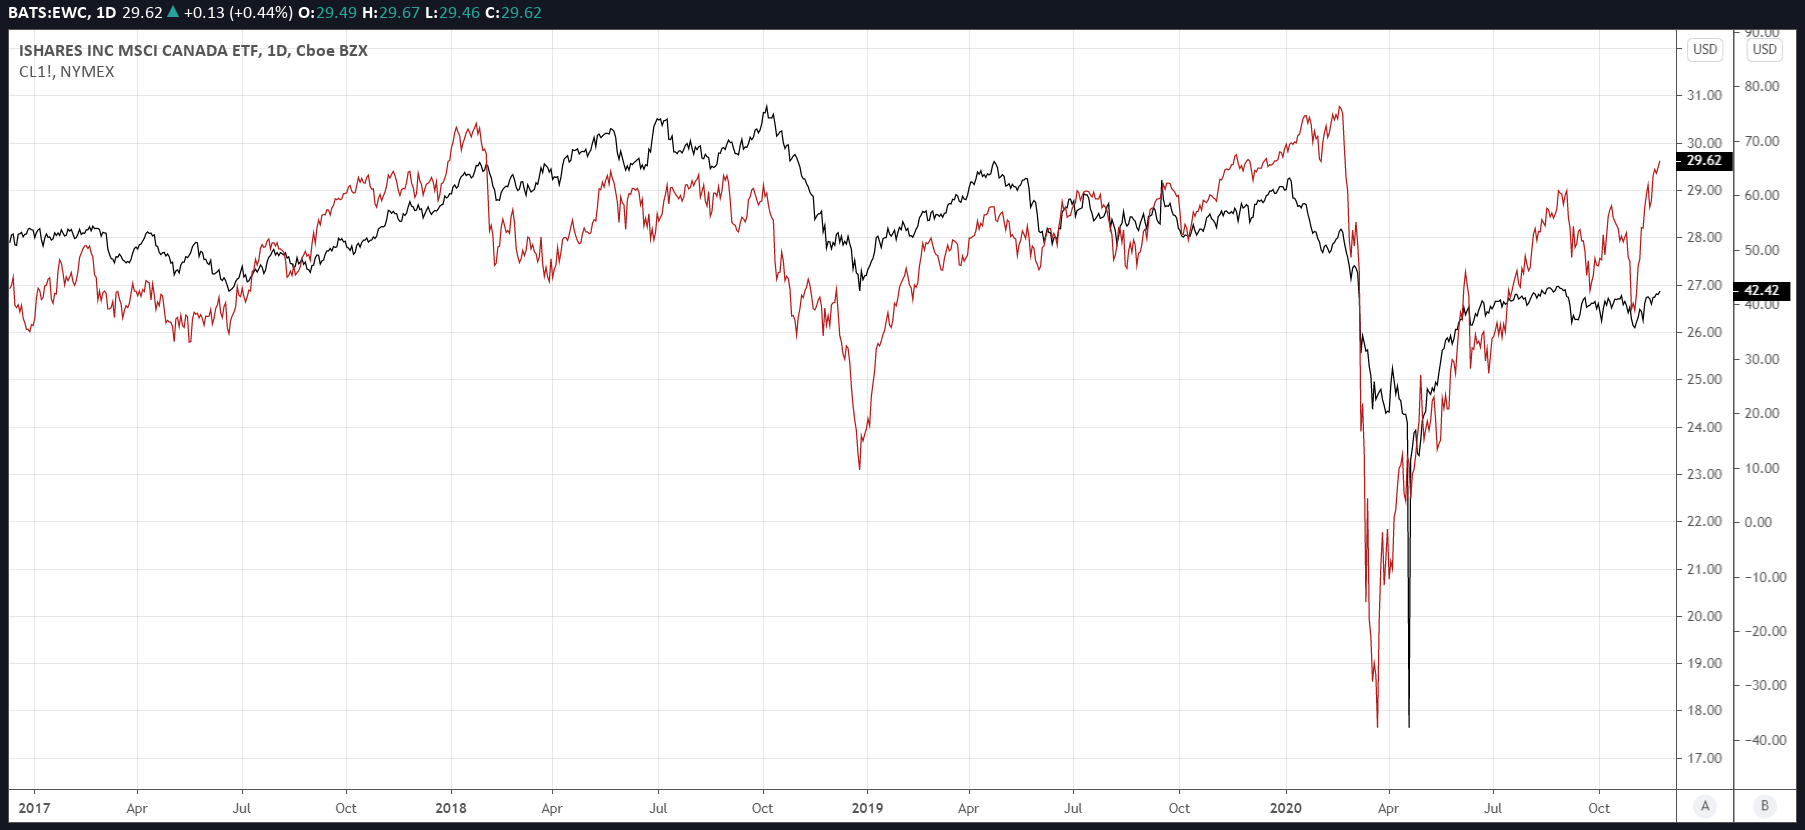 (Source: TradingView. The same applies to price charts presented hereafter.)
While global oil prices are not the only important factor to EWC, the strong positive correlation is important to monitor, and it would appear that oil prices can sometimes serve as a leading indicator. For example, the crash in early 2020 (also shown in the chart above) in EWC proceeded from a drop in oil prices.
As noted, EWC has significant exposure to the Financials sector. Low interest rates across the developed world have eroded commercial bank profit margins. This has provided the broader sector with a fairly strong "headwind". In turn, this has helped to inhibit EWC upside. Nevertheless, recently euphoric responses across asset classes to vaccine developments from Pfizer and Moderna has strengthened banks, as markets have priced in stronger long-term government bond yields (i.e., there is renewed hope in long-term rate hikes). Another correlator with EWC is, therefore, the 10-year Canadian bond yield (as shown below).
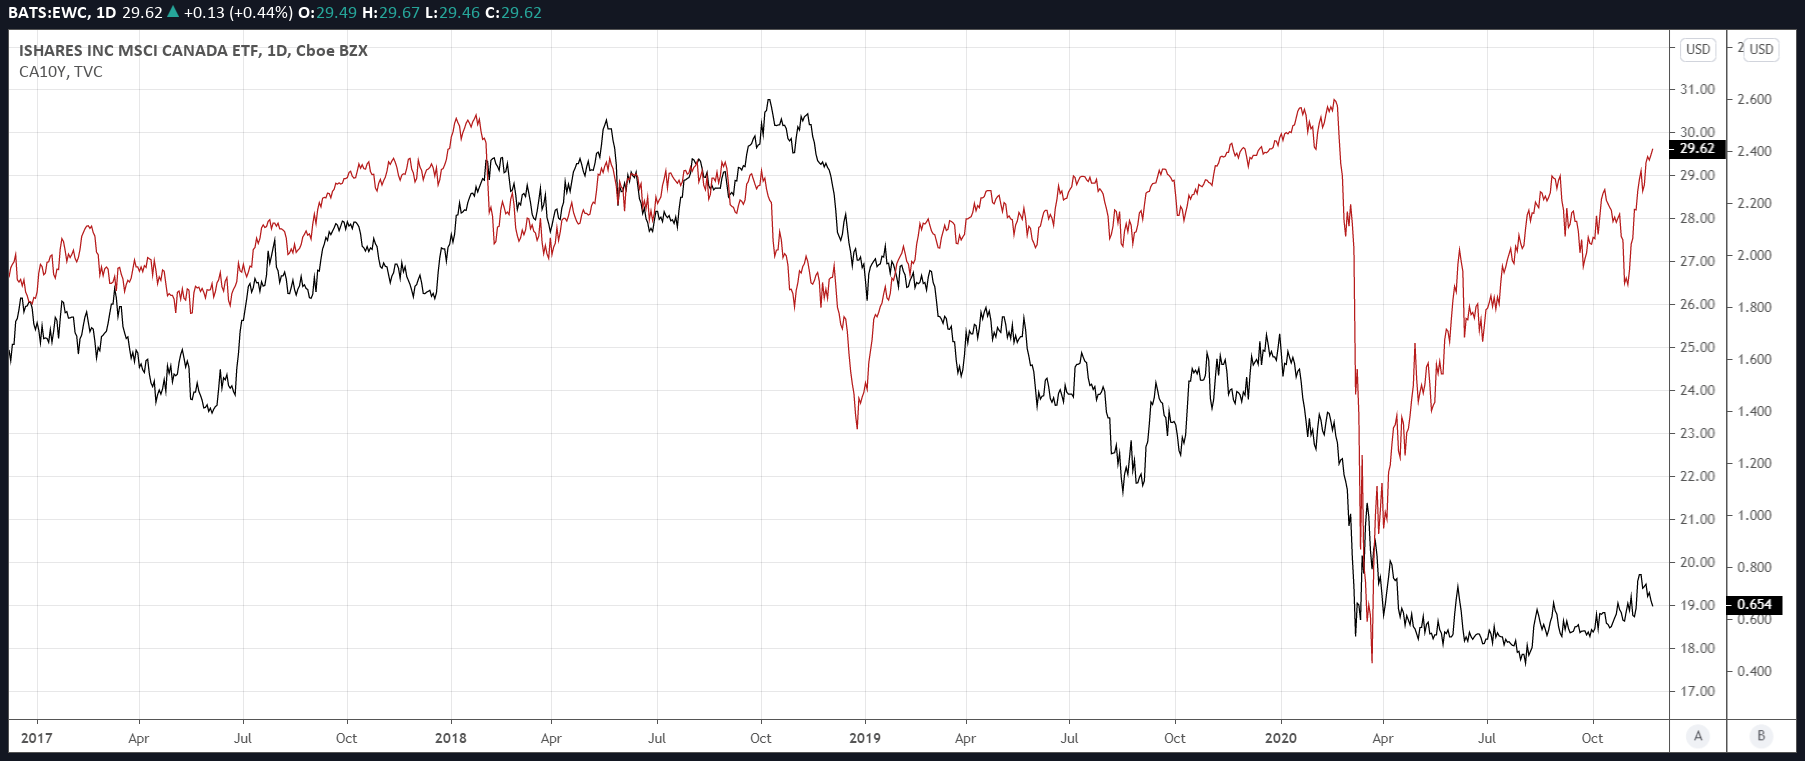 As with oil prices, it would appear that the 10-year Canadian bond yield may serve as a leading indicator. While stocks (including the EWC ETF) have rallied recently, the Canadian 10-year has risen more recently (i.e., the yield has fallen). This provides me with a strong suspicion that EWC will struggle to sustain its most recent upside, and this might apply more broadly against other indexes (even in the United States and abroad). The bond market is thought to be one of the "smarter" markets, more conservative than the equity markets, and as such, I would look to these tightened yields (after the recent rise) as a warning indicator. This is however not necessarily specific to EWC.
If yields can firm up, and preferably continue to rise, EWC could see further upside. However, it would look like it has already overshot, so to me, this prospect does not present as particularly bullish. Naturally, with yields much lower than they were in previous years, the positive correlation is less clear. However, yields will still remain relevant going forward (directionally speaking). This brings me back to the exposure of EWC to Financials, which might not be "all that bad", once a new business cycle asserts itself.
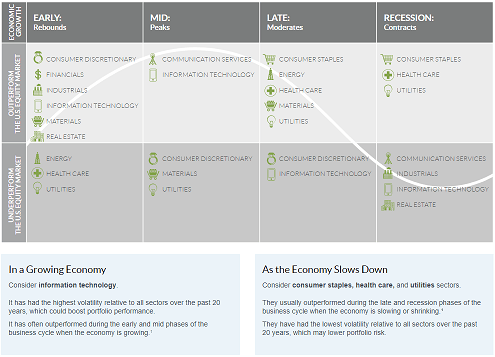
We are currently no doubt in a recessionary environment. Nevertheless, once a new business cycle establishes itself (at least in North America), it is often the Financials sector that outperforms. Higher interest rates and less bad debts, with still-low deposit rates, is constructive for banks. Asset management firms also benefit from rising equity prices and risk-on activity. This is supported by Fidelity International, which has conducted a lot of research in this space of investing in accordance with the business cycle. The chart below from Fidelity shows that sectors including Financials, Industrials, and Information Technology, Materials (among others) tend to out-perform early on in the business cycle. These are four of five of EWC's top sector exposures.
 (Source: Fidelity)
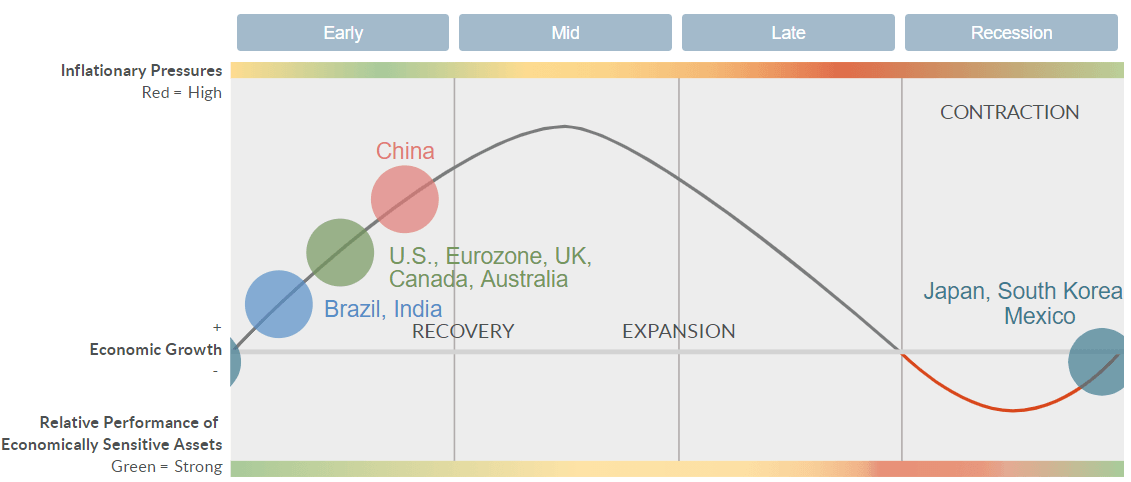
What's more, it is natural for a country (including Canada) to perform well (in equity markets) from the early stage of the business cycle as opposed to the late-stage or recessionary stage. Fidelity publishes business cycle updates for numerous countries; the chart below illustrates Canada's position is in the early stage alongside the United States and others.
 (Source: Fidelity)
In other words, EWC is a reasonably perfect fit for an early-stage comeback. However, global oil prices and yields remain constrained, and history does not always repeat. These are factors that one should consider carefully before going "long Canada". Still, if history rhymes, EWC looks interesting.
The exchange rate is another factor and another correlator. I recently examined Mexican equities through the lens of iShares MSCI Mexico ETF (EWW). I noticed that EWW was, in some respects, a derivative trade on the value of the Mexican peso in terms of U.S. dollars. When USD/MXN falls, EWW is much more likely to rise. In other words, EWW (the investment vehicle for Mexican equities) rises in value when the peso rises in value and vice versa. If the same relationship holds between USD/CAD and EWC, we would expect a similar inverse correlation between them, and we would also naturally then need to monitor CAD from the perspective of the U.S. dollar.
The chart below maps EWC against the USD/CAD exchange rate from the start of 2017. The correlation does indeed look negative.
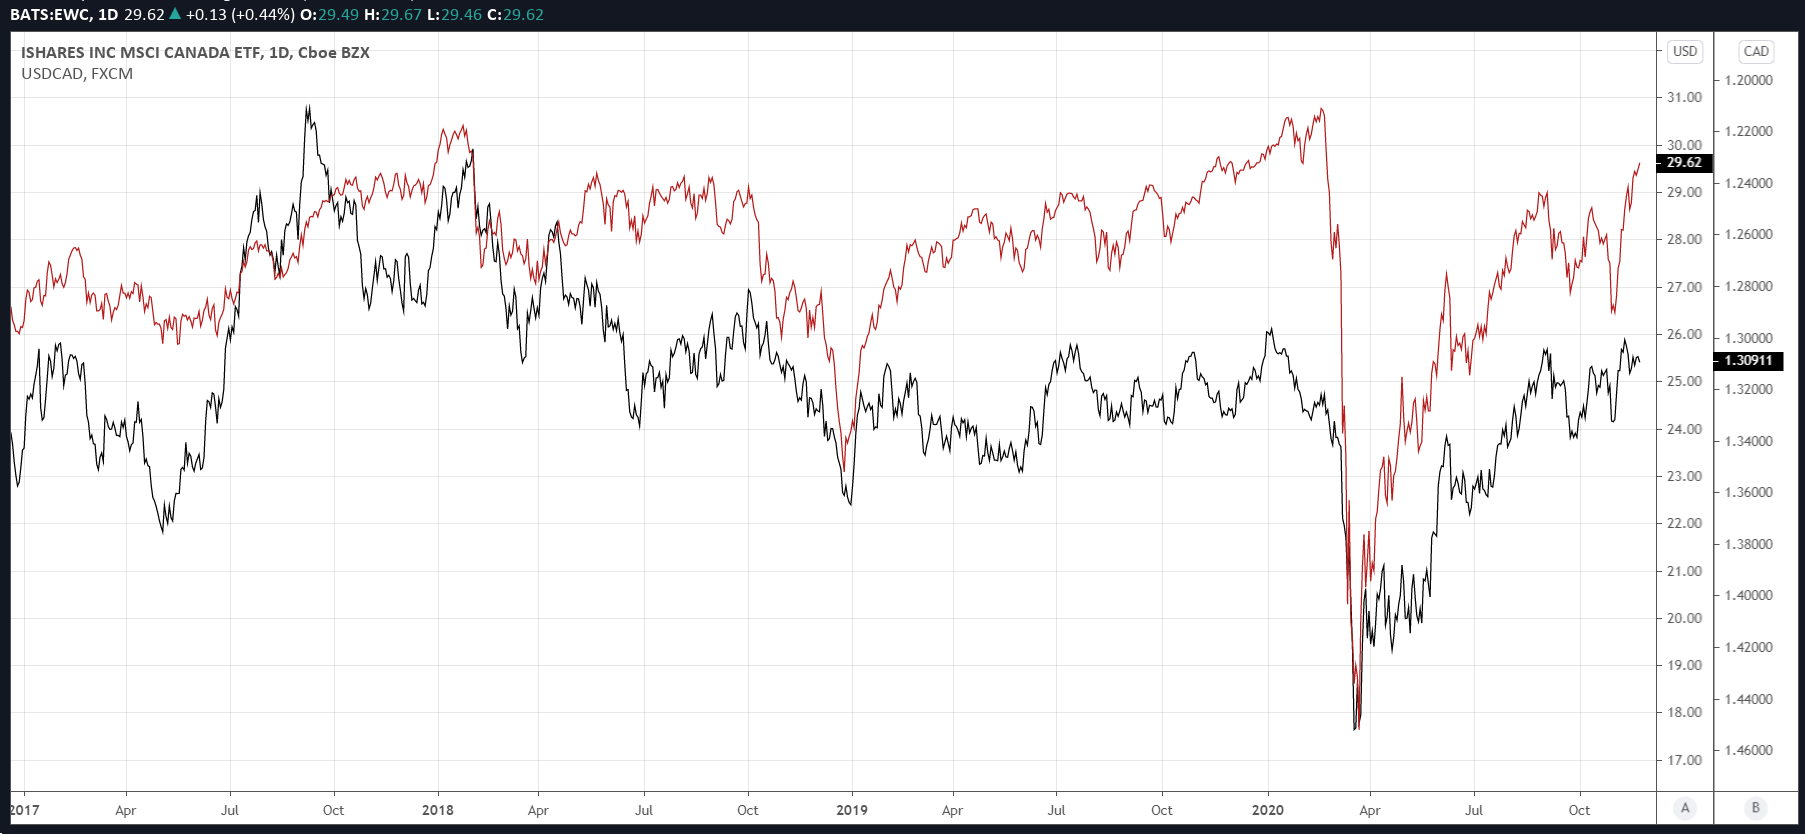
 To make this clearer, I invert the far-right y-axis (i.e., USD/CAD) to place more focus on the positive correlation between EWC and CAD (or CAD/USD, to be specific).
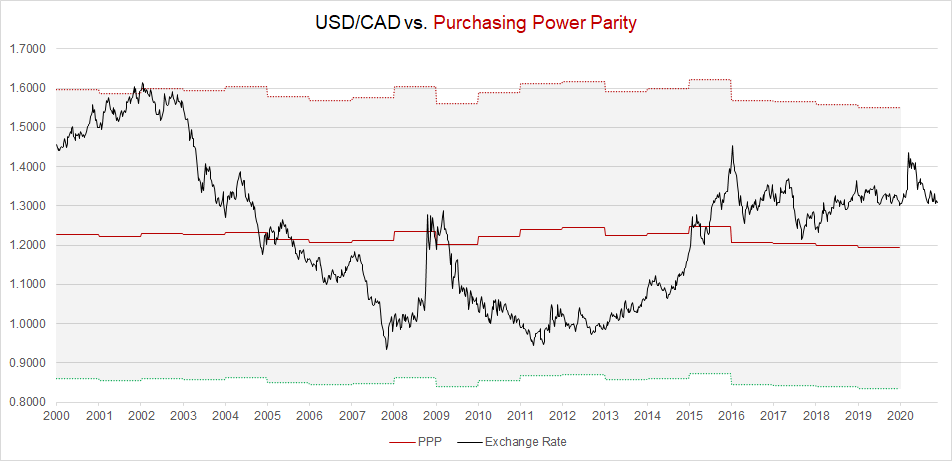
 The correlation is established. Therefore, where might USD/CAD be traveling next? Exchanges are tough to predict, but we can at least make a start by assessing USD/CAD in relation to its fair value as implied by the OECD's PPP model. PPP (Purchasing Power Parity) models enable us to find an implied fair value based on the relative international purchasing powers of different countries.
(Sources: Investing.com and OECD)
The chart above indicates that the most recent fair value estimate (for 2019) is still fairly significantly below the prevailing market price and that USD/CAD has historically been able to achieve both premiums and discounts to its fair value estimate. The 2019 fair value estimate is at 1.19. The upper and lower bands I have added to the chart above represent 30% deviations to the rolling annual PPP figure. Following the crash into 2008, USD rallied, but not too far beyond the fair value estimate. USD/CAD, after the initial rally, then fell back down below where the pair previously traded (prior to the rally in 2008/09).
I think we may see a similar repeat. USD/CAD is now trading back down below its 2020 rally high (at the 1.45 handle); it is now trading just below the 1.31 handle, as compared to the 2020 opening price just under the 1.30 handle. Further downside is still possible. It is however worth checking with an alternative model. The Economist's Big Mac Index is worth checking; it is based on a comparison of a largely homogenous product (in this case a McDonald's Big Mac). The beauty of the Big Mac Index stems from both its simplicity and its optional adjustment for GDP per capita, which enables us to get an adjusted figure based on differences in per capita output (countries with lower GDP per capita "should" price Big Macs at lower prices).
The standard Big Mac index suggests USD/CAD is undervalued 11% on a raw index basis (as compared to our OECD model of about 10%). The GDP-adjusted assessment indicates that CAD is in fact overvalued by 2%.
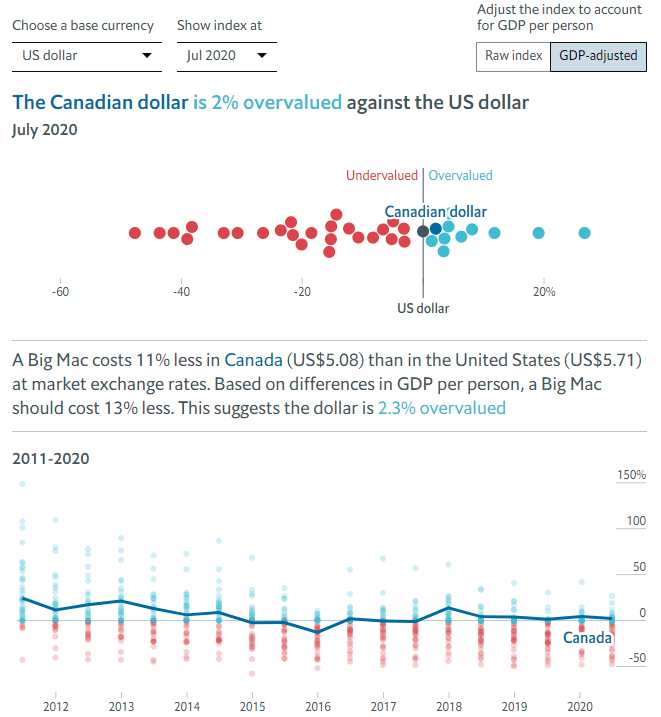 (Source: The Economist)
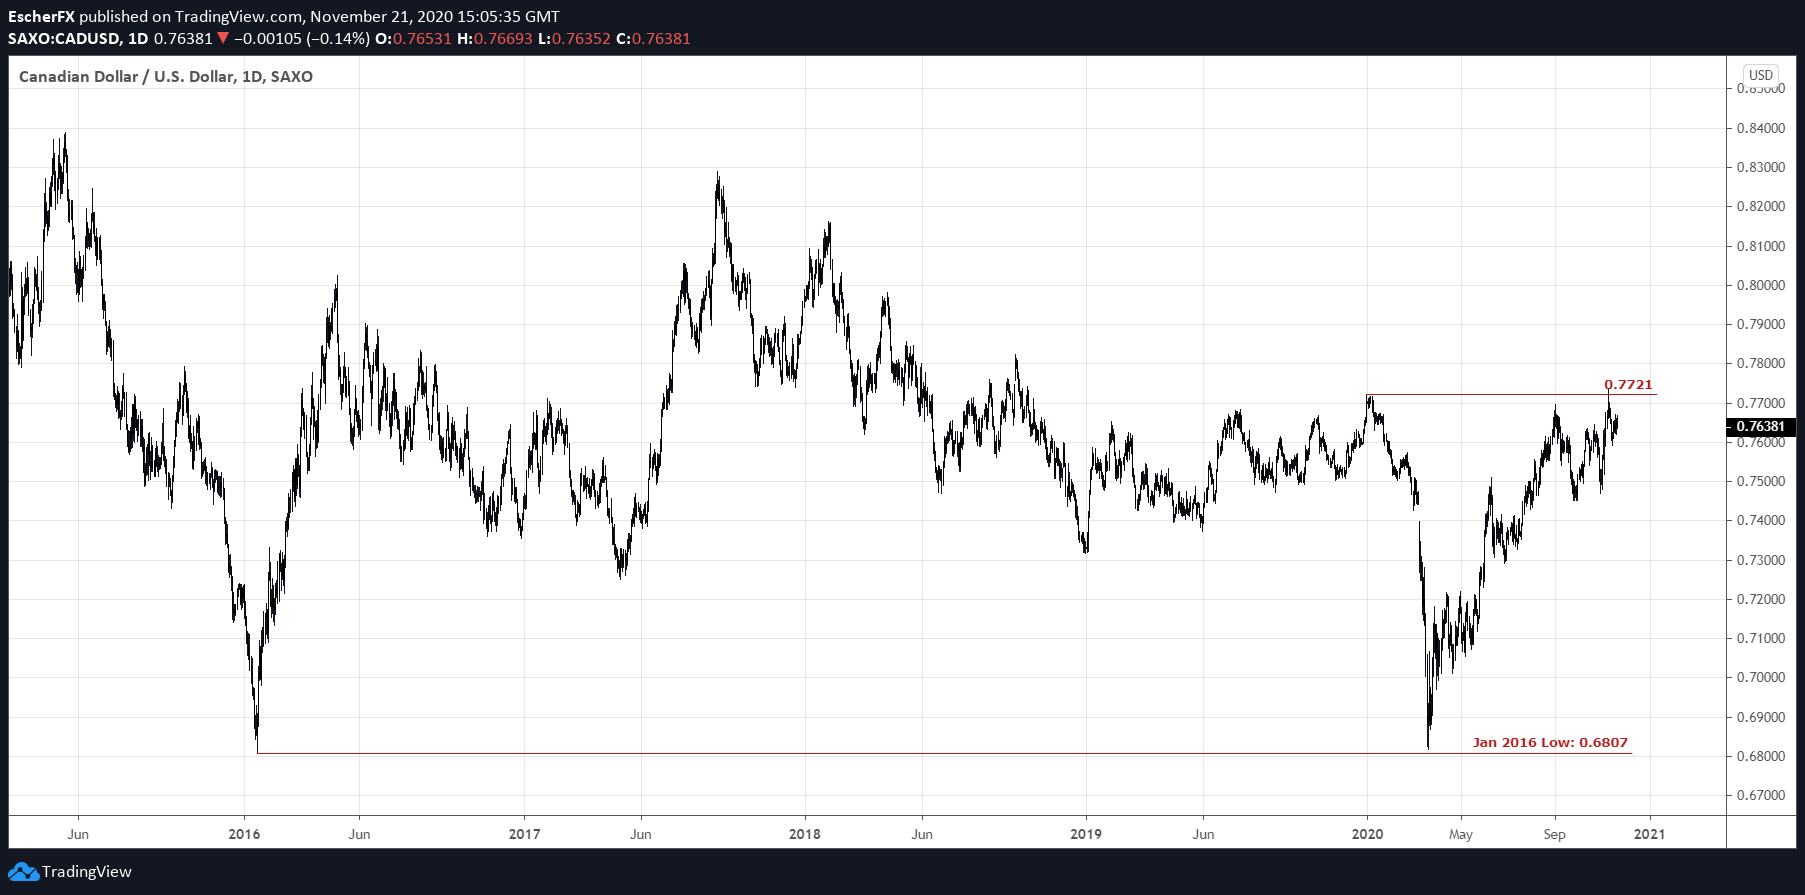
In other words, USD/CAD is probably very close to fair value, but the current direction would probably support a stronger Canadian dollar. Perhaps at the very least, we might be able to feel "safe" from significant FX volatility. For EWC holders, the worst outcome would be for USD/CAD to rally aggressively, as it did earlier this year (before falling back down). Put another way, CAD/USD will need to remain at least steady for most EWC holders whose purchasing power is expressed in USD. The chart below indicates that CAD/USD recently almost hit the January 2016 low of 0.6807, but has since clipped its "pre-COVID" high of 0.7721.
 I do not personally see a long-term bear market in the Canadian dollar, especially if we can look to the possibility of an economic rebound (starting from the first phase of the next/current business cycle). For example, if we look back to our OECD PPP model chart, we notice that USD/CAD collapsed following the early 2000s, which was marked by a recessionary phase. While we should not expect a similarly dramatic fall, it is possible that CAD's prospects are starting to look rosier going forward.
EWC is one fund that affords investors the opportunity for direct exposure to Canadian equities, and I think that Canadian equities are worth considering at this juncture, as a long-term investment. Canada deserves some allocation in a wider portfolio. However, in light of low rates and tepid oil prices, a non-aggressive approach should be taken in any case.
Disclosure: I/we have no positions in any stocks mentioned, and no plans to initiate any positions within the next 72 hours. I wrote this article myself, and it expresses my own opinions. I am not receiving compensation for it (other than from Seeking Alpha). I have no business relationship with any company whose stock is mentioned in this article.
