CVS Health: The Numbers Simply Don't Add Up

As a dominant player along the pharmacy value chain, CVS has proven to be a resilient EVA generator through thick and thin.
The company is making good progress in integrating Aetna, meaning that shareholder distributions have ample room to grow in the future.
We believe CVS is deeply undervalued, providing one of the most compelling total return potentials in this market environment.
Written by the FALCON Team
Introduction
Adjacent to our initial coverage of CVS Health (CVS), we decided to readdress the company with a pronounced focus on valuation, relying on the EVA (Economic Value Added) framework. In pursuit of maximizing total returns, two segments of the stock universe are of exceptional importance, which we simply refer to as "EVA Monsters" and "Fallen Angels", as illustrated below.
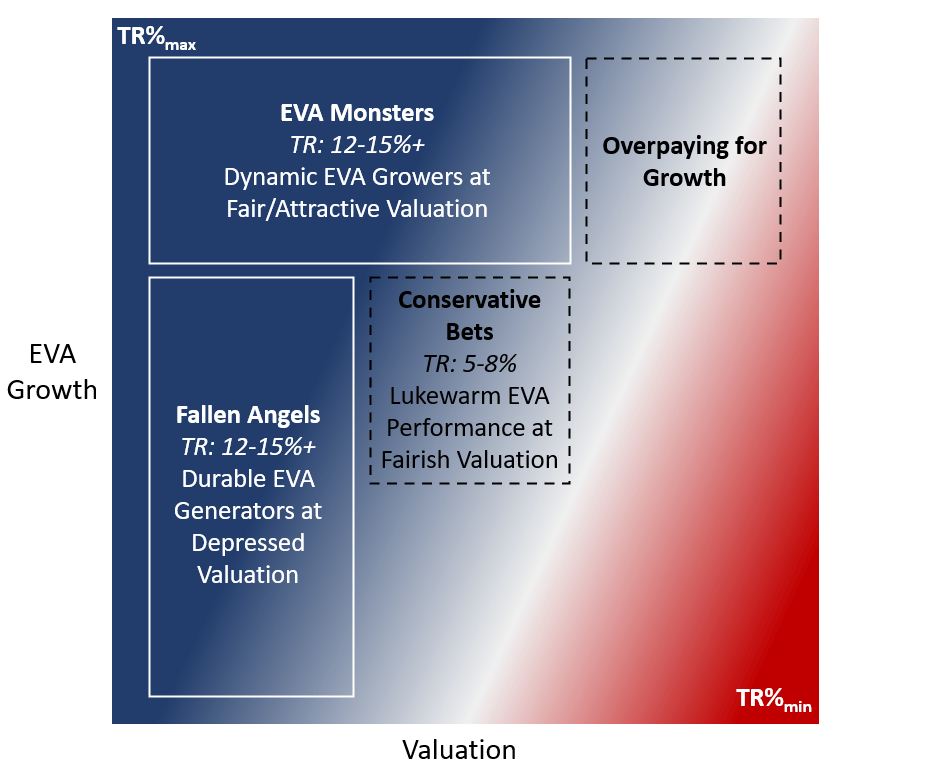
Image Source: Author's Illustration
The fundamental return of every stock (excluding the effect of valuation) is composed of:
Fundamental Return = EVA CAGR + dividend yield + share count reduction
In the case of the aforementioned two categories, the composition of fundamental return is very different:
"EVA Monsters": These are high EVA-growth companies, where the majority of our fundamental return stems from future growth in EVA. Some of these companies are major repurchasers of their shares and most pay no dividends since they have wonderful reinvestment opportunities.
"Fallen Angels": These are mature businesses that have stable EVA generation capability but lackluster growth. Most have a sizable dividend payout, potentially enhanced by share repurchases.
While both types of investments can yield handsome results, it is readily apparent that "EVA Monsters" have a higher fundamental return than "Fallen Angels", because they possess much better growth characteristics. Why is fundamental return important? Because the longer you hold a stock, the closer your return will get to this fundamental return. In short: when our aim is to hold a stock for decades, we want "EVA Monsters" in our portfolio.
Once we laid this foundation, we can introduce valuation as the last missing piece of the equation. Let's see the full investment thesis behind both groups:
Total Return = Fundamental Return + Change in Valuation
In the case of "Fallen Angels", sentiment change is the primary source of total return. Since reversion to the mean is a one-trick pony, the sooner it happens, the higher our annualized return. The most dangerous pitfall is that this reversion takes too long to happen (if at all), dampening our total return since there is no growth to compensate for the time elapsed. A company can offset some of the "waiting time" with a handsome dividend payout, assuming the dividend is sustainable and that the EVA generation is stable. Simply put: when we buy "Fallen Angels", we want a huge discount to fair value coupled with a short holding period, hoping for a quick rebound in valuation. Until then, we collect the dividends and when the reversion takes place, we sell at fair value (the sooner, the better). In a nutshell, we don't want to be stuck holding a "Fallen Angel" for too long, unless it turns into an EVA Monster along the way (which is rather unlikely but cannot be ruled out). Monitoring these positions closely is absolutely essential since some of them may turn out to be value traps while others may transform into EVA Monsters.
When it comes to "EVA Monsters", we want to buy companies that have lots of EVA growth left in the tank, at a reasonable entry price, and hold them for the long-run. The primary pitfalls are that we either overpay for growth or that the forecasted growth does not materialize to the extent we expected. Both scenarios would sink our total return potential. Thus, we have to leave a buffer in our purchase price in case some of the EVA growth we had anticipated does not materialize, which is painful in not one but two ways: the significantly dampened fundamental return, and the corresponding change in market sentiment (that affects the valuation component of the equation), to adjust for lower future growth.
Note that although the characteristics of these two baskets are largely different, both types of holdings can lead to exceptional, 12-15%+ annualized returns as part of a diversified portfolio. That being said, let's find out whether one of the most prominent "Fallen Angels", CVS Health (CVS) trades at an attractive valuation today.

So what's the story with CVS?
Although many would still associate CVS Health solely with its trademark drugstores, it has become a vertically integrated healthcare powerhouse, setting foot in all significant levels of the pharmacy value chain over the past years. The company's CVS Caremark brand (acquired in 2007) comprehends the nation's largest pharmacy benefit manager (with ~50% revenue contribution), where despite continuous regulatory pressure, the addressable market is expected to grow at a healthy rate going forward. However, the stock remains under pressure after Amazon (AMZN) revealed its long-awaited pharmacy-services offering, following its 2018 PillPack acquisition. This newborn competitive force could put pressure on CVS, primarily on its Retail Pharmacy segment (~33% of total revenue) which was already facing a secular decline due to decreasing brick-and-mortar foot traffic. As a consequence, CVS is heavily investing in its new "HealthHUB" store concept in order to provide easy-access medical services at its physical locations, while also administering COVID-19 tests by leveraging its existing infrastructure. Last but not least, CVS continues to actively reduce debt while also delivering on synergies in the Health Care Benefits segment (consisting of Aetna's health insurance business acquired in 2018), which is supposed to be the growth engine going forward. The company's recently announced CEO transition emphasizes the importance of the integrated insurance business in CVS's future, with Aetna's ex-CEO, Karen Lynch taking the helm.
Quality Snapshot
Value Creation: What type of moat rating is warranted?
We tend to prefer companies whose businesses are protected by large and enduring economic moats (no matter whether we are talking about an "EVA Monster" or a "Fallen Angel"), as buying those companies at the right price generally leads to outperformance, as outlined in our research article. In the EVA framework, the EVA Margin (EVA/Sales) will serve as our ratio to define a company's moat. A 5% EVA Margin can be used as an indicator for a "good" company, whereas the persistence of a 5%+ EVA Margin for 10 years makes a company great and thus "moaty".
CVS Health's profitability figures are far from exceptional, as the company's razor-thin EVA Margin levels (averaging 1.3% over the past decade) were pressured by the increased capital charge of the major 2018 Aetna deal. Since then, CVS began to effectively monetize the acquisition (while risks are not completely off the table yet), with its EVA fundamentals bouncing back to prior levels. Going forward, the Aetna deal will likely be accretive (due to the decent profitability of the added insurance business), thus CVS Health's EVA Margin is forecasted to stabilize around the 2% mark. The consistently positive EVA Margin over the past 15 years is a telltale sign of an existing competitive edge, thus a quantitative narrow-moat rating seems warranted for CVS at this point. As a vertically integrated retail chain, pharmacy benefit manager and insurer, CVS is characterized by significant scale-related cost advantages, giving it a competitive edge in each of its segments. Besides that, the company's PBM business profits from meaningful switching costs (and a resulting high retention rate) as an additional moat source, resting on long-term contracts with its clients. Therefore, a narrow moat rating is warranted for CVS from a qualitative standpoint as well.
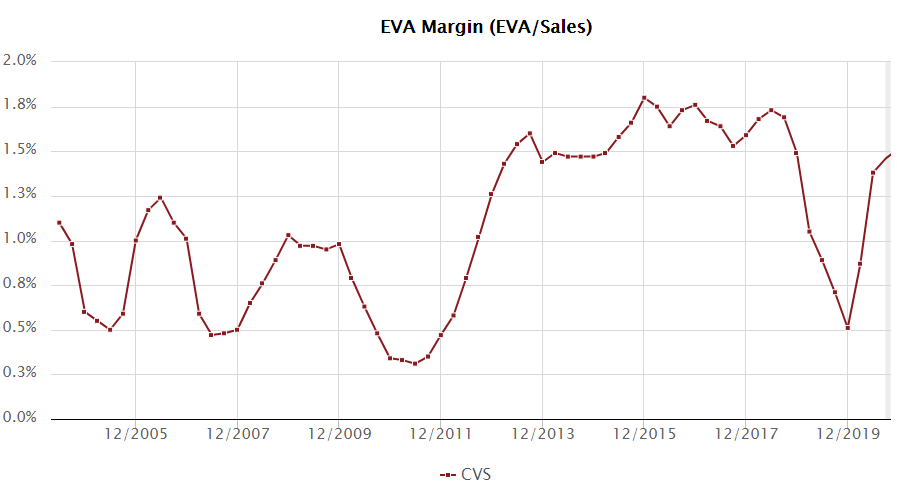 Source: evaexpress.com
Assessing incremental EVA returns
EVA Momentum measures the growth rate in EVA, scaled to the size of the business (measured by its sales). It is the EVA framework's equivalent for Return On Incremental Invested Capital or ROIIC. Any positive EVA Momentum is good because it means EVA has increased, and it is an indication that it is worthwhile to reinvest capital in the underlying business. Instead of pinpointing any single-year performance, we prefer to look at the long-term trailing averages in EVA Momentum. 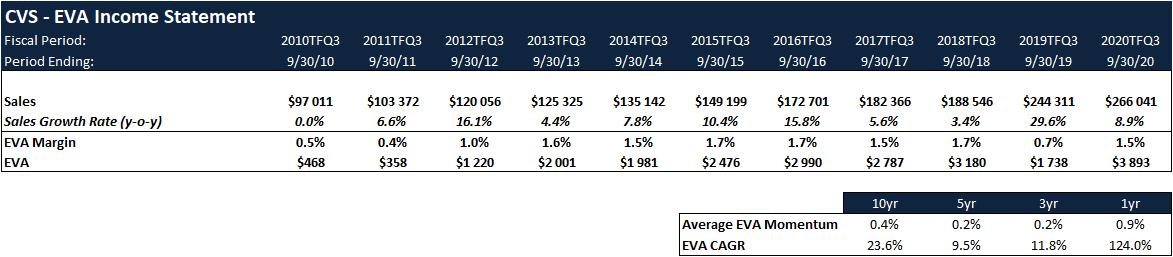
Source: Author's calculation based on data from evaexpress.com
Over the past decade, CVS has generated a mere 0.4% EVA Momentum on average (manifesting in improved profitability, coupled with growing sales), as the company successfully diversified away from its capital intensive, traditional retail business. To put that into perspective, the long-run average for the 50th percentile of the U.S. stock market (represented by the Russell 3000) has been 0.4%. Still, the small yet positive long-term EVA Momentum signals that in the case of CVS, every reinvested dollar leads to incremental EVA generation for the company's shareholders.
Capital Allocation Snapshot
After looking at the operations dimension, we continue investigating the company through the capital allocation lens. Remember, the incremental return on invested capital (measured by the EVA Momentum) is a crucial element when it comes to the assessment of successful capital allocation by management. If the company can earn a positive EVA by reinvesting all the cash generated by the underlying business, shareholders are better off if the firm retains most of its earnings. In the table below, we have dissected all the possible uses of cash for CVS over the past decade.
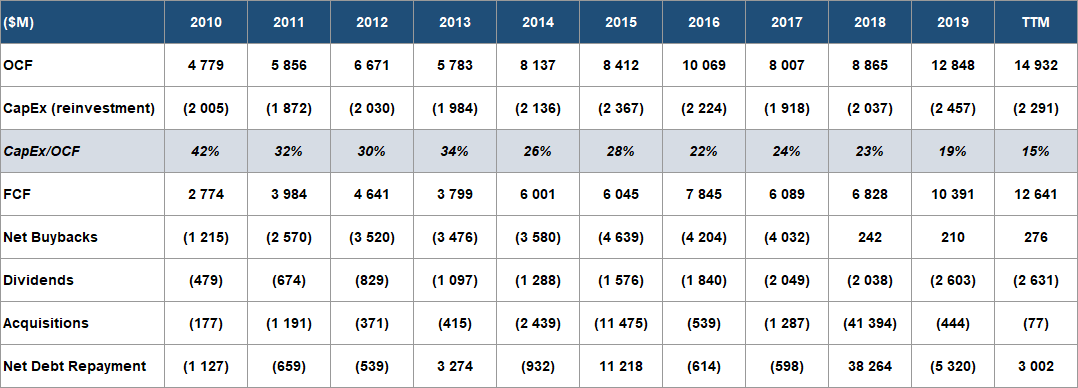
Source: Morningstar
CVS's operations require a relatively low level of reinvestment, with CapEx averaging ~27% of OCF over the last 10 years. Since the insurance and PBM businesses require significantly lower levels of capital spending than the traditional retail segment, the firm's capital intensity has decreased meaningfully in the past decade as the latter segment became a less significant contributor to CVS's earnings power. Remind yourselves that while an acquisition is not "officially" a part of CapEx in accounting terms, it is undoubtedly a form of growth capital expenditure, even though it does not appear on that particular line.
If there is one underwhelming aspect of CVS Health's capital allocation practice, that must be its streak of overpriced acquisitions over the past decade, the most significant of which has been its $78 billion deal for Aetna in 2018, adding a health insurance offering to its already diverse portfolio. Despite the clear strategic rationale, the purchase price was more than questionable. CVS took on substantial financial leverage, which resulted in a downgrade of its credit rating by all agencies, and severely limited capital allocation possibilities until its leverage target is reached. That said, improving EVA fundamentals underscore that this deal has begun to pay off after CVS made great progress on the integration front during the last few quarters.
Regarding capital distributions, after a history of uninterrupted payouts since 1997 and a decade-long increase streak through 2017, the company's management announced freezing the dividend following the Aetna acquisition until CVS achieved its deleveraging targets. Beyond 2022, a potential return of dynamic dividend growth is likely in the cards, as there will be a considerable amount of room to increase distributions to shareholders.
CVS was a significant repurchaser of its own shares (although the repurchase activity was rather automatic and could have been more opportunistic), up until the Aetna deal in 2018 which led to a huge pile of newly issued debt, straining the financial resources of the company and resulting in the complete halt of the repurchase program. Once leverage ratios fall near the desired threshold of 3X adjusted debt to EBITDA (which management expects to happen by 2022), the company plans to continue buybacks on a regular basis.
That being said, in order to remain on the conservative side (and reflect the uncertainty brought about by Amazon's disruptive threat to CVS's retail pharmacy operations), in our valuation scenarios, we assume share buybacks and dividend increases to remain on hold for the next 5 years.
Valuation
Discounted EVA Model
Although definitely a far cry from a precise tool, a discounted EVA model can be useful as a "vaguely right" (rather than a "precisely wrong") indicator of the fair value of a company. It is especially effective in extreme cases when the share price and the fundamental performance of the underlying business are largely disconnected from each other.
The reason why we use EVA instead of free cash flow in our valuation model is because EVA better matches costs and benefits, making it a superior measure of corporate performance. It spreads the charge for using capital over the time periods when the investments are expected to contribute to profit and add to the value, instead of concentrating the charge for capital in the one period that the investment is made, as cash flow does. In other words, free cash flow can be negative (caused by large CapEx figures) even if a firm is creating shareholder value, but EVA shows the underlying truth. That being said, the present value of a forecast for EVA is always mathematically identical to the net present value of discounted cash flow.
Note that we are not trying to calculate precise values, as that is an almost impossible endeavor, given the model's pronounced sensitivity to a plethora of assumptions. For every company we analyze, we compute a "conservative" and an "enterprising" scenario and use those as proxies for our fair value range. In the table below, you can see the consensus EVA estimates through 2025 for CVS. 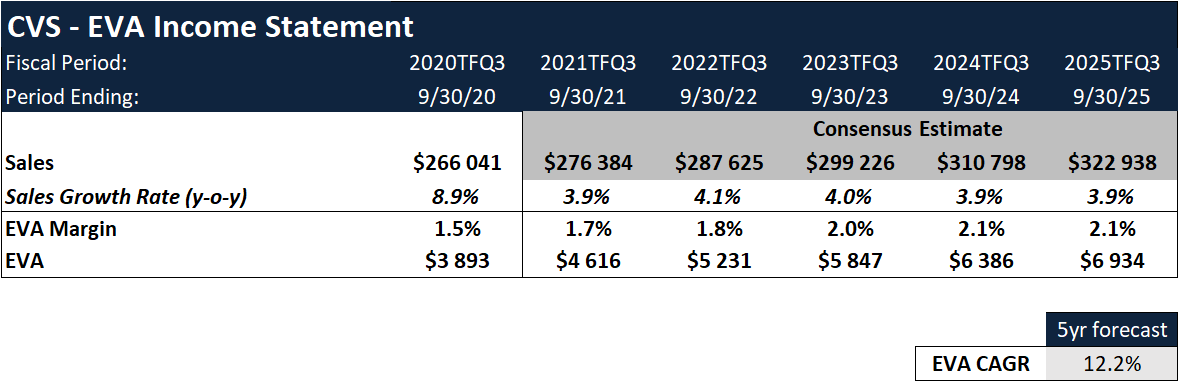
Source: Author's calculation based on data from evaexpress.com
As opposed to the 5-year consensus EVA CAGR estimate of 12.2%, our conservative scenario assumes zero EVA growth in the period of 2021-2030. Note that this doom-and-gloom forecast assumes no sales growth, along with the company failing to achieve further expansion on the EVA Margin front. We assume a terminal growth rate of 0% since no company can forever increase its EVA, as opposed to free cash flow, EBITDA, earnings, or any other conventional accounting measure. That is because the number of additional projects where a firm can outearn its true cost of capital (hence increase EVA) is always finite. As a discount rate, we use CVS's 5-year average weighted average cost of capital of 5.14%. The resulting conservative fair value estimate arrives at $120. 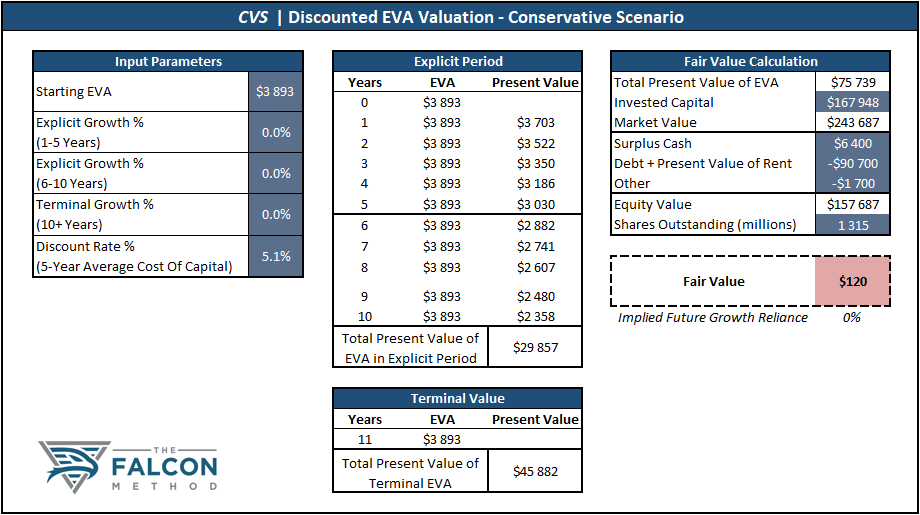
Source: Author's calculation based on data from evaexpress.com
Turning to our enterprising scenario, we project an annualized EVA growth of 6% in the period of 2021-2025 (still 50% lower than the consensus forecast) as the integration of Aetna is expected to be accretive to the EVA Margin. After that period, we assume that the company can maintain a 3% EVA growth rate in 2026-2030, which could be achieved by sales growth only, without the need for any further EVA Margin expansion. The resulting enterprising fair value estimate arrives at $146.
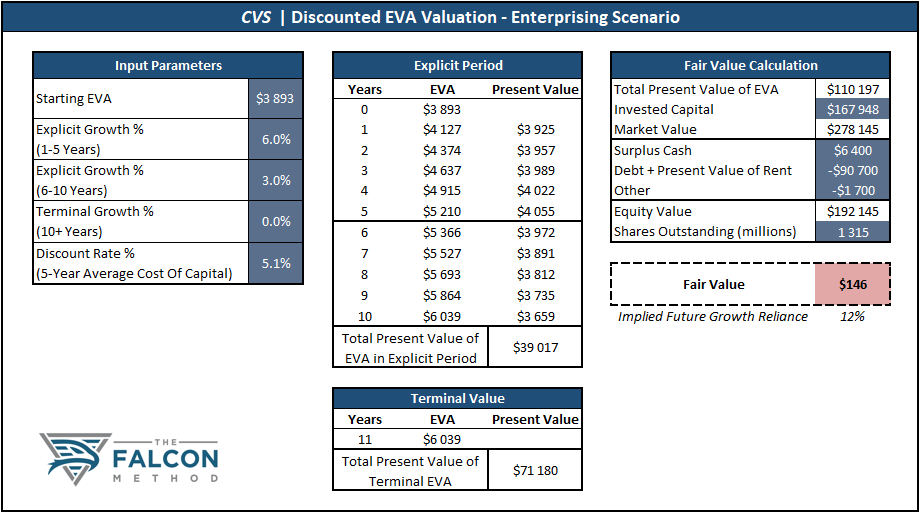
Source: Author's calculation based on data from evaexpress.com
Total Return Forecast
When calculating a stock's total return potential from any given price, we employ the 5-year explicit EVA forecast, our assumptions regarding the dividend and share buybacks, as well as a reasonable premium reflecting the growth characteristics of the underlying business. For the latter, our prime indicator in the EVA world is the Future Growth Reliance (FGR), which is the percent proportion of the firm's market value that is derived from, and depends on, growth in EVA. For example, an FGR ratio of 20% says that the firm's market value would tumble 20% if investors became convinced that it would never be able to increase EVA above its current level. A negative FGR ratio signals that the market is pricing in a decline from the current level of EVA generation, indicating an expectation for future headwinds. To sum up, a higher FGR ratio indicates higher expectations for future growth. 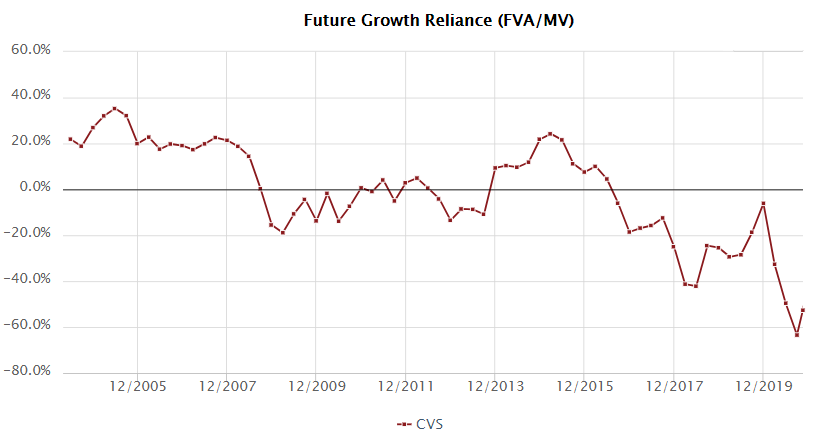
Source: evaexpress.com
In the last 10 years, CVS's FGR was hovering in the range of -40% to +20%, while the FGR is currently standing at an unprecedented -53% as of November 18, meaning that the market is pricing in significant future value destruction. While we believe the currently depressed scenario is completely detached from reality, we must note that the market has consistently valued CVS at a discount compared to its underlying EVA fundamentals over the past 5 years. To reflect this rather pessimistic sentiment, we model an FGR range of -20% to 0% in our total return scenario, implying that at best, the market finally gives credit to the company maintaining the current level of EVA generation. As outlined earlier, we are also factoring in a flat dividend and no share buybacks in the period to stay on the conservative side. We are using the consensus EVA estimates (as presented above) as a measure of fundamental performance. Based on these assumptions, our annual total return forecast from today's ~$67 level is the following (with the shaded band representing the FGR range of -20% to 0% around the midpoint value):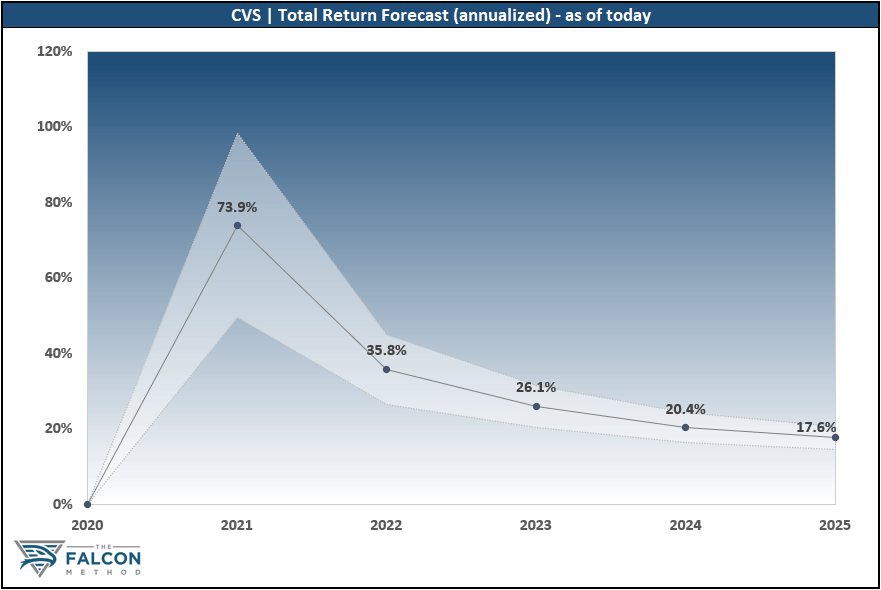
Source: Author's illustration based on data from evaexpress.com
As you can see on the graph, a realistic 5-year annualized total return falls in the ballpark of a mind-blowing ~17%, assuming that the market sentiment reverts back to a more normalized (yet still far from optimistic) state, representing an FGR range of -20% to 0%. The main risk of investing in "Fallen Angels" is that these types of companies usually have lackluster EVA growth, meaning that investors should not hold these stocks for the long-run. The reality is that in case it takes longer for the market to realize a company's true value than we have originally anticipated, we could end up with sobering results due to the lack of meaningful EVA growth. If valuation pops back in 2-3 years, we could achieve truly mesmerizing annualized returns, and the longer we have to wait, the more our annualized return drops (see the graph above). In short: we want a quick rebound in valuation, after which we sell near fair value. In the case of CVS, the market is incredibly pessimistic, pricing in literally no EVA generation in the future, let alone any growth in EVA. We view this as an extremely unlikely scenario, especially after seeing the gradual improvement of the Aetna integration. Signaling the drastic level of undervaluation, investors can buy CVS today near its economic book value, which stands at around $62.
Summary of the Investment Thesis
CVS Health represents a textbook example of the "Fallen Angel" category, showcasing a durable EVA generation capability, paired with rock-bottom valuation. With any investment we make, we have a minimum total return threshold of 12%, even after making conservative assumptions in our calculations. This leaves an additional layer of margin of safety since we would be happy with any double-digit return in the long-run. In the case of CVS, the fundamental performance of the business and the valuation dimension are so disconnected from each other, that the risk/reward ratio is heavily skewed in our favor. Thus, we believe the company provides a compelling buying opportunity at sub-$80 levels, from where a 12%+ total return potential is more than likely in the cards going forward. (Some of our analysts loaded up on the stock at a roughly $62 entry price.)
One more thing
If you liked this analysis and don't want to miss any of the upcoming articles by our evidence-based stock selection process exclusive for SA readers, please scroll up and click "Follow" to be notified of future releases.
Disclosure: I am/we are long CVS. I wrote this article myself, and it expresses my own opinions. I am not receiving compensation for it (other than from Seeking Alpha). I have no business relationship with any company whose stock is mentioned in this article.
