Q4 2020 Investment Style Ratings For ETFs And Mutual Funds

Our style ratings are based on the normalized aggregation of our fund ratings for every ETF and mutual fund in each style.
The primary driver behind an attractive fund rating is good portfolio management (stock picking) combined with low total annual costs.
In the fourth quarter of 2020, only the Large Cap Value, Large Cap Blend, and All Cap Value styles earn Attractive-or-better ratings.
At the beginning of the fourth quarter of 2020, only the Large Cap Value, Large Cap Blend, and All Cap Value styles earn Attractive-or-better ratings. Our style ratings are based on the normalized aggregation of our fund ratings for every ETF and mutual fund in each style. Our fund ratings are based on aggregations of the ratings of the stocks they hold. See last quarter’s Style Ratings here.
Investors looking for style funds that hold quality stocks should look no further than the Large Cap Value, Large Cap Blend, and All Cap Value styles. These styles house a large portion of the highest rated funds. Figures 4 through 7 provide more details. The primary driver behind an Attractive fund rating is good portfolio management, or good stock picking, with low total annual costs.
Attractive-or-better ratings do not always correlate with Attractive-or-better total annual costs. This fact underscores that (1) cheap funds can dupe investors and (2) investors should invest only in funds with good stocks and low fees.
See Figures 4 through 13 for a detailed breakdown of ratings distributions by investment style.
Figure 1: Ratings for All Investment Styles
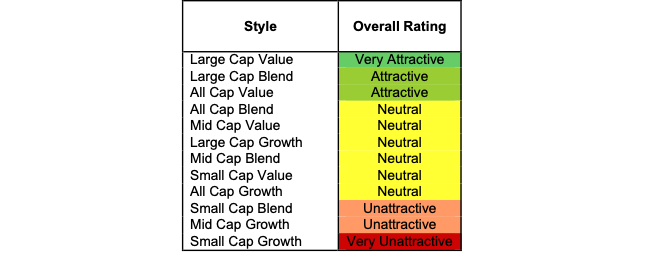
To earn an Attractive-or-better Predictive Rating, an ETF or mutual fund must have high-quality holdings and low costs. Only the top 30% of all ETFs and mutual funds earn our Attractive or better rating.
Ariel Investment Global Fund (AGLYX) is the top rated Large Cap Value fund. It gets our Very Attractive rating by allocating over 38% of its value to Attractive-or-better-rated stocks.
Dunham Small Cap Growth Fund (DADGX) is the worst rated Small Cap Growth fund. It gets our Very Unattractive rating by allocating over 53% of its value to Unattractive-or-worse-rated stocks. Making matters worse, it charges investors total annual costs of 5.55%.
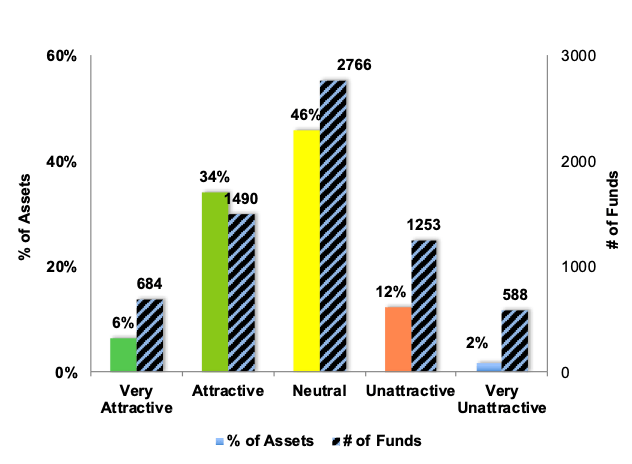
Figure 2 shows the distribution of our Predictive Ratings for all investment style ETFs and mutual funds.
Figure 2: Distribution of ETFs & Mutual Funds (Assets and Count) by Predictive Rating
 Source: New Constructs, LLC and company filings
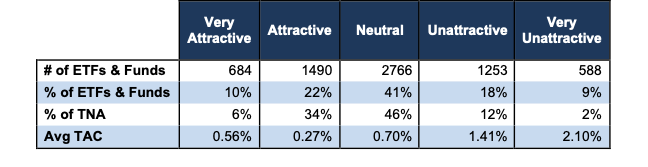
Figure 3 offers additional details on the quality of the investment style funds. Note that the average total annual cost of Very Unattractive funds is almost four times that of Very Attractive funds.
Figure 3: Predictive Rating Distribution Stats
Source: New Constructs, LLC and company filings
This table shows that only the best of the best funds get our Very Attractive Rating: they must hold good stocks AND have low costs. Investors deserve to have the best of both and we are here to give it to them.
Ratings by Investment Style
Figure 4 presents a mapping of Very Attractive funds by investment style. The chart shows the number of Very Attractive funds in each style and the percentage of assets allocated to Very Attractive-rated funds.
Figure 4: Very Attractive ETFs & Mutual Funds by Investment Style

Figure 5 presents the data charted in Figure 4.
Figure 5: Very Attractive ETFs & Mutual Funds by Investment Style
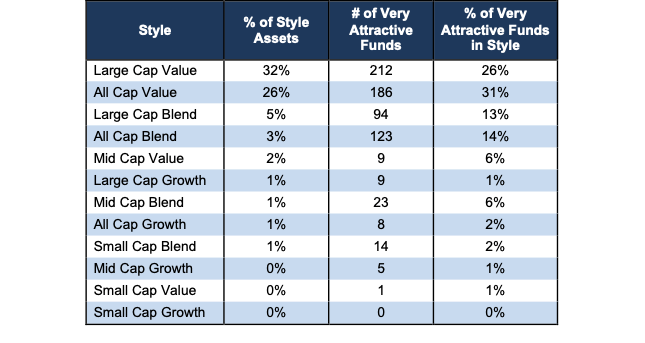
Figure 6 presents a mapping of Attractive funds by investment style. The chart shows the number of Attractive funds in each style and the percentage of assets allocated to Attractive-rated funds.
Figure 6: Attractive ETFs & Mutual Funds by Investment Style
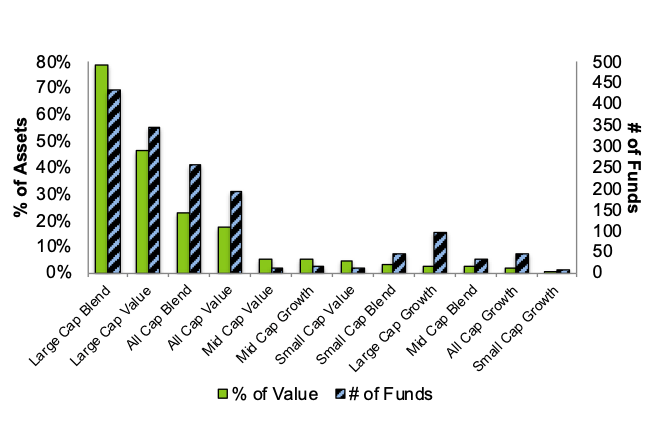
Figure 7 presents the data charted in Figure 6.
Figure 7: Attractive ETFs & Mutual Funds by Investment Style
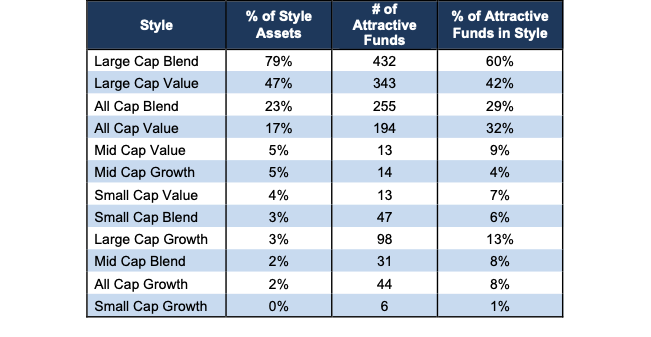
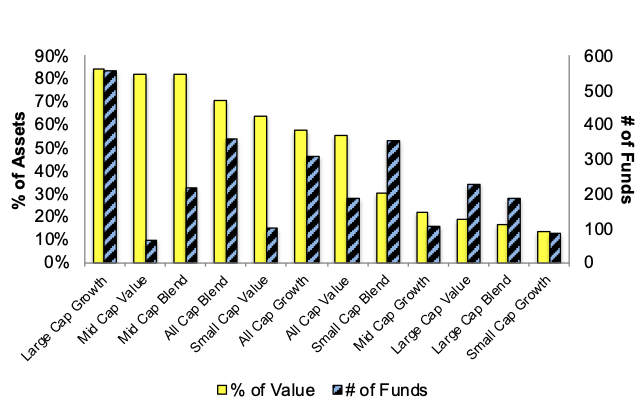
Figure 8 presents a mapping of Neutral funds by investment style. The chart shows the number of Neutral funds in each style and the percentage of assets allocated to Neutral-rated funds.
Figure 8: Neutral ETFs & Mutual Funds by Investment Style
 Source: New Constructs, LLC and company filings
Figure 9 presents the data charted in Figure 8.
Figure 9: Neutral ETFs & Mutual Funds by Investment Style
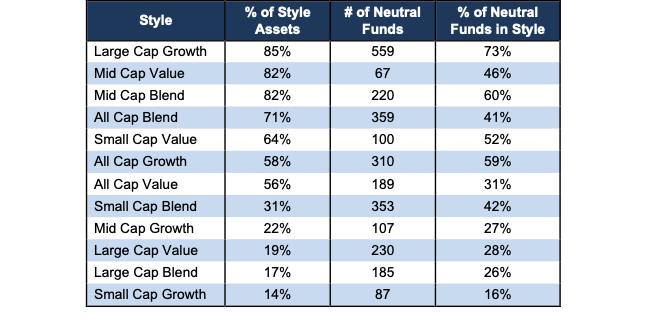
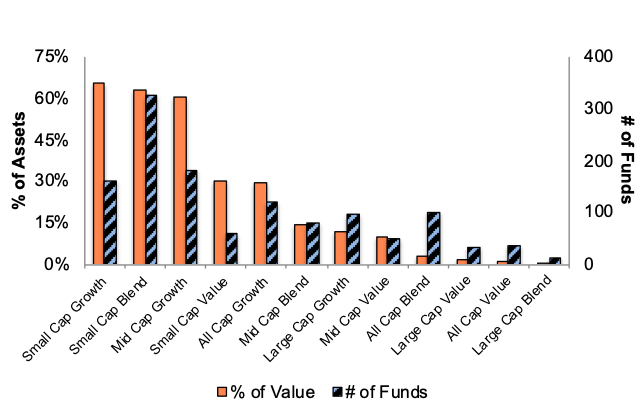
Figure 10 presents a mapping of Unattractive funds by investment style. The chart shows the number of Unattractive funds in each style and the percentage of assets allocated to Unattractive-rated funds.
The landscape of style ETFs and mutual funds is littered with Unattractive funds. Investors in Small Cap Growth have put over 65% of their assets in Unattractive-rated funds.
Figure 10: Unattractive ETFs & Mutual Funds by Investment Style
 Source: New Constructs, LLC and company filings
Figure 11 presents the data charted in Figure 10.
Figure 11: Unattractive ETFs & Mutual Funds by Investment Style
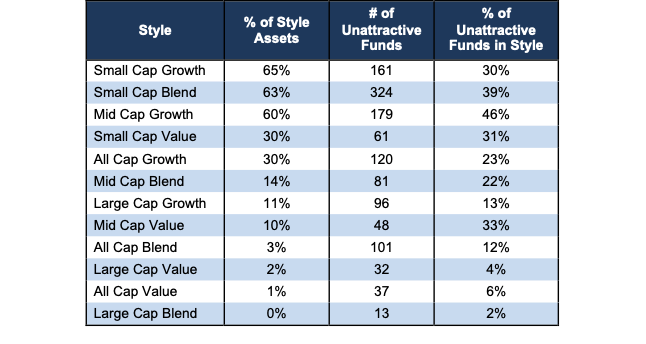
Figure 12 presents a mapping of Very Unattractive funds by investment style. The chart shows the number of Very Unattractive funds in each style and the percentage of assets allocated to Very Unattractive-rated funds.
Figure 12: Very Unattractive ETFs & Mutual Funds by Investment Style
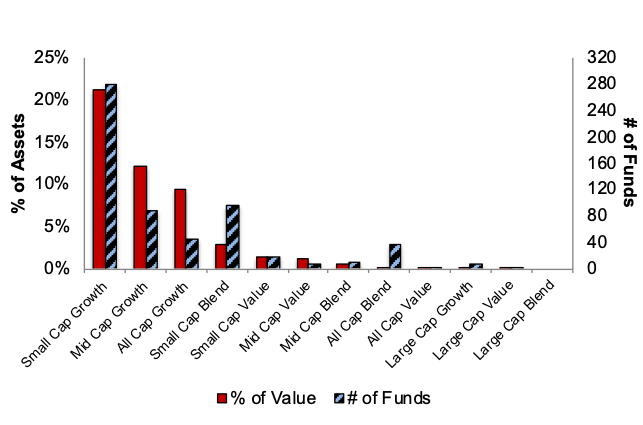
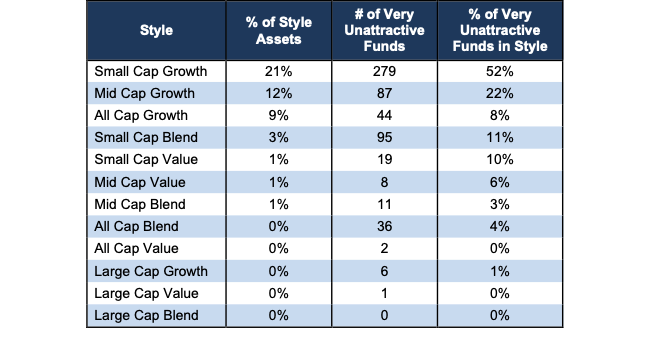
Figure 13 presents the data charted in Figure 12.
Figure 13: Very Unattractive ETFs & Mutual Funds by Investment Style
This article originally published on Oct. 19, 2020.
Disclosure: David Trainer, Kyle Guske II, and Matt Shuler receive no compensation to write about any specific stock, sector or theme.
Get our long and short/warning ideas. Access to top accounting and finance experts.
Deliverables:
1. Daily - long & short idea updates, forensic accounting insights, chat
2. Weekly - exclusive access to in-depth long & short ideas
3. Monthly - 40 large, 40 small cap ideas from the Most Attractive & Most Dangerous Stocks Model Portfolios
Disclosure: I/we have no positions in any stocks mentioned, and no plans to initiate any positions within the next 72 hours.
