Schwab U.S. Dividend Equity ETF: An Elaborate Cocktail Available At A Discount

A dividend ETF is a fruitful alternative to keeping money in the bank or having to screen individual stocks.
In this case, the Schwab U.S. Dividend Equity ETF is a low-cost dividend investment tool but delivers great performance when compared with peers.
Just as with any investment, there are risks and it is important for the investor to limit these through awareness when making a choice.
Beforehand, for investors used to growth stocks, it is important to make the case of a dividend ETF as an investment tool.
Dividend ETF as investment tool
While we are confined to our homes, waiting for the vaccine and dreaming about the next time we climb aboard a cruise ship, we can always put our money to work, more so bearing in mind that our children may not have the opportunities we enjoyed.
Now, there are various ways to monetize that hard-earned cash and in the current low interest rate environment with no yield out there in the bond market, stocks with dividends are popular with investors. Those who invest in stocks or ETFs also benefit from dividends. One way to achieve attractive returns is to stick with dividend stocks paying consistent yields.
In addition, the decision in favor of an ETF should never be made solely on the basis of expected dividends, but always against the background of personal financial circumstances and with the knowledge that stocks and equity ETFs are subject to strong price fluctuations. This is the reason that it's important to be choosy even if it means spending countless hours in the selection process.
This is especially true for those who have recently joined the ranks of value investing previously used to trading in high-growth tech stocks paying peanuts as dividends. In this case, the importance of dividends on returns can be shown by comparing the price performance of the Schwab U.S. Dividend Equity ETF (SCHD) and its total return level.
Figure 1: SCHD share price and total return performance.
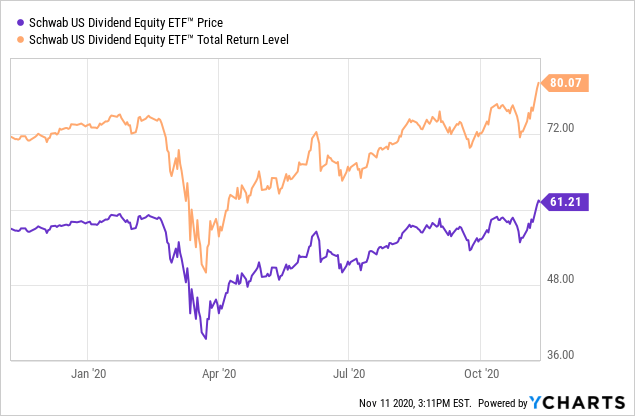 Data by YCharts
In this case, during the last one year, the SCHD total return delivered 80% performance compared to only 61% for the ETF alone. The reason is that the total return includes the effects on performance in case dividends are reinvested.
However, dividend ETFs are primarily about "dividends" for those who aim at cashing out the quarterly payments and performance only comes in second place. Hence, investors should look for ETFs offering increasing yields with time.
In order to make my point, I compare SCHD with two other dividend ETFs. First, I consider the iShares Select Dividend ETF (DVY) which I covered last week and second, the iShares Core High Dividend ETF (HDV), which is a low-fees dividend ETF just like SCHD.
Comparison with peers
The comparison reveals that dividend growth has been more significant for the Schwab ETF, at 57.48% for the last three years, outperforming DVY, the second contender by three times.
Furthermore, SCHD has appreciated by more than 27% compared to peers in terms of total returns thus already recovering from the market sell-off seen during the month of March.
Figure 2: Comparing SCHD with DVY in terms of total return and dividend growth.
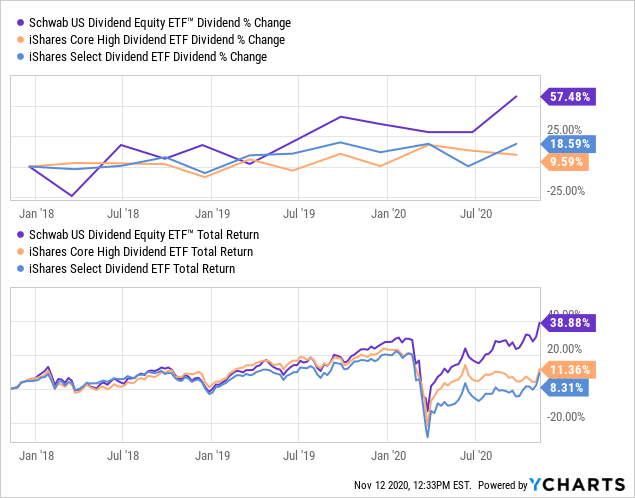 Data by YCharts
The reasons for this strong performance are to be found in the index which the ETF’s underlying fund tracks. For SCHD, its underlying fund tracks as closely as possible the total return of the Dow Jones U.S. Dividend 100 Index, excluding fees and expenses.
Now, the index is designed to measure the performance of high dividend- yielding stocks that have a record of consistently paying distributions to shareholders. These are also selected in view of their fundamental strength relative to peers, based on financial ratios.
I further verified SCHD's first 17 holdings in terms of consistency at paying dividends and fundamental strength at the balance sheet level.
Figure 3: Dividend payout ratio, years of growth and company’s Debt/Equity ratio.
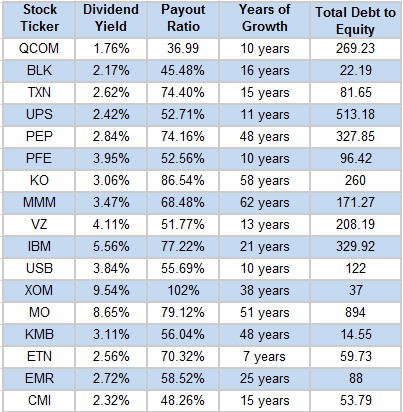
Source: Table built from data from SeekingAlpha.
Now, Exxon Mobil (XOM) which forms 3.36% of SCHD's holdings declined to raise its dividends this year, the first time it failed to do so since 1982. However, it maintained payment of dividend yields at 11% despite the current slump in demand of oil. Additionally, the company's credit ratings have suffered from a cut from AA+ but are still at a comfortable AA level as its debt levels are manageable.
Looking at other stocks, SCHD's underlying fund has given priority to stocks which do not necessarily pay the highest dividend yields in the market but exhibit more sustainability.
As for DVY, while the issuers also have the consistency metric in their screening mechanism and apply it when selecting stocks for inclusion as holdings, it is Schwab which seems to be more stringent in the selection process. Hence a quick screening of the first five stocks held by SCHD reveals that the payout ratios varies from 37% to 75%.
As a result, each of the stocks held by SCHD is making progressively higher distributions with time and this explains the ETF's rising dividend payments.
Thus, while it is DVY incepted 7 years earlier than the Schwab ETF which pays a higher dividend at 3.87%, SCHD is catching up and is already at 3.05% despite having started the race seven years later.
Another reason for the dividend growth progressing rapidly is that the fund managers at Schwab seem to be working harder for the money paid to them. In this case, SCHD has a portfolio turnover ratio of 24% signifying that its issuers replace nearly a quarter of investment holdings on a yearly basis. For iShares' DVY, the figure is 6%, which means that they effect four times less changes to their portfolio during a year.
While some investors may view this more passive strategy whereby minimal changes are brought to the portfolio with time as a sign of iShares’ fund managers confidence, this may not be justified in the current environment of uncertainty where faster adjustments seem to have become more of a norm.
Figure 4: Comparing the holdings.
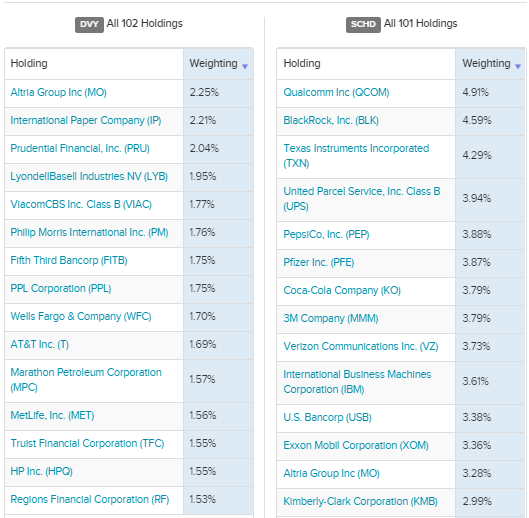
Source: etfdb.com
I continue with providing further insights as to the strength of SCHD's portfolio while being stringent on possible risks in this period of uncertainty.
Strengths and risk mitigation
For baby boomers, the economic pains resulting from the current health crisis will certainly reduce opportunities of a second chance in the aftermaths of a miscalculated investment decision. This calls for a meticulous analysis of capacity of underlying holdings to withstand adverse medium to long-term economic, social, and governance events.
For this purpose, one metric which is well-suited to measure market risks or volatility is beta. Beta analyzes an ETF’s sensitivity or daily up and down movements in relation to the broader market.
Now, a stock or an ETF with a beta of 1.0 moves in line with the overall market and this is good for traders looking for high intraday gains. On the other hand, for the passive investor, a low beta is better. Viewed from this angle, both DVY and SCHD have relatively high beta values of 0.91 and 0.94 respectively.
Still, SCHD does not include big techs which are subject to volatility as a result of investors rotating from growth to value stocks. Also, its holdings will not be in the limelight as a result of increased scrutiny from Congress on antitrust grounds after the change in tenant at the White House.
For this matter, the ETF has limited exposure to technology at 12% and includes International Business Machines (IBM) which is not as richly valued as some of the other tech stocks and does not face regulatory risks due to exploitation of customer data.
Figure 5: SCHD's holdings breakdown.
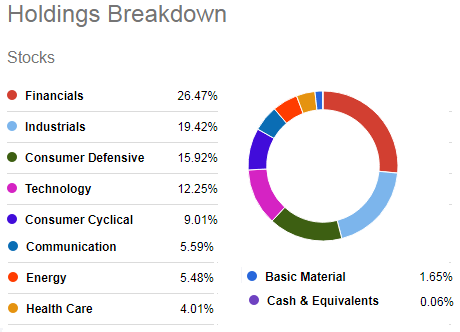
Source: Seeking Alpha
SCHD has more exposure to large caps (71.8%) and less to smaller ones at 5.4%, with the former category viewed as more likely to weather macroeconomic problems.
Taking the analysis at the sector level, SCHD includes a large portion of financials constituting 26% of its portfolio. Now, in contrast to the last economic downturn twelve years ago when investors dumped bank stocks, during this one financial institutions are highly regarded in their ability to provide liquidity to companies facing cash burns. Here, there has been end-to-end oversight by the U.S. central bank with Chairman Powell playing a vital role in confidence-building measures.
There is currently some uncertainty with the election transition period not being as usual and this may cause some downside in the stock market in the period running up to January next year.
However, with big semiconductor names as part of holdings like Qualcomm (NASDAQ: QCOM) and Texas Instruments (NASDAQ: TXN) at 4.9% and 4.3% of holdings respectively, SCHD has exposure to key innovative technology employing more than 250K people and the authorities are unlikely to embark on drastic action aimed at endangering the country’s position of strength in the semis.
Also, the fact that SCHD's strategy is to exclude REITs is a strong positive due to real estate plays especially those operating in the commercial sector being under pressure to prioritize on keeping healthy balance sheets, sometimes at the expense of dividend payments.
Figure 6: Comparing key metrics.
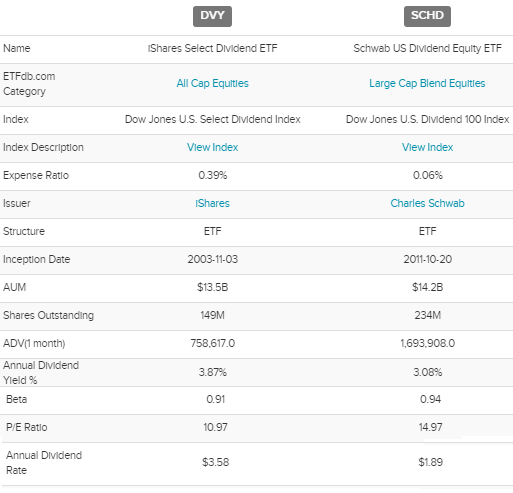
Source: etfdb.com
Finally, SCHD excludes MLPs (master limited partnerships) mostly operating in the oil and gas sector which also offer great distributions but are preferable to avoid for the time being.
Valuations and key takeaways
For investors who want to avoid the hassle of analyzing individual stocks, a dividend ETF is the solution to benefit from regular dividend distributions. Now, SCHD, just like any other equity ETF passes the dividends on to investors, either in the form of distributions in the investor's account or through reinvestment.
Either be it through reinvestment for capital appreciation or cashing out the quarterly dividends, SCHD is better and it also has a lower expense ratio of 0.06% meaning that the fund managers charge relatively less for their effort.
Also, an average of 1.7 million shares is traded each month which makes the ETF highly liquid.
Moreover, with investors looking to transition their portfolios from more of a growth orientation to becoming income-focused in an environment characterized by lowering of the federal funds rate to zero, interest in SCHD has grown considerably and its P/E now stands at 14.97.
Still, taking into consideration that some of the stocks it holds like Pfizer (PFE) and Verizon (VZ) are still trading at 13.92 and 12.54 price to earnings multiples respectively, there is room for further growth of the ETF's overall earnings. In this case, the pharma and mobile telco plays have massive potential to benefit from COVID-19 vaccines and 5G revenues respectively.
Therefore, with superior dividend growth and overall return, SCHD with its cocktail of high-performing stocks is a buy.
Disclosure: I/we have no positions in any stocks mentioned, but may initiate a long position in SCHD over the next 72 hours. I wrote this article myself, and it expresses my own opinions. I am not receiving compensation for it (other than from Seeking Alpha). I have no business relationship with any company whose stock is mentioned in this article.
Additional disclosure: This is an investment thesis and is intended for informational purposes. Investors are kindly requested to do additional research before investing.
