SPDR S&P Oil & Gas Equipment & Services ETF: Down For The Count

Oil and gas equipment and services segment has a 10-year annualized return of -20.5% per year.
Oil price collapse in 2020 has made matters even worse for the segment.
XES fund attempts to track the S&P Index.
It is an equal-weight index, not one based on market cap.
Oil rig trends and oil futures prices imply the downturn in the sector is not over.
Investors in the oil and gas equipment and services segment have lived through a never-ending downturn since 2014 when oil prices last peaked. The 10-year annualized return is -20.53%. Unfortunately, the oil price collapse of 2020 made matters even worse.
The graph below shows the performance of the S&P® Oil & Gas Equipment & Services Select Industry® Index (the "Index"), as compared to the S&P 500.
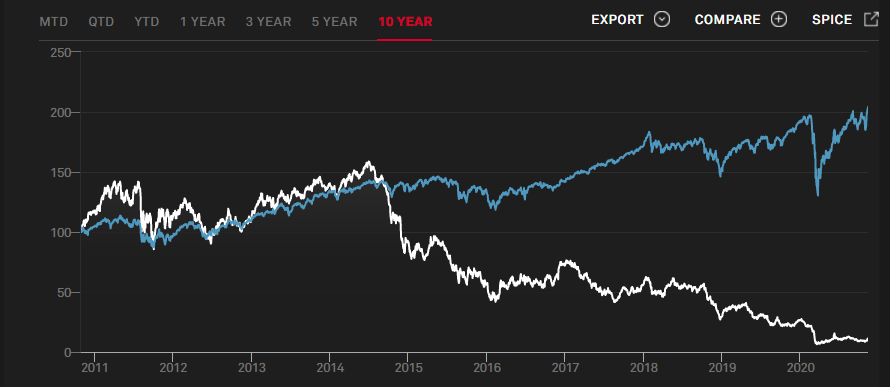
Source: SPGlobal.com
The Index
The Index consists of securities belonging to the Oil & Gas Drilling subindustry and the Oil & Gas Equipment & Services sub-industry that meet the following two criteria:
(i) have a float-adjusted market capitalization greater than or equal to $500 million with a float-adjusted liquidity ratio (defined by dollar value traded over the previous 12 months divided by the float-adjusted market capitalization as of the index rebalancing reference date) greater than or equal to 90% or have a float-adjusted market capitalization greater than or equal to $400 million with a float-adjusted liquidity ratio (as defined above) greater than or equal to 150%; and
(ii) are U.S.-based companies."
The Index Provider (S&P Dow Jones Indexes) determines the composition of the Index and the relative weightings of the securities in the Index. The Index is a modified, equal-weighted index. Using an equal weight index, as opposed to one which is weighted by market capitalization, reduces the risk exposure to the large companies because greater diversification is achieved.
The Index Top Holdings as of November 13, 2020, were:
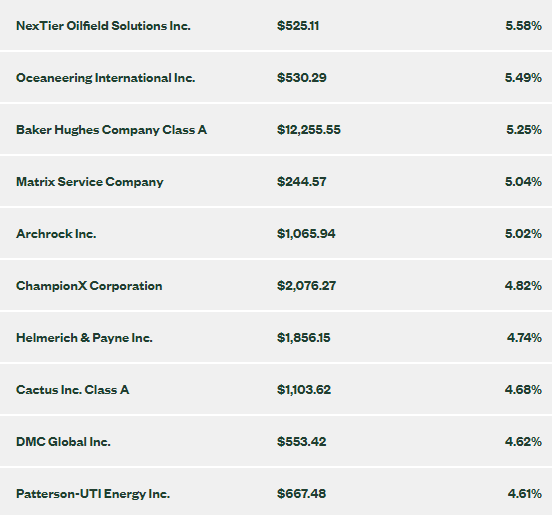
Source: SSGA.com
The Fund
It is not possible to invest directly in an index. State Street Global Advisors created an Exchange Traded Fund ("ETF") for which investors can invest, namely the SPDR® S&P Oil & Gas Equipment & Services ETF (the "Fund").
It is important to understand the objectives and mechanics of the Fund. The Fund's objective is to "mirror" the returns of the Index, excluding operating expenses and commissions. The total annual Fund operating expense is 0.35%.
The Fund is not required to purchase all of the securities in the Index. However, the weights of the top holdings of the Fund are almost identical to those in the Index, as shown below.
The Fund's Top Holdings as of November 13, 2020:
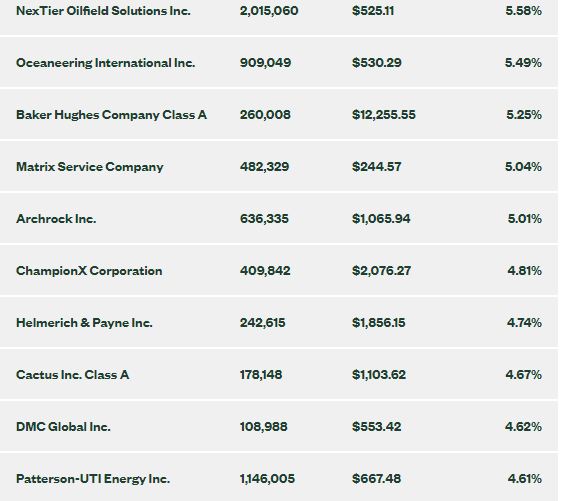 Source: SSGA.com
As with all investments, there is the risk of losing some or all of one's investment in the Fund. Past performance may not indicative of future results. The Fund has lost about 58 % in the year to date.
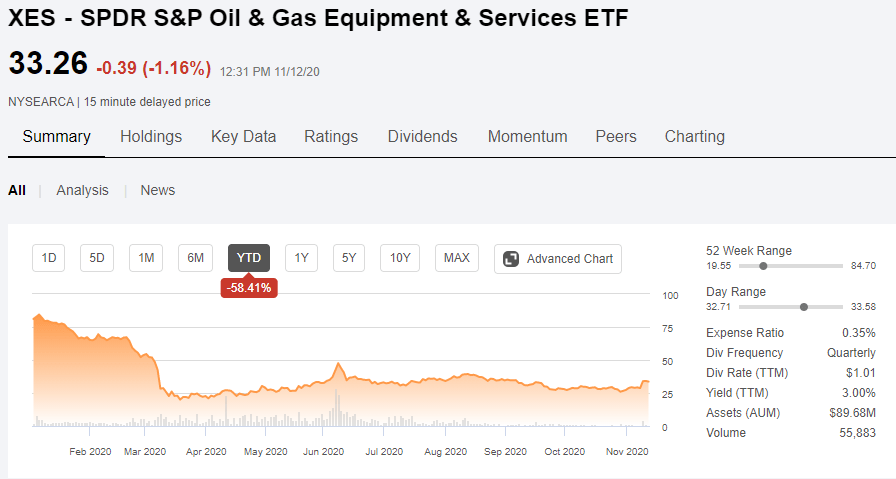
Source: Seeking Alpha
Over the past five years, the Fund is down about 82% compared to a gain in the S&P 500 of about 92 %.
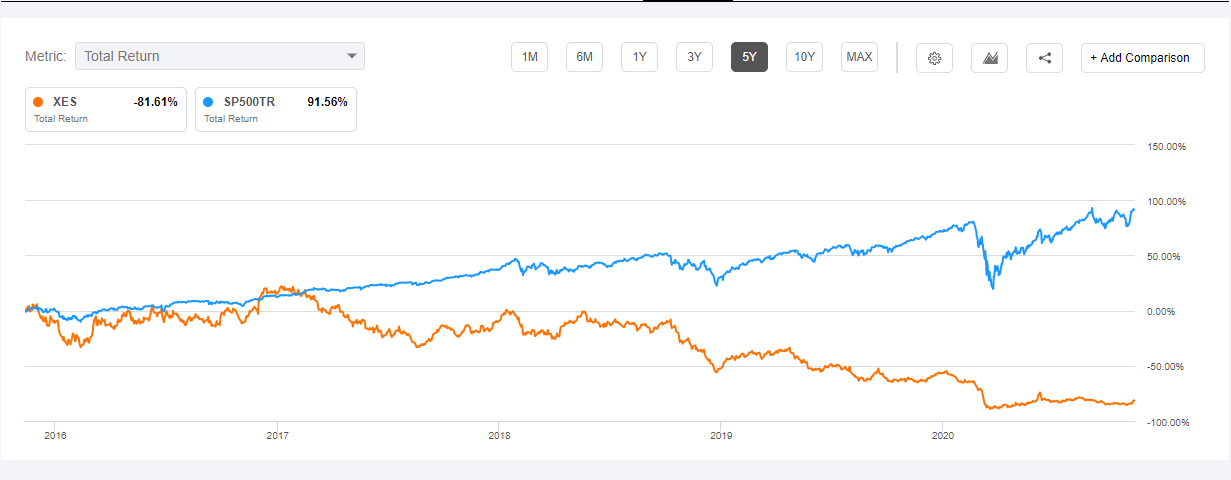
Source: Seeking Alpha
Rig Count
One proxy measure relevant to the Fund's investments is the rig count for the drilling industry and its suppliers. According to Baker Hughes,
"when drilling rigs are active they consume products and services produced by the oil service industry. The active rig count acts as a leading indicator of demand for products used in drilling, completing, producing and processing hydrocarbons."
In the U.S., the rig count recently fell to its lowest level since 2010. At 312 (oil and gas rigs), the count is down around 85% from its peak level since 2010.
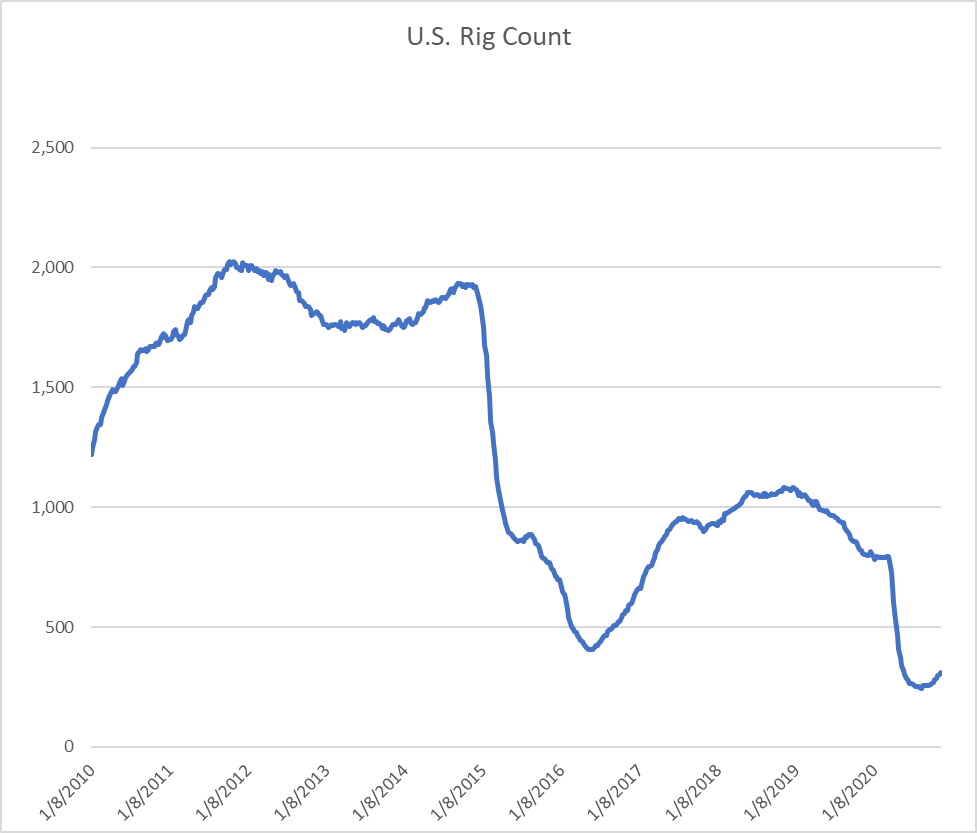
Data Source: Baker Hughes
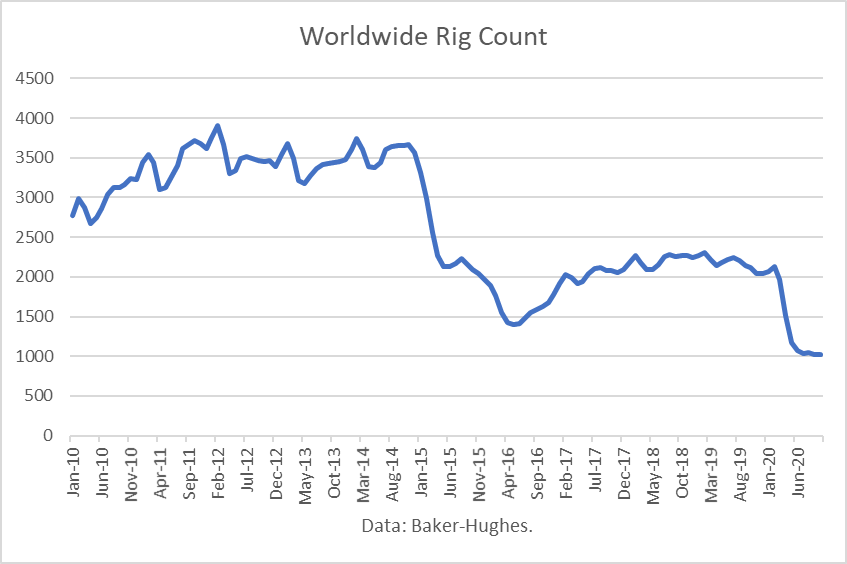
The worldwide rig count was 1,016 for October. That level is down about 75% from its high since 2010.
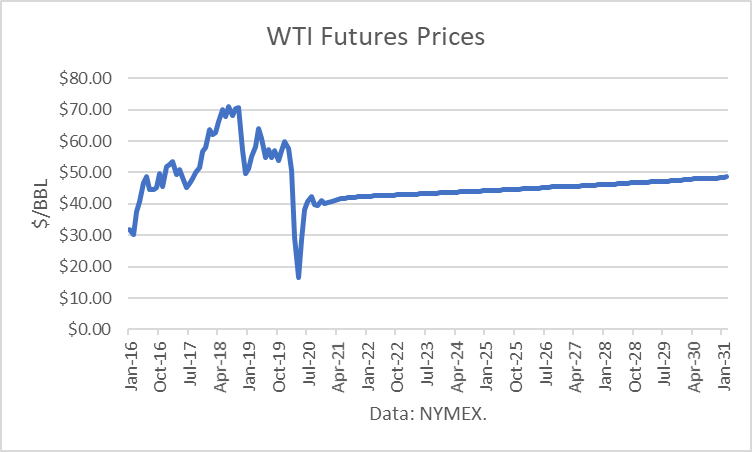
Oil Futures Prices
Furthermore, the long-term outlook for oil prices, as embedded in NYMEX crude oil futures prices, provides no solace. WTI futures prices remain below $50/barrel through 2030. Prices in the $40s provide little incentive for new drilling or for the demand for oil and gas equipment and services.
Conclusions
The oil and gas equipment and services sector has been depressed for years, resulting in continuous losses. A contrarian investor might be tempted to go long, figuring that the worst fundamentals have already been built into prices.
However, the oil futures market points to a "lower-for-longer" scenario. And it's quite possible that "peak demand" for oil has already been met, which implies that oil producers may be sitting on "stranded assets" of oil in the ground. I think the sector should be avoided and no attempt made to call the bottom.
Instead, the sector is a shorting candidate which I will likely short, as I did with California Resources Corporation (NYSE:CRC), and made an almost 100% return on that one.
To guide investors who are interested in profiting from outstanding opportunities in the energy sector, I provide a service on Seeking Alpha's Marketplace oriented toward individual investors, Boslego Risk Services. A long/short Model portfolio is continuously updated, along with on-going analysis of the oil market.
I am now accepting new members to Boslego Risk Services and invite you to sign-up. There are monthly and annual pricing options as described here. You may also read reviews posted by members here.
Disclosure: I/we have no positions in any stocks mentioned, and no plans to initiate any positions within the next 72 hours. I wrote this article myself, and it expresses my own opinions. I am not receiving compensation for it (other than from Seeking Alpha). I have no business relationship with any company whose stock is mentioned in this article.
