Fidelity MSCI Consumer Staples Index ETF: An Ideal Low-Cost Staples Play

FSTA is the most efficient US-based consumer staples ETF.
The fund is not well-diversified and feels top-heavy, but most of the top-10 stocks offer a high yield and have also demonstrated a long and consistent track record.
Consumer staples have underperformed the broader markets over the last six months but could be due for a comeback.
Why does man kill? He kills for food. And not only food; frequently there must be beverage.
- Woody Allen
ETF Profile and Key Features
The Fidelity MSCI Consumer Staples Index ETF (FSTA) allows investors to gain access to US-based consumer staples stocks, with at least 80% of the fund’s holdings being invested in stocks that make up the MSCI USA IMI Consumer Staples Index. Usually, Vanguard-based funds tend to come up with the most efficient tracking capabilities, but in this case, it is FSTA that offers investors the cheapest route to US staples, with a miserly expense ratio of just 0.08% (the Vanguard Consumer Staples ETF (VDC) has an expense ratio of 0.10%, whilst most other funds in the US consumer staples space have an expense ratio of between 0.4% and 0.65%).
A chief hallmark of staple-based investment avenues is that you “tend” to get a steady income component regardless of growth prospects. FSTA currently offers investors a dividend yield of c.2.5%, which is more or less in line with other peers in this space such as VDC, IYK, JHMS, RHS. This will help cushion any underperformance if people lack appetite for defensive sectors. Interestingly, at a time when a lot of ETFs have cut their annual payouts, FSTA has grown its annual dividends across all 3 quarters so far (Q1: +14% YoY, Q2: +1.3% YoY, Q3: +1.7% YoY).
Holdings analysis
An investment in FSTA will give you access to 96 stocks, but despite this reasonably large pool, what’s rather evident is that this is not very well-diversified with the prospects tied down to a few stocks. The top-10 stocks account for a whopping 70% of FSTA’s total holdings, and one stock in particular - Procter & Gamble (PG) - takes up a lion's share with a 16% stake, almost 7% higher than the second-biggest holding - Walmart Inc. (WMT). That said, prospects for PG remain attractive, so at the moment, this concentration shouldn’t be a great cause for concern.
PG recently delivered an outstanding Q1 in October, and crucially, the outlook too looks encouraging. Pandemic-related volume has been instrumental in driving through the overall sales number, and in Q1, the company benefitted from both pricing and mix to deliver a superior organic sales figure of 9%, more than twice that of the Street estimates of 4%. Resilience was demonstrated not just on the top line; on account of productivity initiatives, lower commodity sourcing and pricing, the company was able to drive through an impressive 170bps annual growth in gross margins, whilst operating margins of 27% were almost 240bps higher than Street estimates. Looking ahead, the company scaled up its FY21 organic sales guidance from 2-4% to 4-5%, with core EPS guidance growth guidance of 5-8% vs. 3-7% previously. Crucially, PG also increased its outlook for share buybacks in FY21 from $6-8 billion to $7-9 billion).
Given these attractive prospects, it would be unreasonable to expect PG to be cheaply valued. From the table below, we can see that it trades at a steep premium to its historical average, much like most of the other top 10 names. With the exception of Altria (MO) and Philip Morris (PM), most of FSTA’s top 10 names trade at a premium of anything between 6% and 39% over their historical averages.
However, I would also like to point to the last two columns in the table below as mitigating factors for high valuations. These staple names may not be able to churn out business growth numbers that are on par with, say, a tech sector, but what they lack in growth, they make up for in the consistency and their commitments to shareholder returns. This will serve as a very useful cushion to your portfolio during periods of heightened volatility and risk aversion. Most of the top 10 names have consistently grown their dividends for long stretches (annual growth of 36 years on average), and currently, the average forward yield of these names works out to more than 3% - a very useful income component.
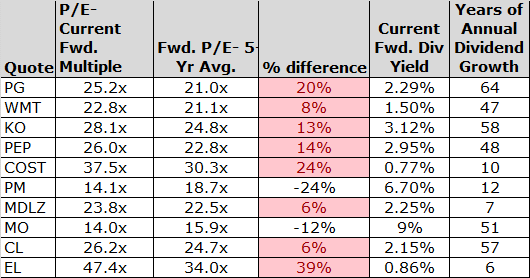
Source: Prepared by the author using data from Seeking Alpha
Food and beverages exposure
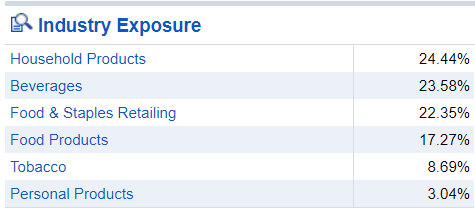
Source: Fidelity
The other aspect to note about this ETF is that from a product exposure perspective, c.63% of the holdings are exposed to the food, food retailing, and beverages space. Last month, I had shared a video in The Lead-Lag Report about how food & beverage prices in the US had been inching up for four successive months and recently crossed 4%. Rising food prices are prevalent across the world, and many of FSTA’s constituents have exposure to markets around the world. For instance, last week’s report from the Food and Agriculture Organization of the UN showed that the FAO Food price index reached 100.9, the highest point since January 2020; this was also the fifth successive month of increased prices.
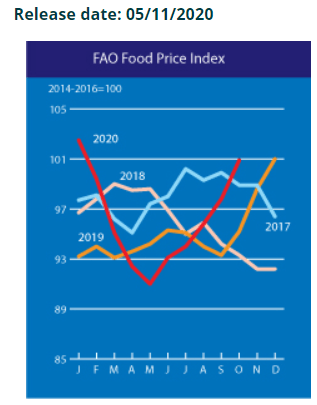
Source: FAO
Closing thoughts
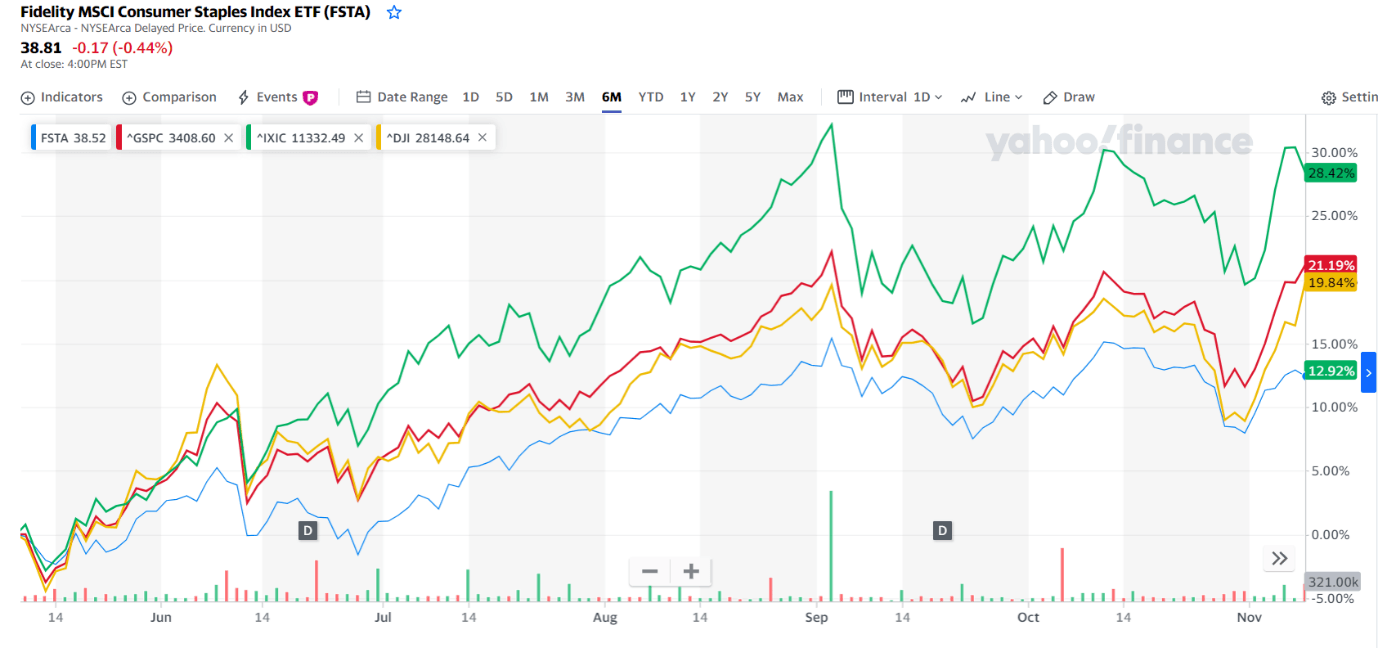
Source: Yahoo Finance
Now that Joe Biden is all set to take over as president of the US, recent reports have suggested that his administration would be looking to impose more lockdowns to control the spread of COVID-19. As I mentioned recently in the "Leaders-Laggards" segment of The Lead-Lag Report, hitherto, unlike utilities, investors have not lapped onto the consumer staples space as a means of defensive positioning, but prospective lockdowns in the future certainly increase the investment case for staples. If you recollect, consumer staples had served as something of a safe haven during the carnage we had witnessed earlier in March. However, since then it has proved to be a laggard; as you can see from the chart above, over the last six months, it has underperformed key benchmark indices such as the S&P 500, the Dow Jones and the Nasdaq, but conditions are gaining steam for some mean reversion here. Besides this week, both short-term and intermediate-term signals in The Lead-Lag Report have turned risk-off, so this represents an opportune time to consider shifting to low-beta (FSTA’s 3-year beta is 0.62x), high yield defensives such as consumer staples. FSTA, with its low cost and cohort of dividend-paying stocks, is an ideal investment vehicle to rotate into.
*Like this article? Don't forget to click the "Follow" button above!
 Anticipate Stock Crashes, Corrections, and Bear Markets
Sometimes, you might not realize your biggest portfolio risks until it’s too late.
That’s why it’s important to pay attention to the right market data, analysis, and insights on a daily basis. Being a passive investor puts you at unnecessary risk. When you stay informed on key signals and indicators, you'll take control of your financial future.
My award-winning market research gives you everything you need to know each day, so you can be ready to act when it matters most.
Click here to gain access and try the Lead-Lag Report FREE for 14 days.
Disclosure: I/we have no positions in any stocks mentioned, and no plans to initiate any positions within the next 72 hours. I wrote this article myself, and it expresses my own opinions. I am not receiving compensation for it (other than from Seeking Alpha). I have no business relationship with any company whose stock is mentioned in this article.
Additional disclosure: This writing is for informational purposes only and Lead-Lag Publishing, LLC undertakes no obligation to update this article even if the opinions expressed change. It does not constitute an offer to sell, a solicitation to buy, or a recommendation regarding any securities transaction. It also does not offer to provide advisory or other services in any jurisdiction. The information contained in this writing should not be construed as financial or investment advice on any subject matter. Lead-Lag Publishing, LLC expressly disclaims all liability in respect to actions taken based on any or all of the information on this writing.
