 By Indrani Sen
Zenith, the RoI Agency of Publicis Media, released its Business Intelligence – Video Entertainment report across ten key global markets in last week. The report has predicted that India will see higher growth in adspends on OTT than on TV during the next two years of this decade. In FY21, adspends on TV will grow by 4% while on adspends, OTT will grow by 24% and in FY22 ad spends will see 9% increase on TV against 34% increase on OTT.
While the Zenith report talks about future, the Advertising Report on Digital – Part 1 – July-Sept ’20 also published last week by TAM India analyses the immediate past. Based on AdEx data, the TAM India report confirms the accelerated growth of digital advertising during the lockdown and the post-lockdown period. There was a small negative growth in May, but during the unlocking period, the growth regained its momentum from June and went on increasing steadily.

Source: TAM India
The highlights of the report covering Jul-Sept’20 show that ad insertions per day increased by 32% during Jul-Sept’20. Among the top 10 categories, e-com and gaming had the highest growth. Five of the Top 10 categories with positive growth came from services sector. Amazon India was the leading advertiser and its brand www.amazon.in topped the brands list. Top 10 advertisers and brands had respectively 21% and 19% share in the total digital ad insertions.
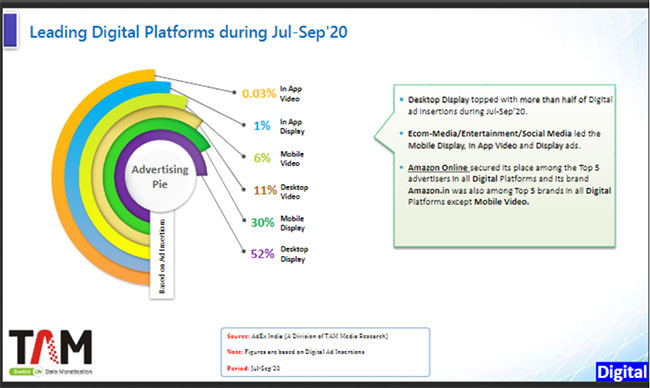
In spite of the rise in smartphone users, among digital platforms, Desktop Display topped with more than 50% share of the total digital ad insertions. YouTube topped the list of publishers with 15% share of digital advertising, while all other publishers has 85% share. advertising on digital platforms.
The next chart shows the share of the digital advertising pie by different platforms. Mobile Display and Mobile Video had respectively 30% and 6% share while Desktop Display and Desktop Video had respectively 52% and 11% share. Here Desktop includes Laptops also.
Source: TAM India
The findings on most utilised methods of transactions show that Ad Network was the most preferred mode of transactions (45%), followed by Direct (20%), Programmatic (17%) and others (19%). Though only 17% of the transactions were done through Programmatic, among other methods, the share of Programmatic/Ad Network (13%) and Programmatic-Direct (5%) indicate that programmatic buying has been making a steady progress in the transactions of digital advertising.

Source: TAM India
An analysis of creative types used for digital advertising during Jul-Sept’20 shows that Banners had a share of 45%, followed by HTML5 (40%) and Video (17%). Among the top 5 categories comprising of E-Com/ Entertainment/ Social Media, E-Com Online Shopping, E-Com Gaming, Corporate IT and Life Insurance. E-Com Gaming had the highest rate of growth during Jul-Sept’20. A total of 316 advertisers across 40 categories advertising 510 brands accounted for 80% of the total as insertions. The balance 20% was spread across many advertisers and brands who all wanted to board the band wagon of digital advertising. The total count showed 20,500+ advertisers across 480+ categories with 24,100+ brands participating in digital advertising during the period Jul-Sept’20!
This report has given us a comprehensive understanding of the rapidly growing digital advertising. We will be eagerly looking forward to the next editions of Digital Advertising Report by TAM India in order to follow the progress of the digital media during the pandemic hit 2020 and beyond.