PTC Inc.: A Near-Term Capital Gain Prospect High In The MM Forecast Ranks

Hundreds of computer software firms find specialties where expertise of knowledge or analytical approach provides competitive advantage for their user-subscribers.
For investors, they are all competitors, despite their differences in focus or approach.
Comparisons are needed among these investment alternatives: how likely are profits, what kinds of loss might be encountered, how long realization may take.
Whose expectations for those measures are available, how credible are they, and how likely are they to come to pass? How comparable between alternatives? What evidence exists?
We resolve those issues by using Market-Making-firm professionals’ actions when negotiating big-volume stock trades under time and competitive pressures, acting to dodge risk by hedging.
Investment Thesis
PTC, Inc. (NASDAQ:PTC) is an active investment alternative in competition with dozens of other computer software enterprises. Success from an investment point of view relates more to increased stock price than to which customers are served or technologies are pursued. That measure here rests importantly on already-developed and demonstrated capabilities. The comparative forecasts of well-informed securities markets pros are an important tell-tale. The end result of stock price competitions between alternative investments often is greatly conditioned by market circumstances including the varied investment appetites of huge-money institutional portfolio managers.
At this point in time the self-protective hedging actions of market-makers while acting to satisfy those portfolio demands define how far securities prices are likely to go, both up and down. Those defined expectations provide an array of comparable evaluation measures, based on how actual market prices have previously behaved when risk and reward have previously been seen in their present balance.
Description
"PTC Inc. operates as software and services company in the Americas, Europe, and the Asia Pacific. The company operates in two segments, Software Products and Professional Services. It offers Creo, a suite of product design software that provides capabilities for design flexibility, advanced assembly design, piping and cabling design, advanced surfacing, comprehensive virtual prototyping, and other design functions; Windchill, a product lifecycle management software; ThingWorx, which includes cloud-based tools that allow customers to connect products and devices to the cloud; and Vuforia Studio, a cloud-based tool that enables industrial enterprises to author and publish augmented reality experiences. The company also provides consulting, implementation, training, cloud, and license and support services. PTC Inc. markets its products primarily through third-party resellers and strategic partners. The company was formerly known as Parametric Technology Corporation and changed its name to PTC Inc. in January 2013. PTC Inc. was founded in 1985 and is headquartered in Boston, Massachusetts."
Source: Yahoo Finance
Comparing alternative investments
We perform our usual daily scan of the derivative securities markets to find what are the current most promising, near-term equity investments. Clues appear in Market-Makers' [MM] current-day price-range forecasts for over 2,900 widely-held and actively-traded stocks and ETFs.
The price-range forecasts are the natural implications of hedging actions taken to protect market-making-firm capital put necessarily at risk to "fill" multi-million-$ trade orders by institutions like those noted above.
The advantage of a price-RANGE forecast instead of just a price-TARGET forecast is that there is a sense, and recognition, of RISK in the forecast. All of our daily measures of forecasts have this essential dimension.
Here is how the reward~risk balances currently appear for PTC and other stocks noted by Yahoo Finance to be direct competitors or of most current interest to investors exploring this stock and in other vendors of software applications to design challenges.
Figure 1
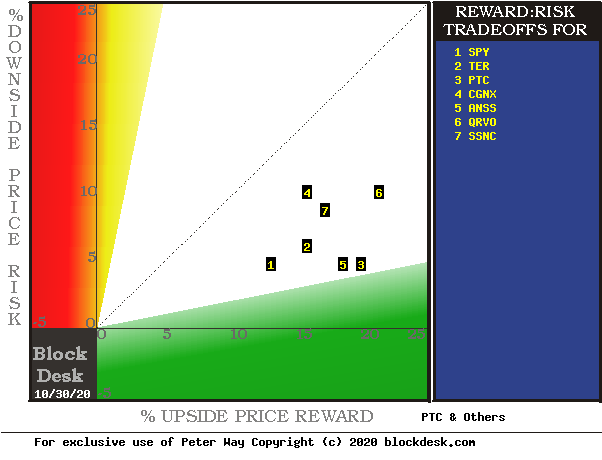
Source: Author
This map locates securities at the intersection of prospective price gains (green horizontal scale) and potential price drawdowns (red vertical scale) based on market-maker hedging behavior to protect their necessary endangerment of firm capital as they enable volume trades. Desirable conditions are down and to the right.
The stocks apparently of best advantage are along a "frontier" from "market-average" notion SPDR S&P500 Index ETF (SPY) at location [1] to ANSS at [5] to PTC at [3], and to QRVO at [6]. Our interest-focus is on PTC.
Alternatives to PTC are explored in greater detail in Figure 2, where other conditions contributing to reward and risk are contemplated. Principal questions for all alternatives are "how likely are these outcomes to happen", and "can their impact be improved?"
Figure 2 presents the MMs' price range forecasts for the best-ranked alternative investment candidates in Figure 1, along with the past five years of daily forecast outcomes from their prior forecasts with the same proportions of today's up-to-down prospects.
This table presents data on the stocks most likely to produce satisfying RATES of capital gain under the portfolio management discipline known as TERMD, explained by article How To Better-Than-Double Your Capital Gains (From Stocks Alone) By Using TERMD Portfolio Discipline in my SA blog.
That discipline seeks the largest, most likely, quickest to be captured net capital gains with the least interim exposure to price drawdown on the way to target reward attainment.
Figure 2
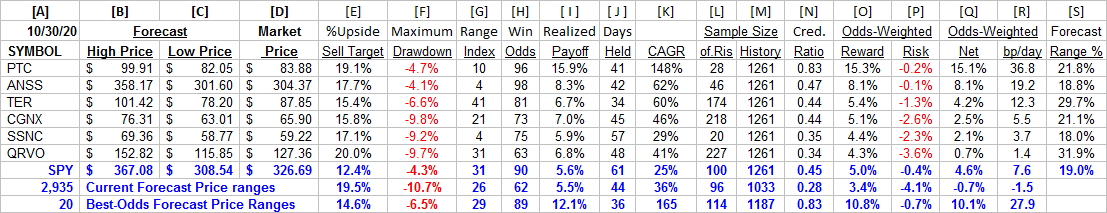
Source: Author
Contributing to that evaluation are the demonstrated odds of a profit-successful forecast in column [H], its complement of 100 - H, or loss frequency, size of net gain attained [ I ] and size of worst loss experience [F] so that when appropriately weighted in [O] and [P] they produce the Net of [Q]. Respecting the power of compounding, [Q] converted into basis points per day [J] of capital commitment at [R] presents a highly comparable figure of merit (fom) for investing preferences.
Figure 2 is row-ranked on [R]'s figure of merit (fom) and distinguishes PTC's capital gain prospects from all of the others.
An important part of the valuation is the role of TIME. PTC is seen as able to capture a [E] 19% capital gain (with a likelihood of 19 out of every 20) in two months of 21 [J] market days. Doing that has netted PTC with realized net payoffs [ I ] of +15.9%. ANSS in contrast has, from its 46 prior RI 4 forecasts, scored only 8.3% [ I ] net gains, and also took two months, 42 market days, to do it.
The combination of larger credibility of realized payoffs [ I ] from forecast expectations [E], higher win odds [H], and shorter required holding periods [J] boosts PTC's compound annual growth rate CAGR [K] to +148%, more than 2x the prospects for ANSS's +62%.
Put in terms more directly with all equity investments for which we have comparable forecast inputs, many are not even competitive today. PTC's fom [R] of 37 is better than the market-index ETF SPY's current sick 7.6 and its CAGR of +25%.
Top-ranked 20 MM forecast alternatives out of the MM-forecast population of 2900+ have upside fom average prospects larger than other investing alternatives of interest to PTC. Their average score is at the 27 bp/market-day needed to produce a capital investment double when sustained for a year.
It is the high 36.8 bp/day score of PTC among even these best-ranked MM forecast stocks which brings the stock to our attention.
Recent trend of MM price range forecasts
Figure 3 pictures the past six months of PTC daily MM implied price range forecasts. The vertical bars plot the price ranges, with a heavy dot at the market's quote on the date of the forecast. It splits the range into upside and downside coming price change prospects.
Figure 3
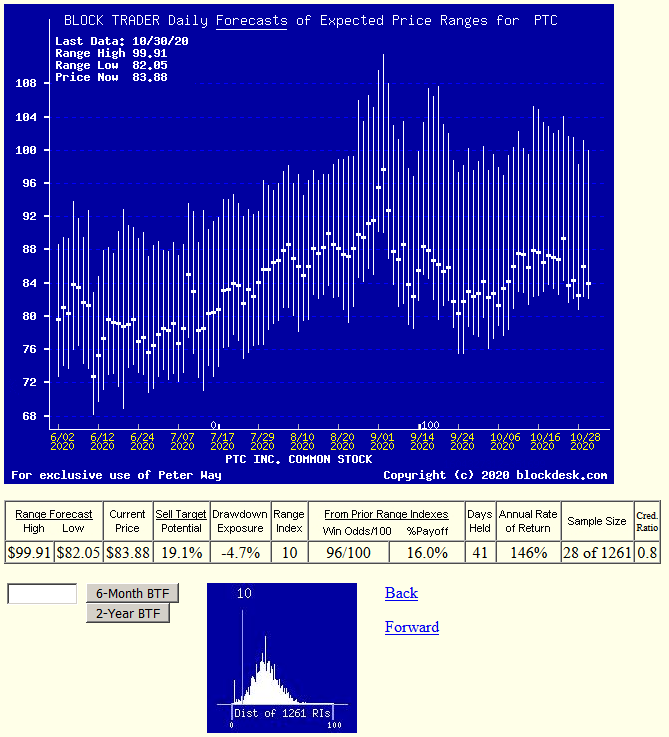
Source: Author
This analysis has a time-horizon of three-month expectations, well short of most currently-anticipated Street analyst stock outlooks. The time to seize opportunity is when it is presented, as PTC's reduced Range Index of 10 now indicates. Apparently that is what some major informed institutional investors are now doing. While the stock's price has had a minor pullback, its coming-price forecast range has had very little decline at either upper or lower extremes.
The small lower picture of PTC's distribution of its past five years of daily Range Indexes shows how low is its current price, relative to typical expectations. The high ratio of profitable buys (Win Odds) in [H] of Figure 2 at this level, 19 out of 20, and the substantial Net Payoff % of +16% bodes well for current purchase of the stock.
Conclusion
Investors looking for good near-term capital-gain vehicles are likely to find considerable near-term satisfaction in a PTC, Inc. active investment. Substantially larger, better-odds of profit appear here than are available elsewhere.
Disclosure: I/we have no positions in any stocks mentioned, but may initiate a long position in PTC over the next 72 hours. I wrote this article myself, and it expresses my own opinions. I am not receiving compensation for it (other than from Seeking Alpha). I have no business relationship with any company whose stock is mentioned in this article.
Additional disclosure: Disclaimer: Peter Way and generations of the Way Family are long-term providers of perspective information, earlier helping professional investors and now individual investors, discriminate between wealth-building opportunities in individual stocks and ETFs. We do not manage money for others outside of the family but do provide pro bono consulting for a limited number of not-for-profit organizations.
We firmly believe investors need to maintain skin in their game by actively initiating commitment choices of capital and time investments in their personal portfolios. So, our information presents for D-I-Y investor guidance what the arguably best-informed professional investors are thinking. Their insights, revealed through their own self-protective hedging actions, tell what they believe is most likely to happen to the prices of specific issues in coming weeks and months. First months of 2020 to date have produced over 4,100 profitable position closeouts in a 75%/25% win-loss ratio. Evidences of how such prior forecasts have worked out are routinely provided in the SA blog of my name.
