
200 day moving averages is successful in identifying price trends.
Business decisions make them a reliable tool.
Company leadership makes another type of momentum a useful timing tool.
The 200-day moving average is an important tool for investors. It is important because it is quite successful in capturing the trends of the market and stocks over a sustained period of time.
The main reason why it works is prices reflect economic momentum. The business cycle, furthermore, has its own pattern driven by business decisions. A second momentum indicator takes advantage of this feature. Let’s look at these issues in detail.
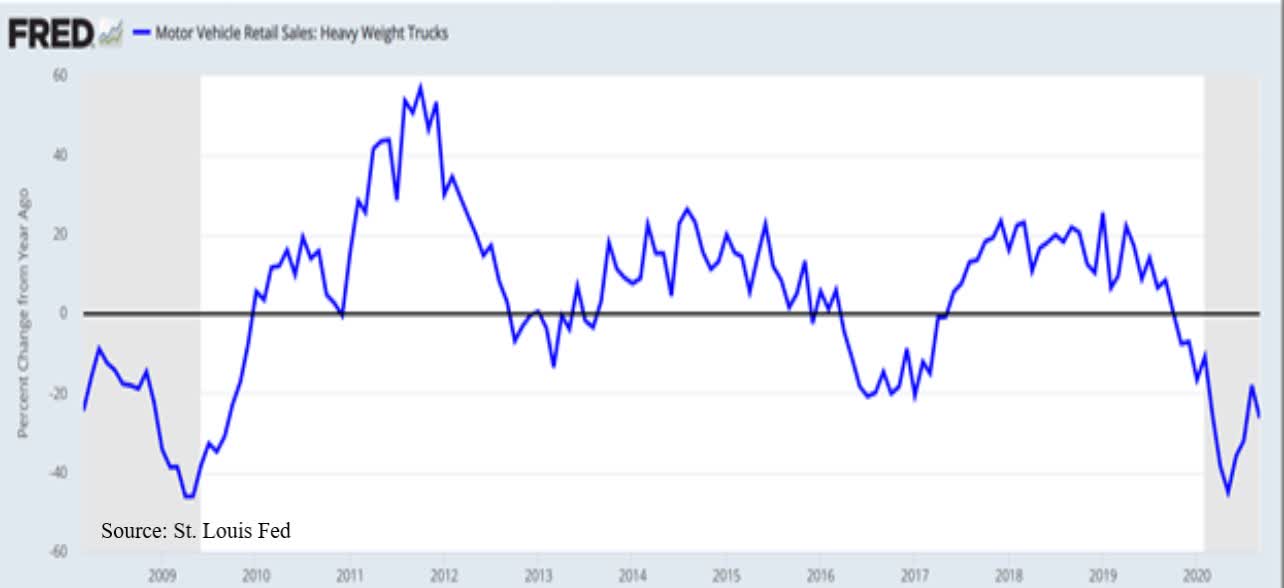 Since 2009 there have been three business cycles: 2009-2013, 2013-2016, and 2016-2020. A new business cycle started in March 2020. The rate of change in heavy truck sales shows quite clearly the three business cycles.
There are many ways to explain the functioning of a business cycle. The most obvious one is to relate business fluctuations to management efforts to match inventory levels to sales. The main idea behind this cycle is business decision makers react emotionally to strong sales or to excessively weak sales. They respond too aggressively to the required inventory adjustment by over stocking when sales are strong or under stocking when business is too slow.
At the bottom of each cycle business realizes inventories are too low relative to existing demand. The response is to increase production to build needed inventories. Therefore, they are forced therefore to hire people, buy raw materials, and increase borrowing.
This process is self-reinforcing as increases in employment stimulate more demand for goods. Eventually business recognizes they stocked excessive inventories while demand was slowing down - usually caused by increasing inflation and interest rates.
Business response is to reduce inventories as earnings become an issue due to high cost of carrying them. The outcome is reduction in production, reduction in employment, reduction in the purchase of raw materials, and reduction in borrowing. This process is self-reinforcing until inventories are so low that they need to be replenished.
The pattern of the rate of change of heavy truck sales shows the duration of an up-cycle and a down-cycle is about two years. The success of the 200-day moving average is due to this two-year trend of the business cycle. The moving average captures this lasting economic process.
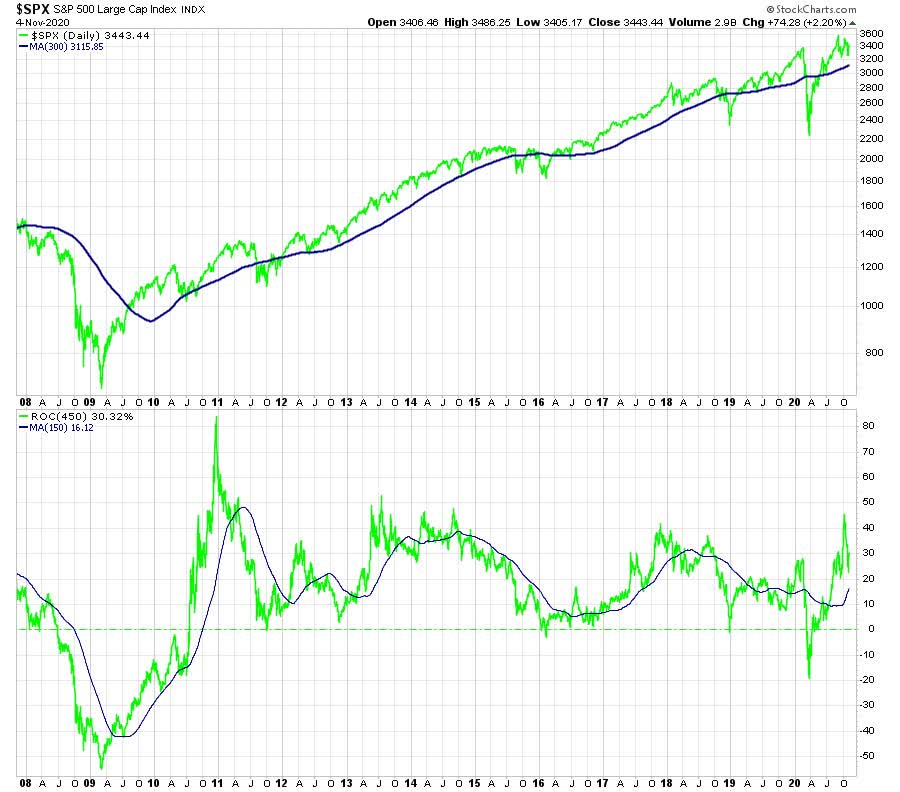 This behavior is more evident if one takes the rate of change of the S&P 500. The three cycles we experienced since 2009 become visible and coincide with the cycle reflected by the change in heavy truck sales.
Investors, however, should take advantage of a second momentum. This type of momentum shows the relative advantage of a sector or stock during a particular phase of the business/market cycle. The main idea is there are companies (OTC:ETFS) that perform best during periods when the business cycle is on an upswing. These companies tend to outperform the “average” company (S&P 500).
In the declining phase of the business cycle these same companies are likely to underperform the S&P 500 while a complete set of different companies will show superior performance.
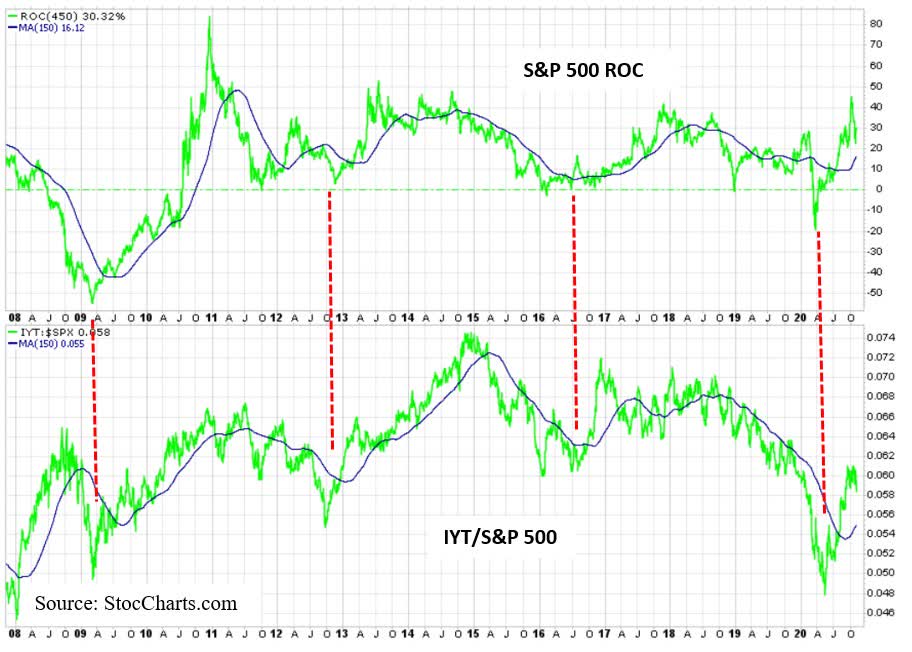
The action of the transportation stocks (ETF: IYT) compared to the S&P 500 shows this feature. The graphs in the lower panel plot the ratio between IYT and the S&P 500 and its moving average. This ratio rises when IYT outperforms the S&P 500. The ratio declines when the S&P 500 outperforms IYT.
The relative strength of IYT compared to the S&P 500 has a momentum of its own. IYT does in fact represent those companies performing well during the strengthening phase of the business cycle. This momentum, reflecting the outperformance of IYT, lasts close to two years.
When the business cycle peaks and declines as in 2018-2019, IYT starts underperforming the S&P 500. This underperformance has also a momentum of its own and takes place when the economy downshifts.
It is interesting to note how the peaks and troughs of the relative strength (outperformance and underperformance) of IYT and the growth of the S&P 500 average coincide with those of the business cycle as shown by the rate of change of heavy truck sales. Similar performance is shown by many other sectors. For instance, ETFs such as XLB, XLI, XLF, XLU, and XLP, among others.
The bottom line of this article is to recognize that business cycle trends drive two kinds of momentum: price momentum and relative strength momentum.
Disclosure: I/we have no positions in any stocks mentioned, and no plans to initiate any positions within the next 72 hours. I wrote this article myself, and it expresses my own opinions. I am not receiving compensation for it. I have no business relationship with any company whose stock is mentioned in this article.
