One Of These Two 7% Yielding Blue Chips Is A Buy Right Now
High-yield blue-chips can be just the ticket to a prosperous retirement, as well as mouth-watering long-term returns.
Chevron is a beloved 7% yielding dividend aristocrat that's been delivering incredibly dependable and generous income for 33 consecutive years.
However, CVX's commodity based business model and elevated FCF payout ratio, during an out of control third wave of the pandemic makes it speculative and riskier.
In contrast PRU offers the safe 7% yield, but with a much safer and well covered dividend. Analysts expect it to grow about twice as fast as Chevron, and potentially deliver 22.5% CAGR total returns over the next five years, more than 5X the S&P 500.
Today I bought PRU twice, during its knee-jerk post-election 7% crash. I've set limits to keep buying as long as this anti-bubble/Buffett style "Fat Pitch" blue-chip keeps falling.
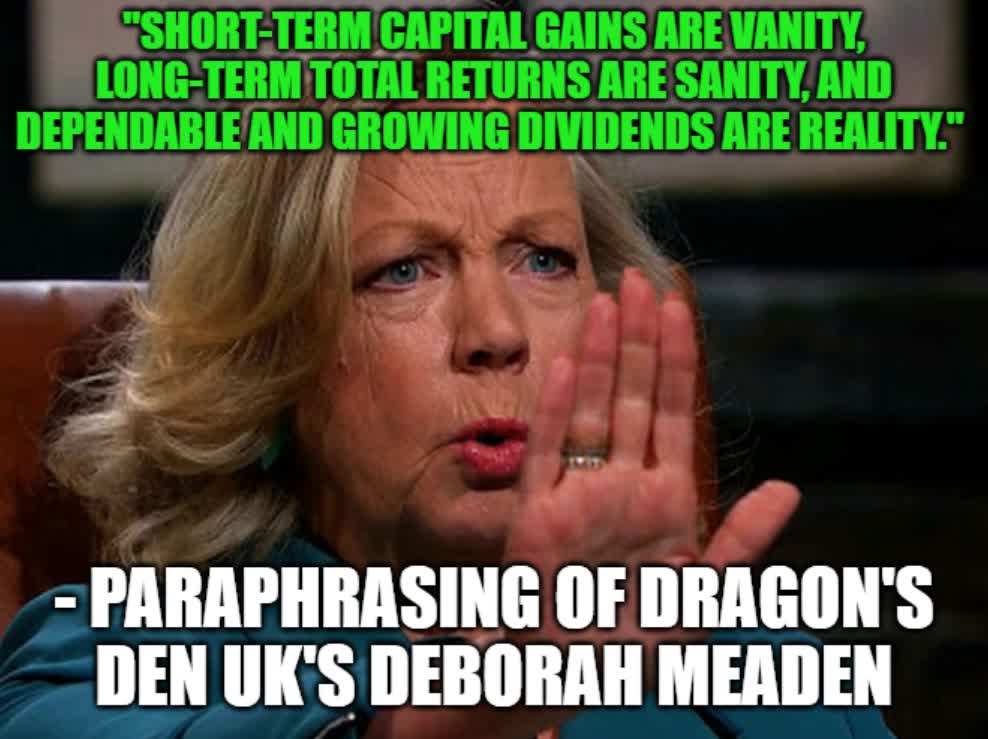
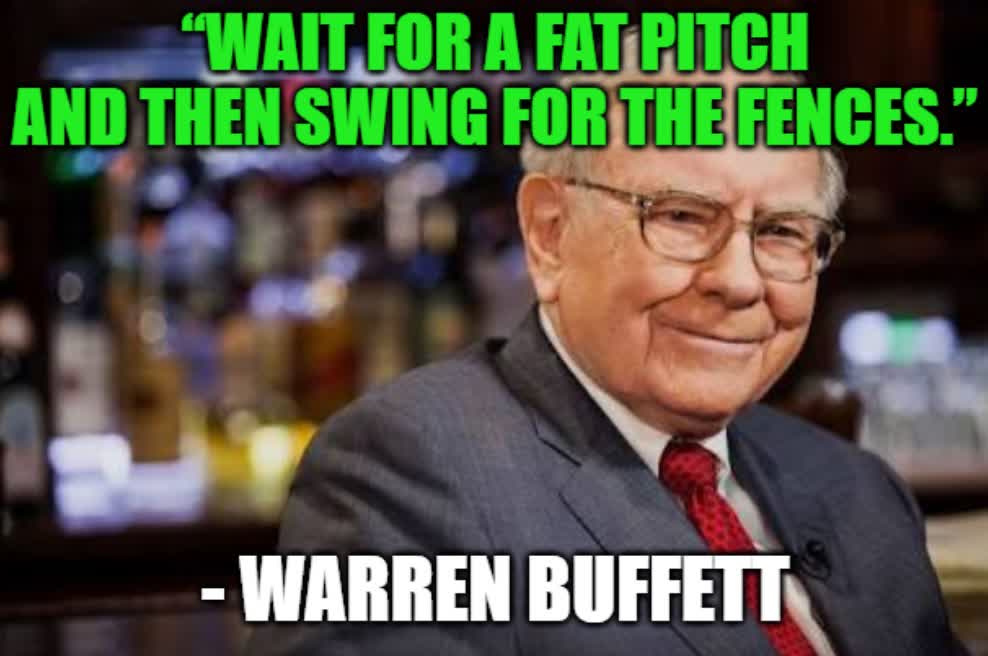 (Source: Imgflip)
Retirees love high-yield stocks and for good reason.
Seven Proven Ways To Beat The Market Over Time
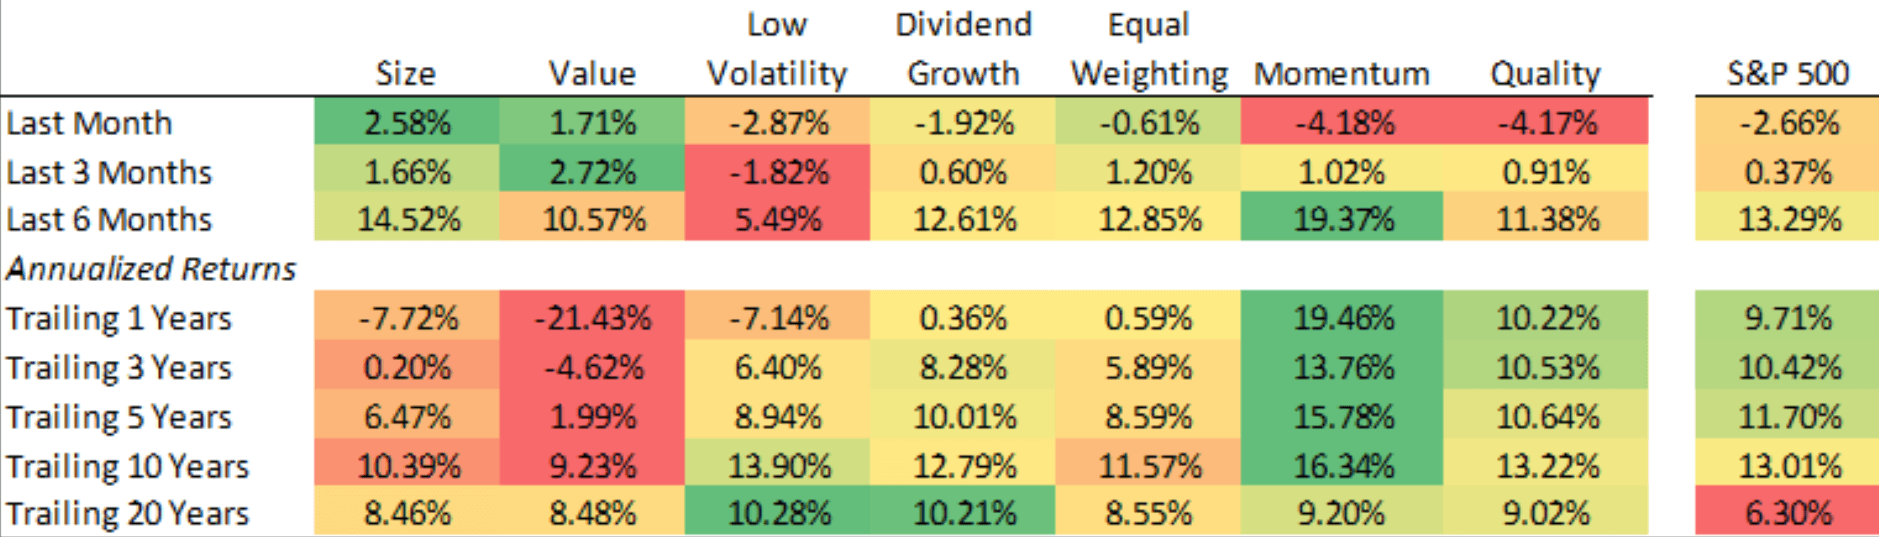
(Source: Ploutos) data as of October
High-yield dividend growth stocks can be a great way to combine several alpha factors such as value, dividend growth, low volatility, and quality.
Alpha Factor Equal Weighting Total Returns from 1997 to 2019
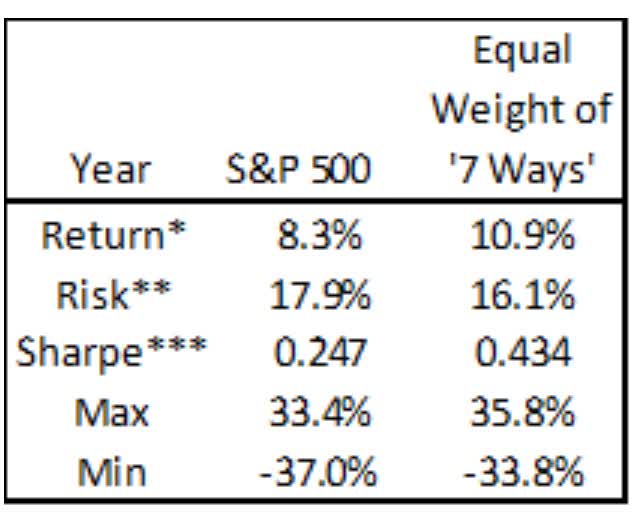 (Source: Ploutos)
This approach of combining several proven market-beating strategies in your portfolio, even in the same company is a great way to avoid what falling victim to what I call "market envy".
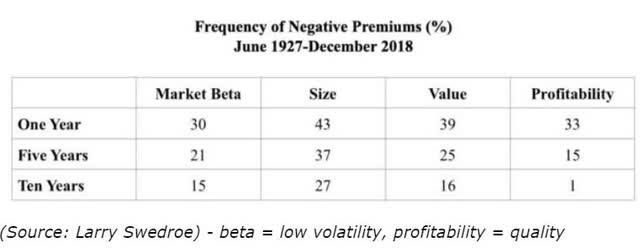 The reason any strategy works over time is that none work all of the time. If they did everyone would use it, resulting in massive bubbles that would burst resulting in long periods of underperformance.
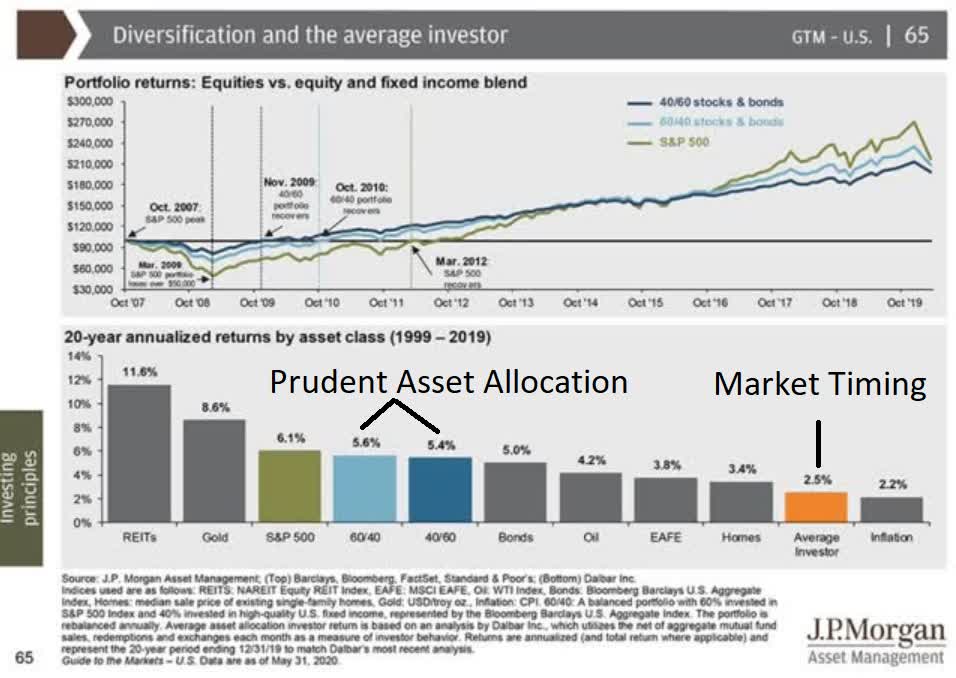 Market timing isn't just due to investors panicking at the wrong time, it's a complex interplay between the two most basic psychological principles in finance, fear, and greed.
Basically, if you use a diversified portfolio that combines several alpha factors, you're less likely to suffer a lost decade of underperformance that makes it extremely hard to remain disciplined.
 (Source: Imgflip)
You know what else helps you keep your eyes on the prize and can prevent costly mistakes? Dividends!
 (Source: Imgflip)
There's nothing like a steady stream of safe and growing dividends that help pay expenses in retirement, or whatever your financial goal is, to minimize the risk of making a stupid investment mistake.
Such as paying an absurd valuation for a red-hot growth stock, such as Aspen Technology (AZPN). Aspen is, by Joel Greenblatt's definition, one of the highest quality companies on earth, generating over 1,300% returns on capital over time.
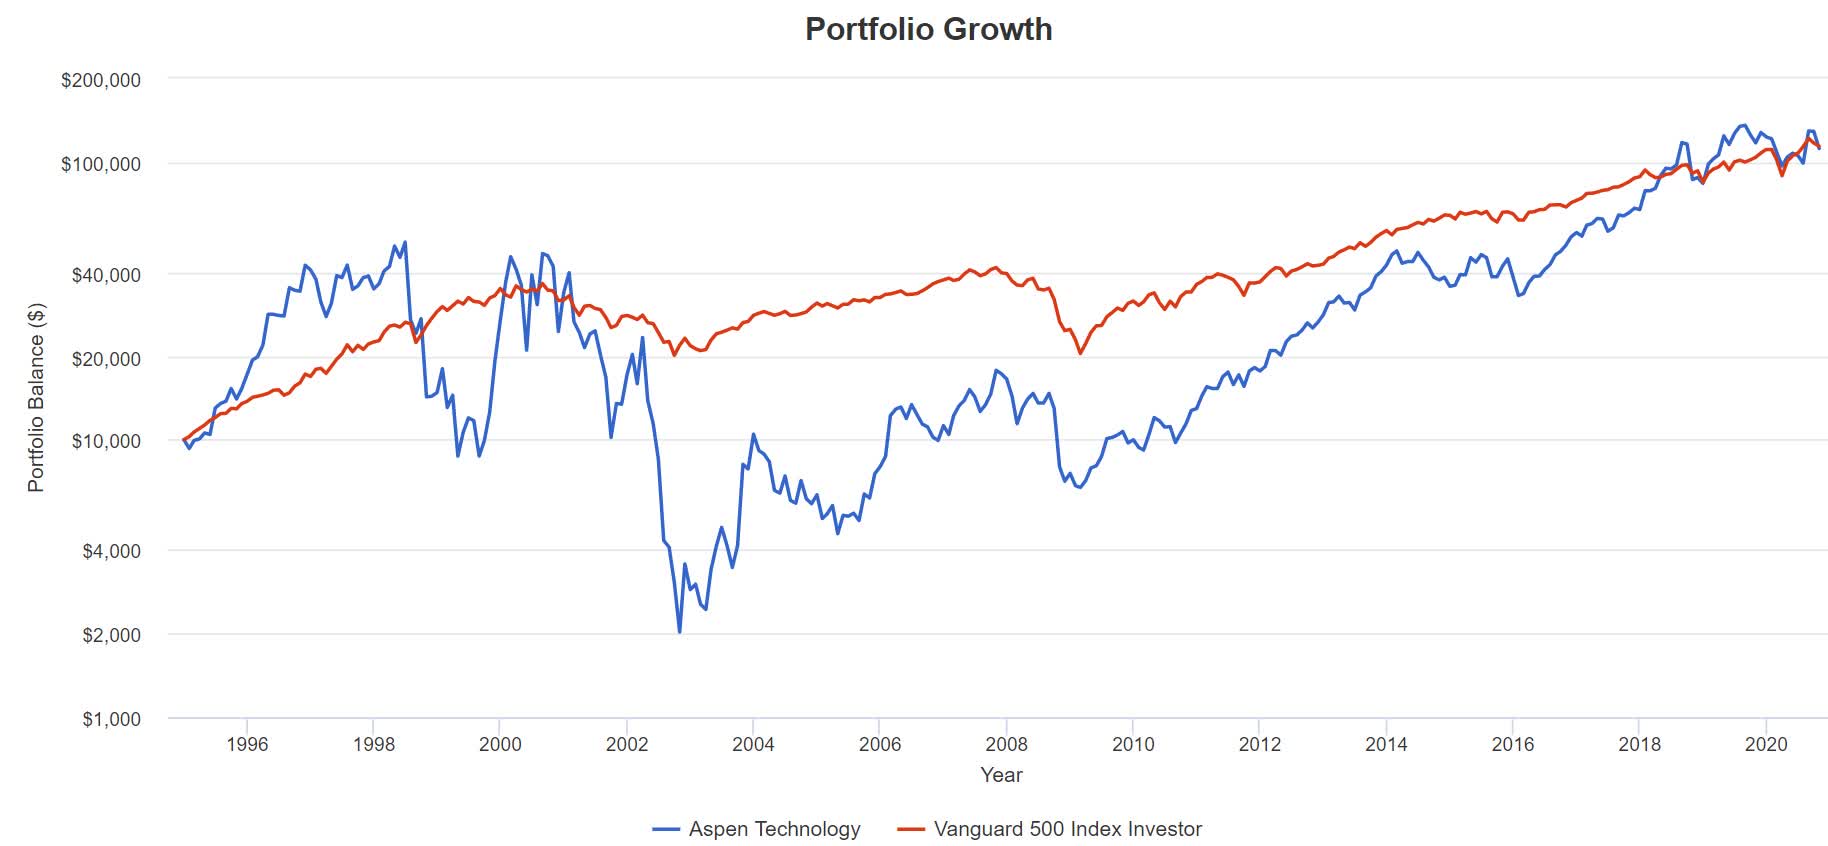
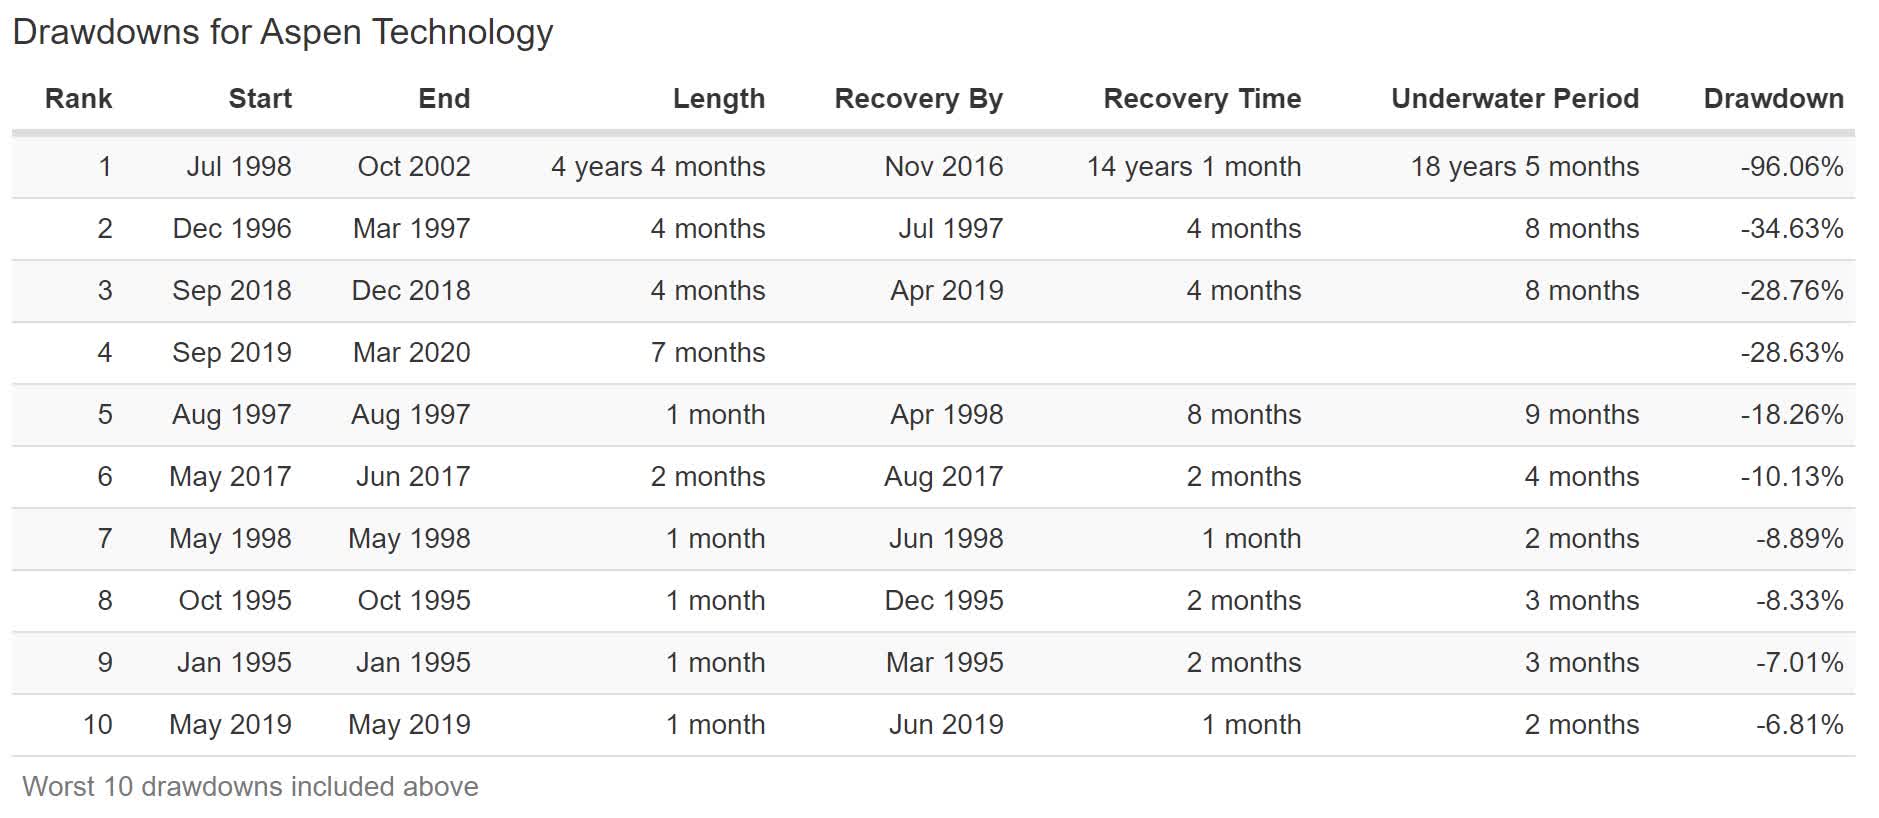 But that quality, combined with the company's rapid growth (15% CAGR long-term growth consensus) combined during the insanity of the tech bubble to cause speculators to pay 355X cash flow for a company the market normally values at 24X.
When the mother of all bubbles, literally 13X historically overvalued, burst, Aspen fell 9 over the next four years. Even with rapid growth that was 2.5X faster than the S&P 500, investors had to wait 18.5 years to break even.
"Aha! But Aspen isn't a dividend stock and I only buy dividends stocks!" Don't think that doesn't mean that there aren't other pitfalls that might trip up your plans of a prosperous dividend rich retirement.
In this article, I want to highlight some very important principles about safe dividend investing, by using Chevron (CVX) and Prudential (PRU) as examples. Both are high-yield stocks beloved by conservative income investors such as retirees.
But just one is actually a company I would recommend entrusting your hard-earned savings too. In fact, I just bought it during today's 7% crash, twice, and have several more limits set in case it continues to fall during this post-election hysteria surrounding financials.
Chevron: This 7.1% Yielding Dividend Aristocrat Is The Best House In A Bad Neighborhood
Don't get me wrong, Chevron is a blue-chip quality company.
Dividend Kings Rating System
| Quality Score | Meaning | Max Invested Capital Risk Recommendation | Margin Of Safety Potentially Good Buy | Strong Buy | Very Strong Buy | Ultra-Value Buy |
| 3 | Terrible, Very High Long-Term Bankruptcy Risk | 0% | NA (avoid) | NA (avoid) | NA (avoid) | NA (avoid) |
| 4 | Very Poor | 0% | NA (avoid) | NA (avoid) | NA (avoid) | NA (avoid) |
| 5 | Poor | 0% | NA (avoid) | NA (avoid) | NA (avoid) | NA (avoid) |
| 6 | Below-Average, Fallen Angels (very speculative) | 1% | 35% | 45% | 55% | 65% |
| 7 | Average | 2.5% | 25% to 30% | 35% to 40% | 45% to 50% | 55% to 60% |
| 8 | Above-Average | 5% (unless speculative then 2.5%) | 20% to 25% | 30% to 35% | 40% to 45% | 50% to 55% |
| 9 | Blue-Chip | 7% (unless speculative then 2.5%) | 15% to 20% | 25% to 30% | 35% to 40% | 45% to 50% |
| 10 | SWAN (a higher caliber of Blue-Chip) | 7% (unless speculative then 2.5%) | 10% to 15% | 20% to 25% | 30% to 35% | 40% to 45% |
| 11 | Super SWAN (as close to perfect companies as exist) | 7% (unless speculative then 2.5%) | 5% to 10% | 15% to 20% | 25% to 30% | 35% to 40% |
The Dividend Kings quality scoring system is comprised of three sub-scores.
- dividend/balance sheet safety (if a company doesn't pay a dividend): 5 points
- business model (stable profitability over time vs peers, i.e. "Moatiness"): 3 points
- management dependability score (capital allocation over time/dividend track record/MSCI ESG score): 3 points
In order to be considered a blue-chip a company needs a score of 9+.
Chevron Safety Score: 67% = 4/5 Above-Average
Dividend safety measures the relative risk of a dividend cut during recessions relative to the average S&P 500 quality company.
 (Sources: Moon Capital Management, NBER, Multipl.com)
Using historical recession cut data and the blue-chip economist consensus estimate of how bad any given economic downturn is, we can estimate the approximate risk of a company cutting its dividend in this pandemic, or an average future recession.
| Safety Score Out of 5 | Dividend Kings Safety Score (31 Safety Metric Model) | Approximate Dividend Cut Risk (Average Recession) | Approximate Dividend Cut Risk This Recession |
| 1 (unsafe) | 0% to 20% | over 4% | 16+% |
| 2 (below average) | 21% to 40% | over 2% | 8% to 15% |
| 3 (average) | 41% to 60% | 2% | 4% to 8% |
| 4 (above-average) | 61% to 80% | 1% | 2% to 4% |
| 5 (very safe) | 62% to 100% | 0.5% | 1% to 2% |
The Dividend Safety Score is a proprietary model consisting of 31 safety metrics. Not all of them are appropriate for all companies, and the weighting of these metrics is the secret sauce that helps Dividend Kings members avoid unsafe dividend stocks.
Dividend Kings Safety Model
| 1 | 2019 Payout Ratio vs safe level for the industry (historical payout ratio vs dividend cut analysis by industry/sector |
| 2 | 2020 Consensus Payout Ratio vs safe level for the industry (historical payout ratio vs dividend cut analysis by industry/sector) |
| 3 | 2021 Consensus Payout Ratio vs safe level for the industry (historical payout ratio vs dividend cut analysis by industry/sector) |
| 4 | 2022 Consensus Payout Ratio vs safe level for the industry (historical payout ratio vs dividend cut analysis by industry/sector) |
| 5 | 2023 Consensus Payout Ratio vs safe level for the industry (historical payout ratio vs dividend cut analysis by industry/sector) |
| 6 | Debt/EBITDA vs safe level for industry (credit rating agency standards) |
| 7 | Historical Debt/EBITDA vs safe level for industry (credit rating agency standards) |
| 8 | Interest coverage ratio vs safe level for industry (credit rating agency standards) |
| 9 | Historical Interest coverage ratio vs safe level for industry (credit rating agency standards) |
| 10 | Debt/Capital vs safe level for industry (credit rating agency standards) |
| 11 | Current Ratio (Total Current Assets/Total Current Liabilities) |
| 12 | Historical Current Ratio |
| 13 | Quick Ratio (Liquid Assets/current liabilities (to be paid within 12 months) |
| 14 | Historical Quick Ratio |
| 15 | S&P credit rating & outlook |
| 16 | Fitch credit rating & outlook |
| 17 | Moody's credit rating & outlook |
| 18 | MSCI ESG Score |
| 19 | 30-year bankruptcy risk |
| 20 | Implied credit rating (if not rated, based on average borrowing costs, debt metrics & advanced accounting metrics) |
| 21 | Average Interest Cost (cost of capital and verifies the credit rating) |
| 22 | Dividend Growth Streak (vs Ben Graham 20 years of annual dividends standard of excellence) |
| 23 | Uninterrupted Dividend Streak (vs Ben Graham 20 years of uninterrupted dividends standard of quality) |
| 24 | Piotroski F-score (advanced accounting metric measuring short-term bankruptcy risk) |
| 25 | Historical F-score vs 4+ safety guideline |
| 26 | Altman Z-score (advanced accounting metric measuring long-term bankruptcy risk) |
| 27 | Historical Z-score vs 1.81+ safety guideline |
| 28 | Beneish M-score (advanced accounting metric measuring accounting fraud risk) |
| 29 | Historical Beneish M-score vs -2.22 or less safety guideline |
| 30 | Dividend Cut Risk In This Recession (based on blue-chip economist consensus) |
| 31 | Dividend Cut Risk in Normal Recession (based on historical S&P dividend cuts during non-crisis downturns) |
- 24 of these metrics apply to oil companies
- CVX scores 67% earning a 4/5 above-average dividend safety score
- 2% to 4% risk of a cut in this pandemic
- 1% risk in a historically average recession
Chevron Business Model Score: 2/3 Average
Oil is a commodity business in which there is no moat. In terms of free cash flow that ultimately pays the dividend that is the only reason for owning CVX, the company never controls its own destiny.
Yes, management can cut capex during downturns, but if oil stays low enough for long enough, CVX will have to borrow to fund the dividend as well as sufficient growth capex to maintain steady production.
- interest must be services with cash flow, and if production falls too low for too long, the company defaults on its bonds and must declare bankruptcy taking the stock to zero
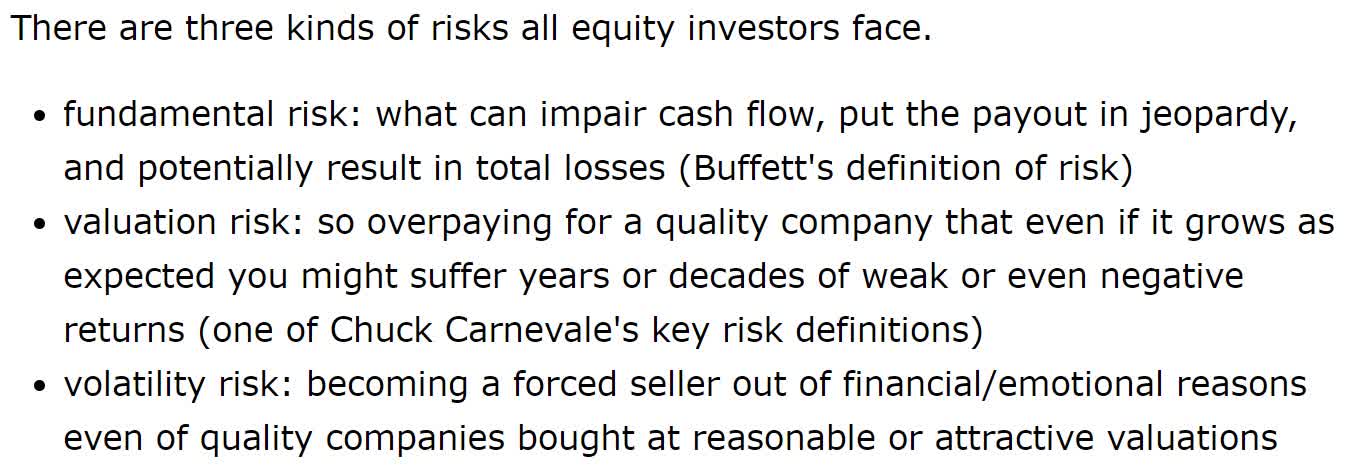 Bankruptcy is the ultimate fundamental risk because it represents complete and permanent destruction of your capital.
 Chevron Management Dependability Score: 3/3 Exceptional
 (Source: Imgflip)
No company has ever earned investors a penny in profits because nothing ever went wrong, but despite something always going wrong.
- competitors are always trying to win market share
- industry-specific risk profiles are chock full of challenges skilled management must adapt and overcome
- being able to maintain good profitability while preparing for and surviving industry/economic downturns without cutting the dividend is a sign of skilled management you can trust with your hard-earned money.
Morningstar considers Chevron's management to be "exemplary" and I agree.
Mike Wirth replaced John Watson as CEO and chairman in early 2018. Wirth has been with Chevron since 1982, most recently serving as vice president of midstream and development for the past two years, and before that leading the downstream and chemical divisions for nearly 10 years. We give Watson high marks for his tenure, as he leaves Chevron well-positioned for a lower oil price world. Wirth's challenge will be to preserve the cost reductions achieved over the past few years and ensure capital discipline as Chevron enters its next stage of growth. The recent drop in oil prices will make this especially important.
Under Watson, Chevron demonstrated a measured approach to acquiring U.S. unconventional assets and stayed out of places such as southern Iraq, where the returns are questionable. We think this indicates Chevron's overall emphasis on returns over growth and is reflected in its returns on capital, which rate near the highest in the sector. Unlike other majors, Chevron has been reluctant to rush into acquisitions or add projects in foreign countries where it cannot add value for the host countries or shareholders. Wirth seems to be maintaining these policies by not entering a bidding war after making an initial offer for Anadarko.
As a result, Chevron's upstream segment's returns have outperformed peers in past years. Also, the firm remains focused on cash returns to shareholders. Its preferred method is through dividends, which it has historically steadily increased. Its current investment plans leave it flexible in the event of volatile oil prices and ensure dividend growth in the years to come. Although the recent sharp drop in prices might result in a pause in growth. Given these factors, we think Chevron earns an Exemplary stewardship rating." - Morningstar
Chevron may not be a wide moat company, but its corporate culture is extremely conservative, which is why today it's tied with Exxon (XOM) for the highest credit rating in the industry (AA negative outlook).
The 33-year dividend growth streak as well as its BBB average ESG rating from benchmarking giant MSCI earns it a 3/3 management dependability score.
ESG stands for "environmental, social and governance" and is summarized by the famous catchphrase "people, planet, profits." However, ESG isn't just for liberal "woke" millennials that are "on trend" and trying to impress Silicon Valley venture capitalists with their virtue signal.
ESG is considered an essential part of a company's overall risk profile by such socialist hippy institutions as
- S&P
- Fitch
- Moody's
- BlackRock (the world's largest passive fund manager)
- MSCI (the indexing giant)
Basically, the world's best risk assessors consider this stuff important. That's because a company that's not being run for the long-term, is more likely to be run into the ground, resulting in bond defaults and investor losses.
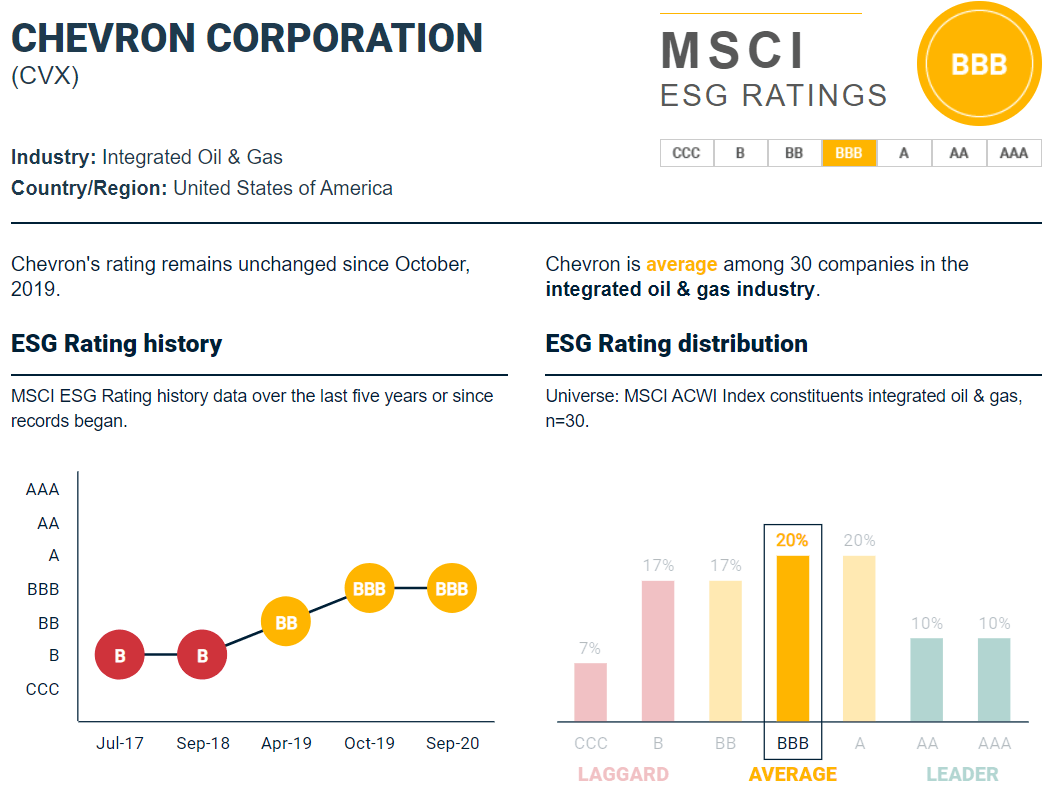
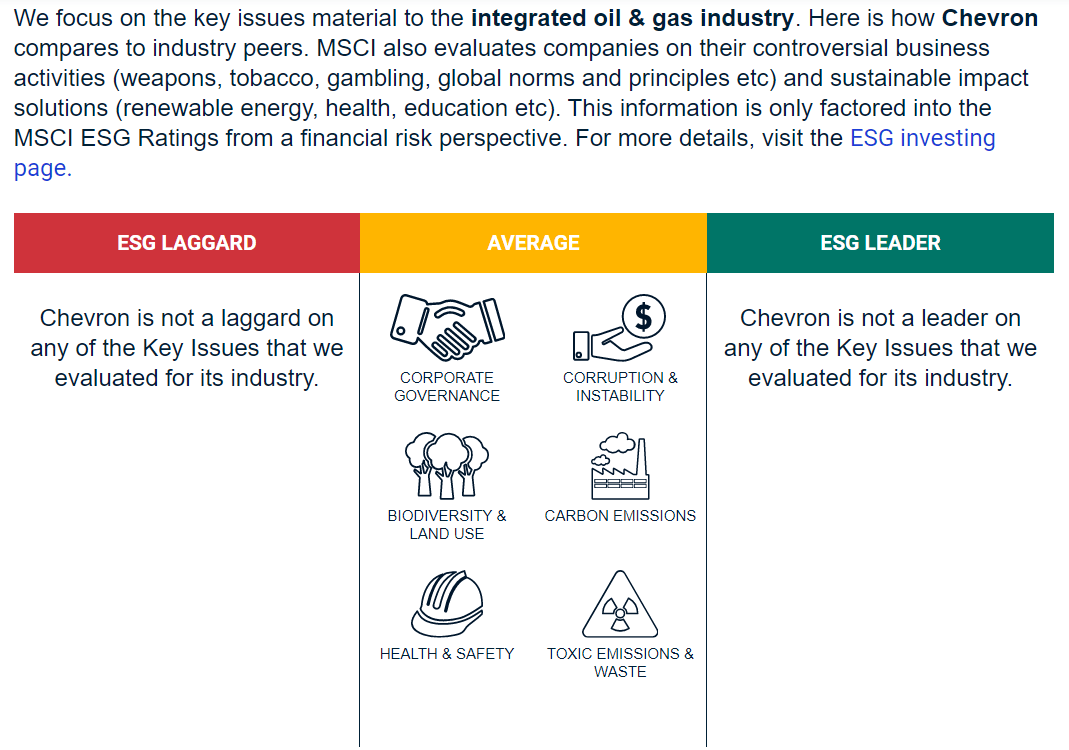
(Source: MSCI)
I use MSCI's ESG ratings which compare a company's long-term sustainability and governance against its industry peers. I don't demand perfection from a company only that it has an average or better ESG profile according to MSCI.
CVX doesn't stand out for any ESG metric, but it also doesn't fall behind its peers either. Thus MSCI considers it an average ESG company and it is allowed to earn a full 3/3 management dependability score.
Putting It All Together
- 5/5 dividend safety (67% perfect safety for its industry)
- 2/3 average business model
- 3/3 management dependability
- 9/11 blue-chip quality dividend aristocrat
So if CVX is so great and offering a safe, dependable, and steadily growing 7.1% yield, why don't I recommend it?
All Oil Stocks Are Speculative In This Pandemic
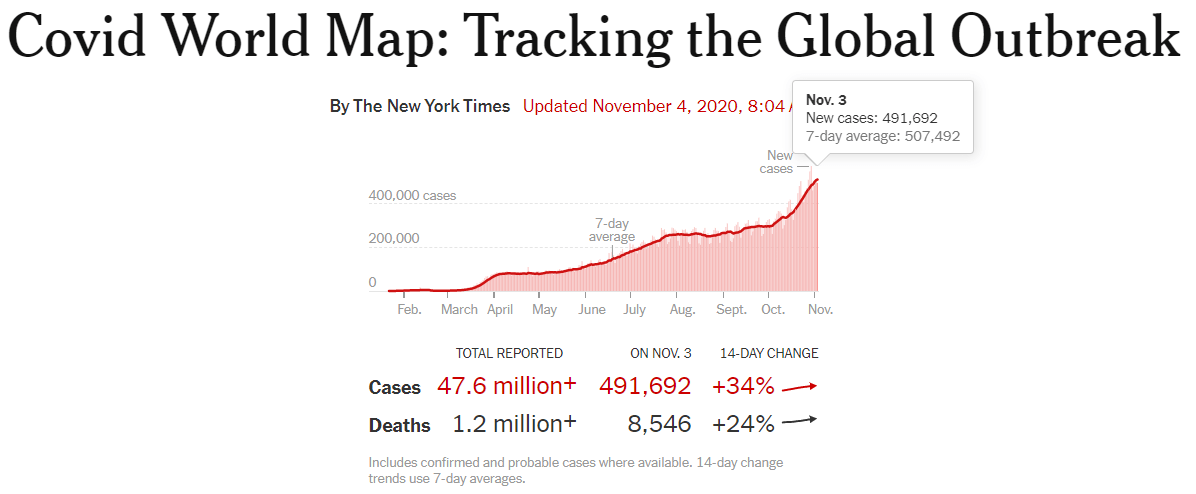
You may have noticed viral cases surging out of control in the US and globally in recent weeks.
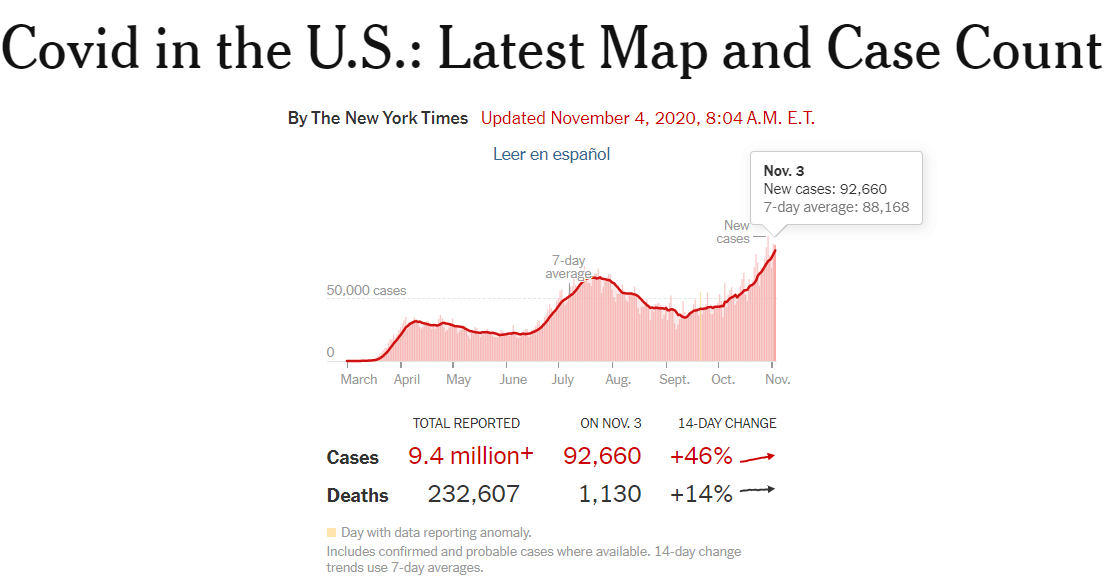
Much of Europe is locking down again, though not as severely as in March and April. Health experts don't expect the US will have the stomach for such economic pain and thus will simply do our best with our current social distancing efforts.
- thus far my Dividend Kings Weekly Recession Updates confirm via high-frequency indicators that US consumers are mostly ignoring the rampaging virus
- Just like we did in January and February
- Until rising deaths reach an intolerable level and then there is a risk of more knee-jerk reactions from state and local governments
- as well as consumers simply choosing to stay home (which MIT estimates caused 90% of the economic carnage in early 2020)
The Institute for Health Metrics & Evaluation, or IHME, estimates that without sufficient reduction in social mobility, we could see deaths hit as much as 8,400 by February 1st and total US deaths hit 623K.
In other words, as long as this virus is out of control in the US and globally, there is a risk of another oil crash similar to what we saw in April, when crude briefly hit -$38.
Chevron Growth Consensus Estimates
| Metric | 2020 consensus growth | 2021 consensus growth | 2022 consensus growth |
| Dividend | 1% | 5% | 7% |
| Operating Cash Flow | -54% | 73% | 21% |
| EBITDA | -35% | 47% | 18% |
(Source: F.A.S.T Graphs, FactSet Research)
Analysts currently forecast very robust recovery growth for CVX in 2021 and 2022. They also expect the dividend to be raised a token 1% this year to preserve the dividend growth streak and aristocrat status.
- Long-term growth consensus: 4.5% CAGR
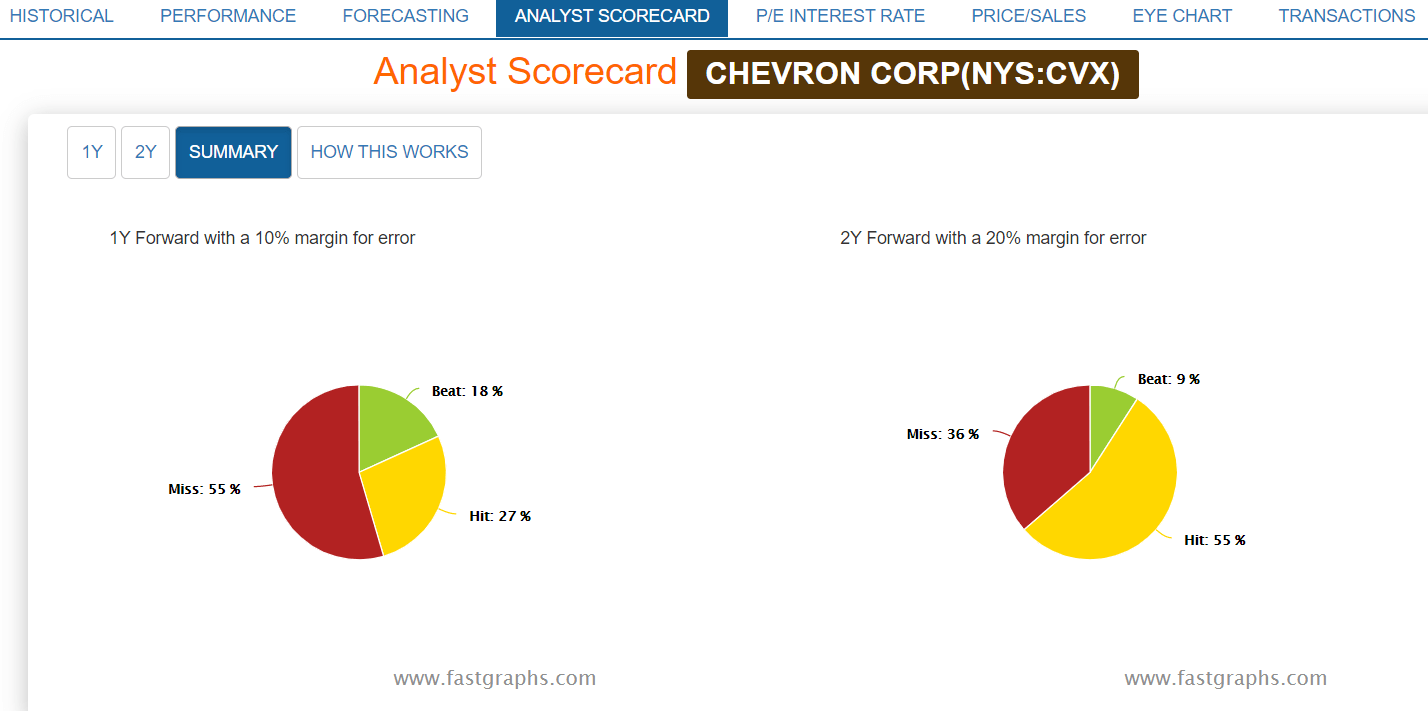
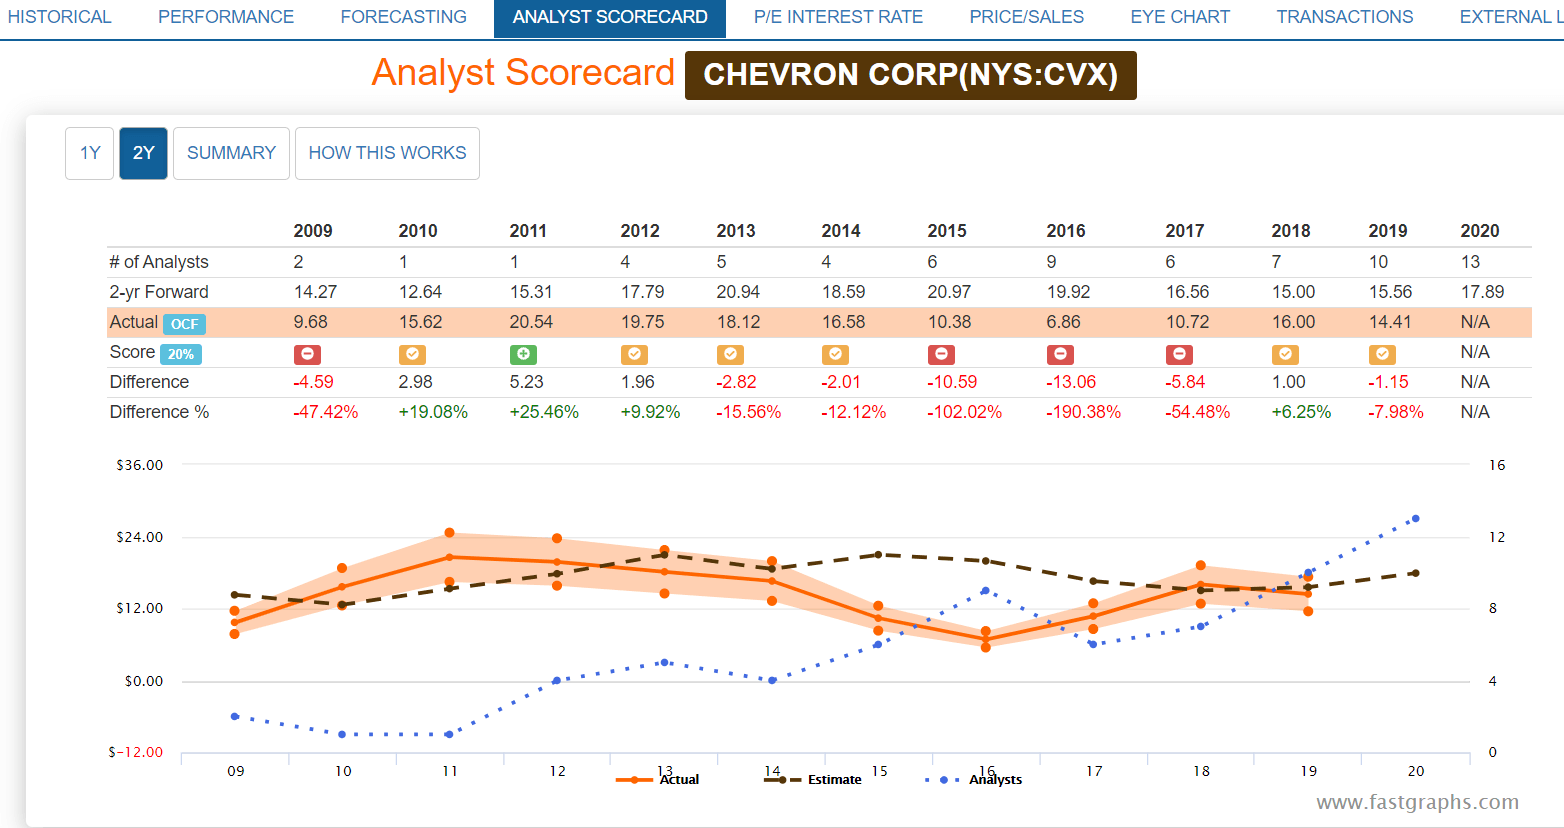
CVX's business model is volatile because it sells commodity products set at the margin on global markets. Thus it often misses consensus estimates.
- 2% to CAGR margin of error adjusted long-term growth consensus range
(Source: F.A.S.T Graphs, FactSet Research)
That range is in line with management's long-term growth plans as well as the company's historical growth rates over the last 20 years.
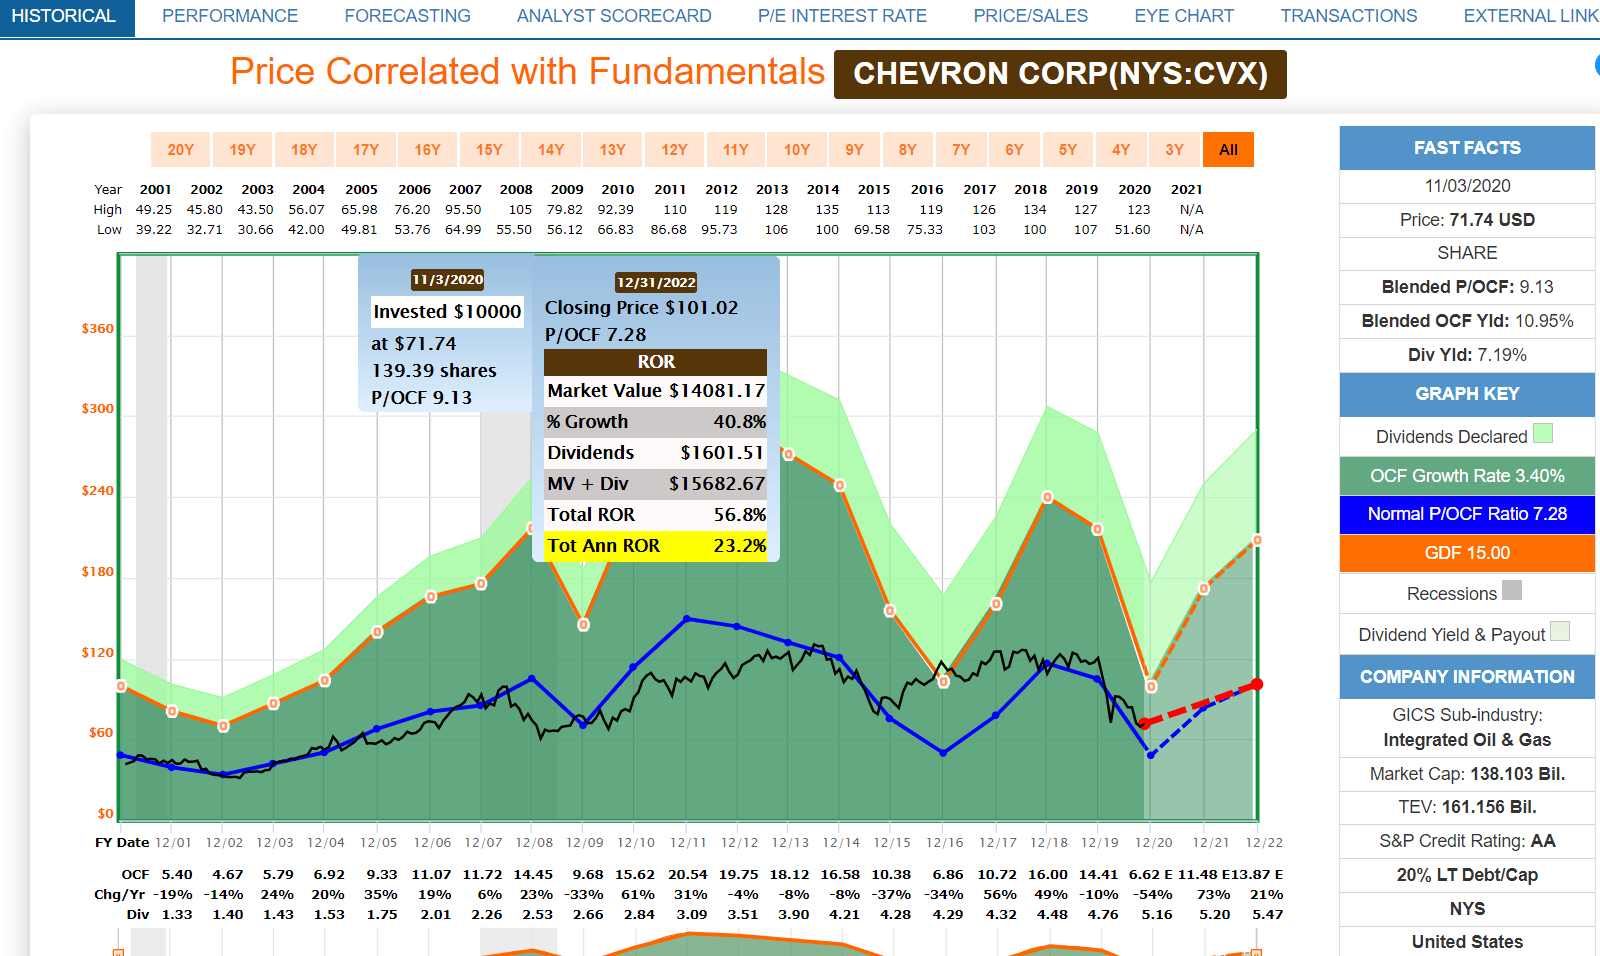
Chevron Historical Market-Determined Fair Value
| Metric | Historical Fair Value Multiples (all-years) | 2020 | 2021 | 2022 |
| 5-Year Average Yield | 4.03% | $128 | $129 | $136 |
| 13-Year Median Yield | 3.67% | $141 | $142 | $149 |
| 25-year average yield | 3.95% | $131 | $132 | $138 |
| Operating Cash Flow | 7.3 | $48 | $84 | $101 |
| EBITDA | 5.8 | $59 | $86 | $102 |
| Average | $83 | $109 | $122 | |
| Current Price | $72.64 | |||
Discount To Fair Value | 12% | 33% | 40% | |
| Upside To Fair Value | 14% | 50% | 68% | |
Annualized Total Return Potential | 119% | 41% | 27% |
(Source: F.A.S.T Graphs, FactSet Research) CVX 2021 fair value is $108 using 2021 consensus estimates and the current dividend
- 2021 fair value range: $84 to $141
- Morningstar 2020 fair value estimate: $111 (high uncertainty)
- 2021 Harmonic Average Fair Value (smooths out outliers): $108
- fair value uncertainty: 51% (high)
I rate fair value uncertainty based on the following scale, looking at the fair value range decided by the harmonic average fair value.
- 1% to 15%: very low
- 1 to 25%: low
- 2 to 50%: medium
- 51% to 75%: high
- 76+%: very high
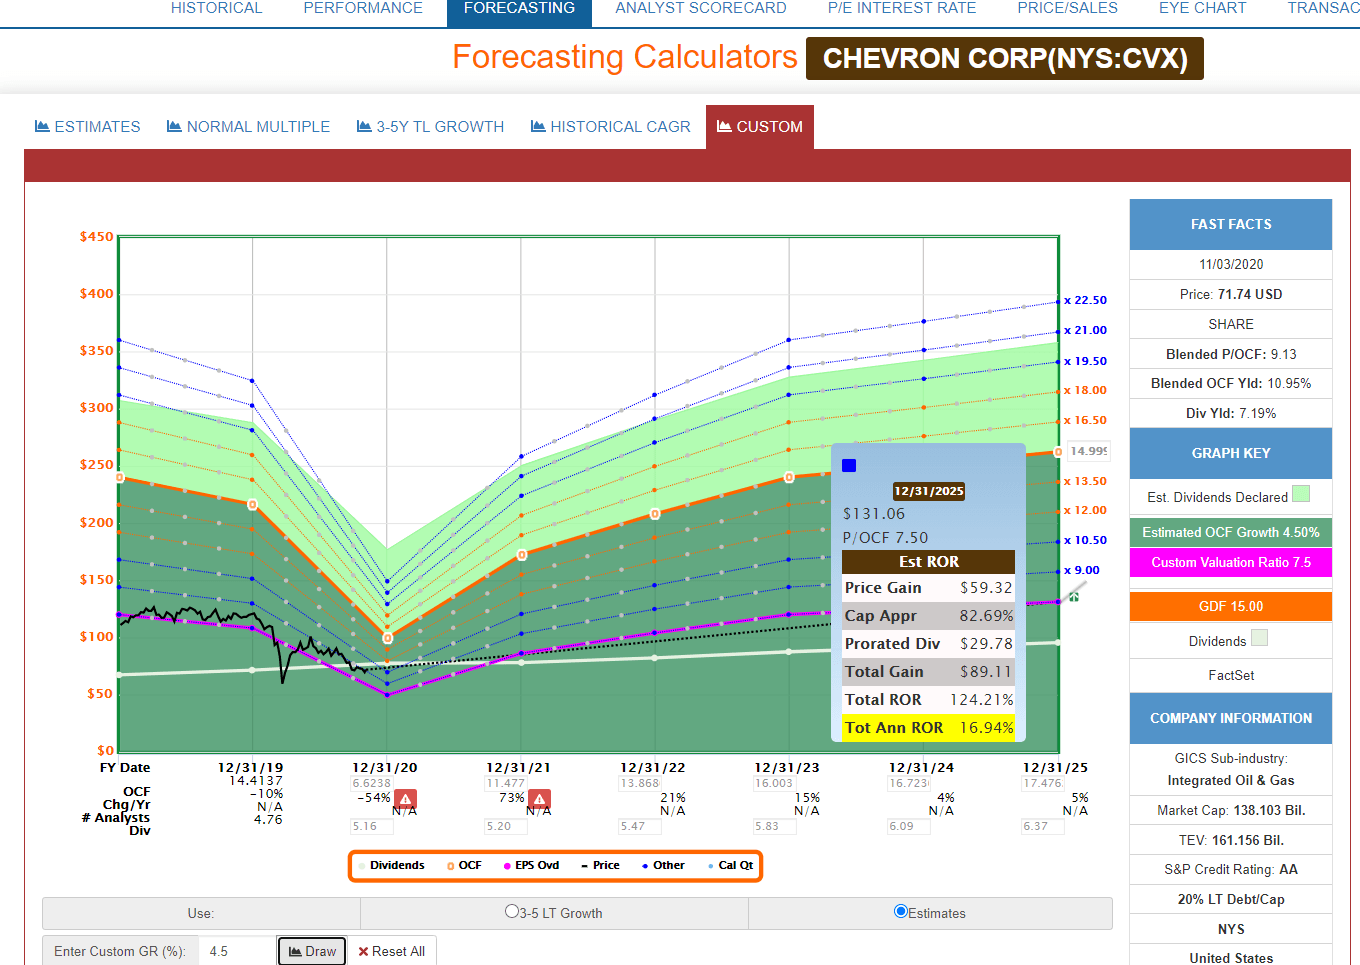
CVX 2022 Consensus Return Potential
(Source: F.A.S.T Graphs, FactSet Research)
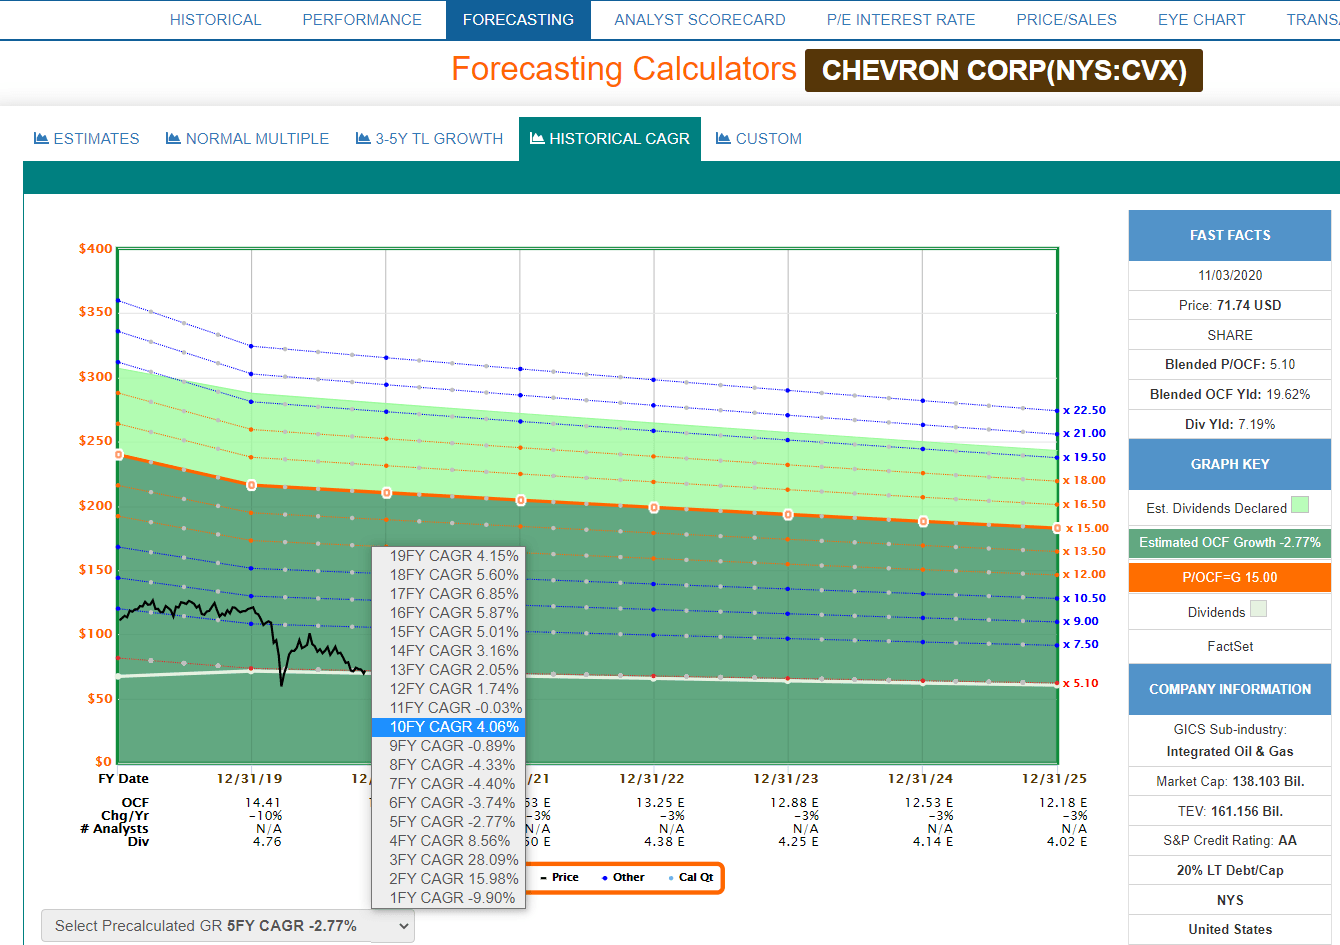
CVX 2025 Consensus Return Potential
(Source: F.A.S.T Graphs, FactSet Research)
If CVX grows as expected and returns to historical fair value by 2022 and 2025, analysts expect 23.2% CAGR and 17% CAGR total returns, respectively. That's far superior to the 4.3% CAGR consensus return potential the 33% historically overvalued S&P 500 is offering.
So why not recommend Chevron? Simply put, because you can obtain a similar safe 7% yield, with superior long-term growth potential, at even better valuations. Or to put another way, why buy Chevron when you can buy Prudential Financial?
Prudential: A Classic Buffett Style Fat Pitch That Yields A Very Safe 6.8%
- 19 out of 31 safety metrics apply to financials
- PRU scores a 85% dividend safety score
| Safety Score Out of 5 | Dividend Kings Safety Score (31 Safety Metric Model) | Approximate Dividend Cut Risk (Average Recession) | Approximate Dividend Cut Risk This Recession |
| 1 (unsafe) | 0% to 20% | over 4% | 16+% |
| 2 (below average) | 21% to 40% | over 2% | 8% to 15% |
| 3 (average) | 41% to 60% | 2% | 4% to 8% |
| 4 (above-average) | 61% to 80% | 1% | 2% to 4% |
| 5 (very safe) | 62% to 100% | 0.5% | 1% to 2% |
It earns a 5/5 safety score indicating a highly dependable dividend that conservative income investors such as retirees can trust.
Prudential Business Model Score: 2/3 Average
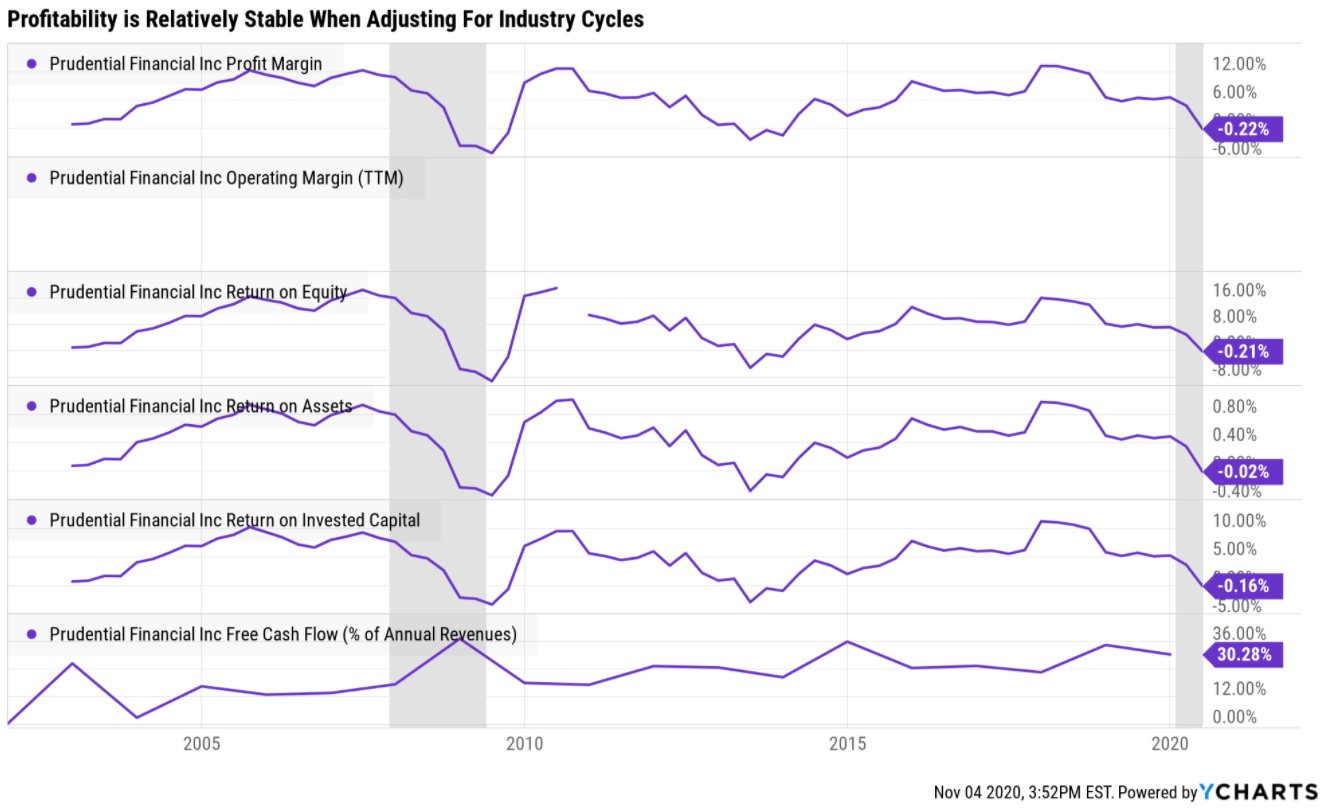
PRU's profitability is stable when adjusting for industry cycles and recessions.
- profitability about average for insurance companies.
Prudential Management Dependability Score: 2/3 Average
Morningstar considers Prudential to have average to slightly above-average quality management and I agree.
Overall, we believe Prudential merits a standard stewardship rating.
John Strangfeld spent 11 years as CEO of Prudential before retiring in 2018. Prudential’s current CEO is Charles Lowrey, who took over in December 2018. Prior to the CEO role, Lowrey ran the firm’s international business.
On the positive side, while Prudential, like most life insurers, struggled during the financial crisis and was forced to raise capital, the damage was limited and the company's balance sheet recovered relatively quickly. We also like that Prudential has actively divested noncore businesses and been selective when it comes to acquisitions, though we acknowledge the jury is still out on AssuranceIQ.
We are generally pleased with the firm’s capital return policy. In 2019, Prudential returned over $4 billion to shareholders in the form of share repurchases and dividends. Share repurchases slowed in 2020, but we expect them to resume in 2021. We also believe the firm’s focus on expense management is prudent given the relatively commoditized nature of the life insurance business.
On the negative side, Prudential has faced hiccups in the past. In 2018, Prudential boosted reserves in the long-term care business. We view being appropriately conservative when it comes to reserves as a key element of stewardship for insurance companies. That said, Prudential is not the only company to take a charge related to this line recently, and it hasn't written any new policies in quite some time." - Morningstar
The dividend growth streak and uninterrupted dividend streaks are both 12 years, since PRU cut the dividend during the Great Recession. Its balance sheet has become far more conservative since then as seen by its credit ratings.
- S&P Credit Rating: A stable outlook = 0.6 30-year bankruptcy risk
- Fitch Credit Rating: A stable outlook = 0.6 30-year bankruptcy risk
- Moody's Credit Rating: A3 stable (A- equivalent), 2.5% 30-year bankruptcy risk
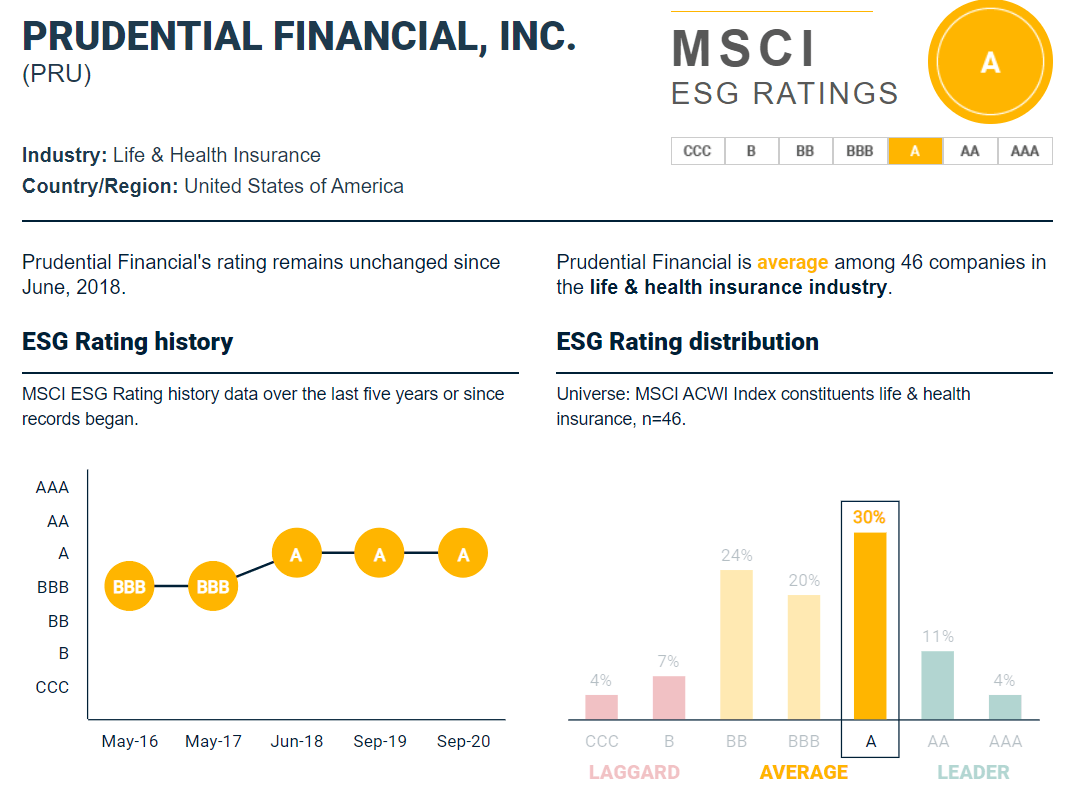
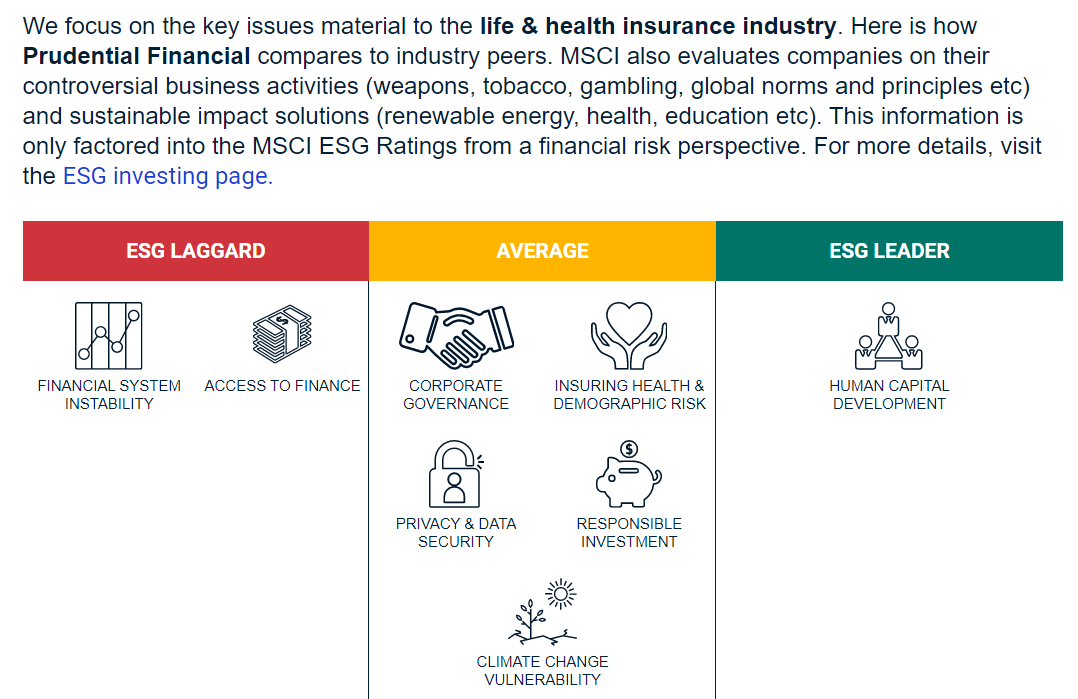
(Source: MSCI)
PRU has some areas for improvement but overall scores above-average in sustainable business practices and good corporate governance.
- 2/3 above-average dependability score
Putting It All Together
- 5/5 dividend safety (85% perfect safety for its industry)
- 2/3 average business model
- 2/3 management dependability
- 9/11 blue-chip
But supreme quality and a safe 7% yield isn't enough to recommend a company, I also need decent growth potential. Fortunately Prudential has that in spades.
Prudential Growth Consensus Estimates
| Metric | 2020 Growth Consensus | 2021 Growth Consensus | 2022 Growth Consensus |
| Dividend | 10% (official) | 5% | 5% |
| EPS | -19% | 24% | 11% |
| EBITDA | 5% | 1 | 5% |
| EBIT (pre-tax profit) | 7% | 19% | 18% |
(Source: F.A.S.T Graphs, FactSet Research)
In a year when the S&P 500 is expected to report -19% EPS growth, PRU is expected to suffer about the same. And then in the coming two years analysts expect it to deliver very strong growth. That includes two 5% dividend hikes that would extend the dividend growth streak to 14 years.
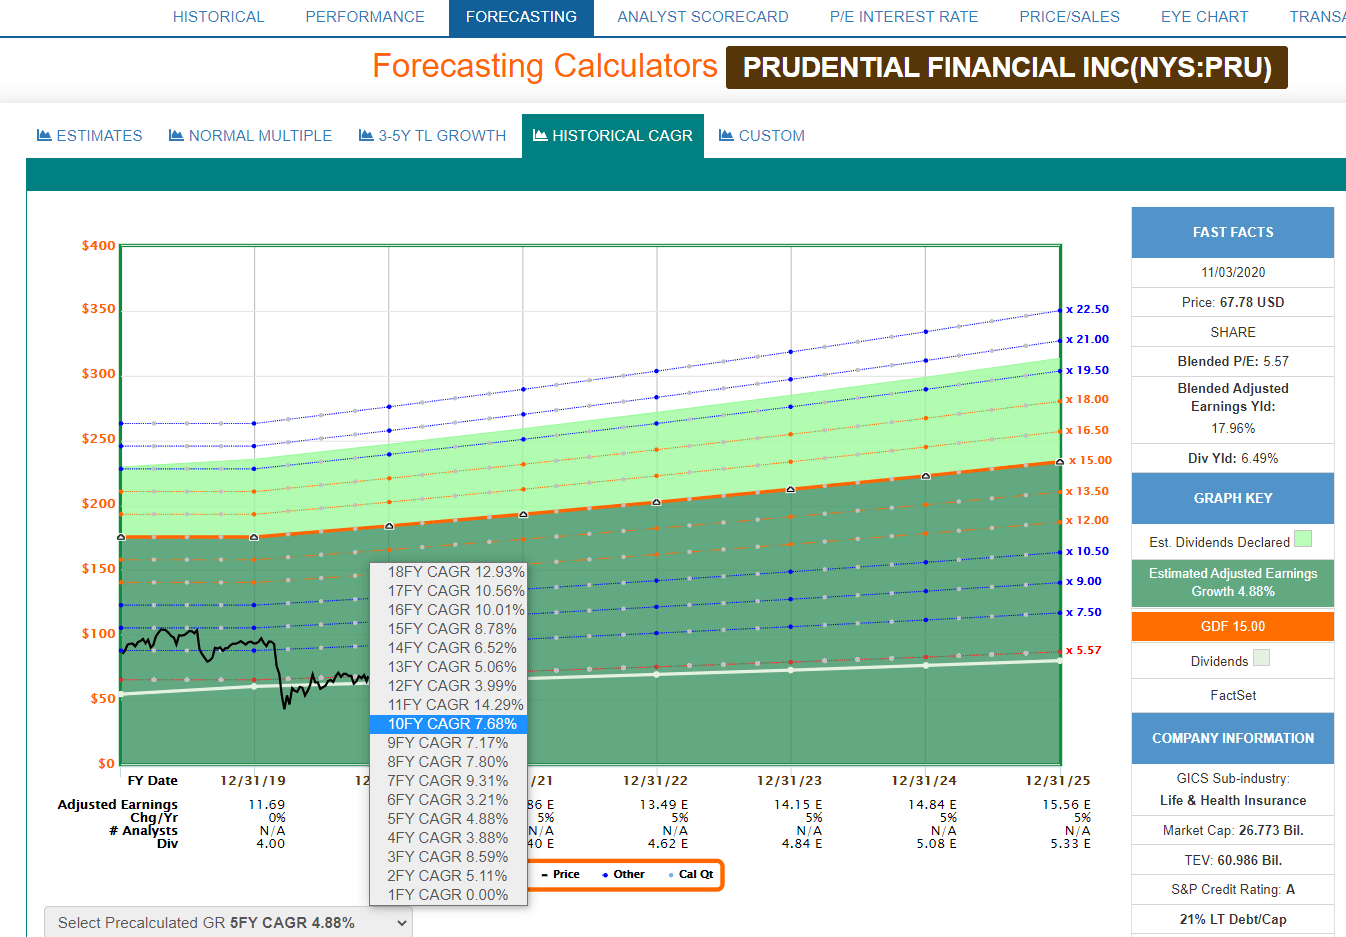
Prudential Analyst Scorecard
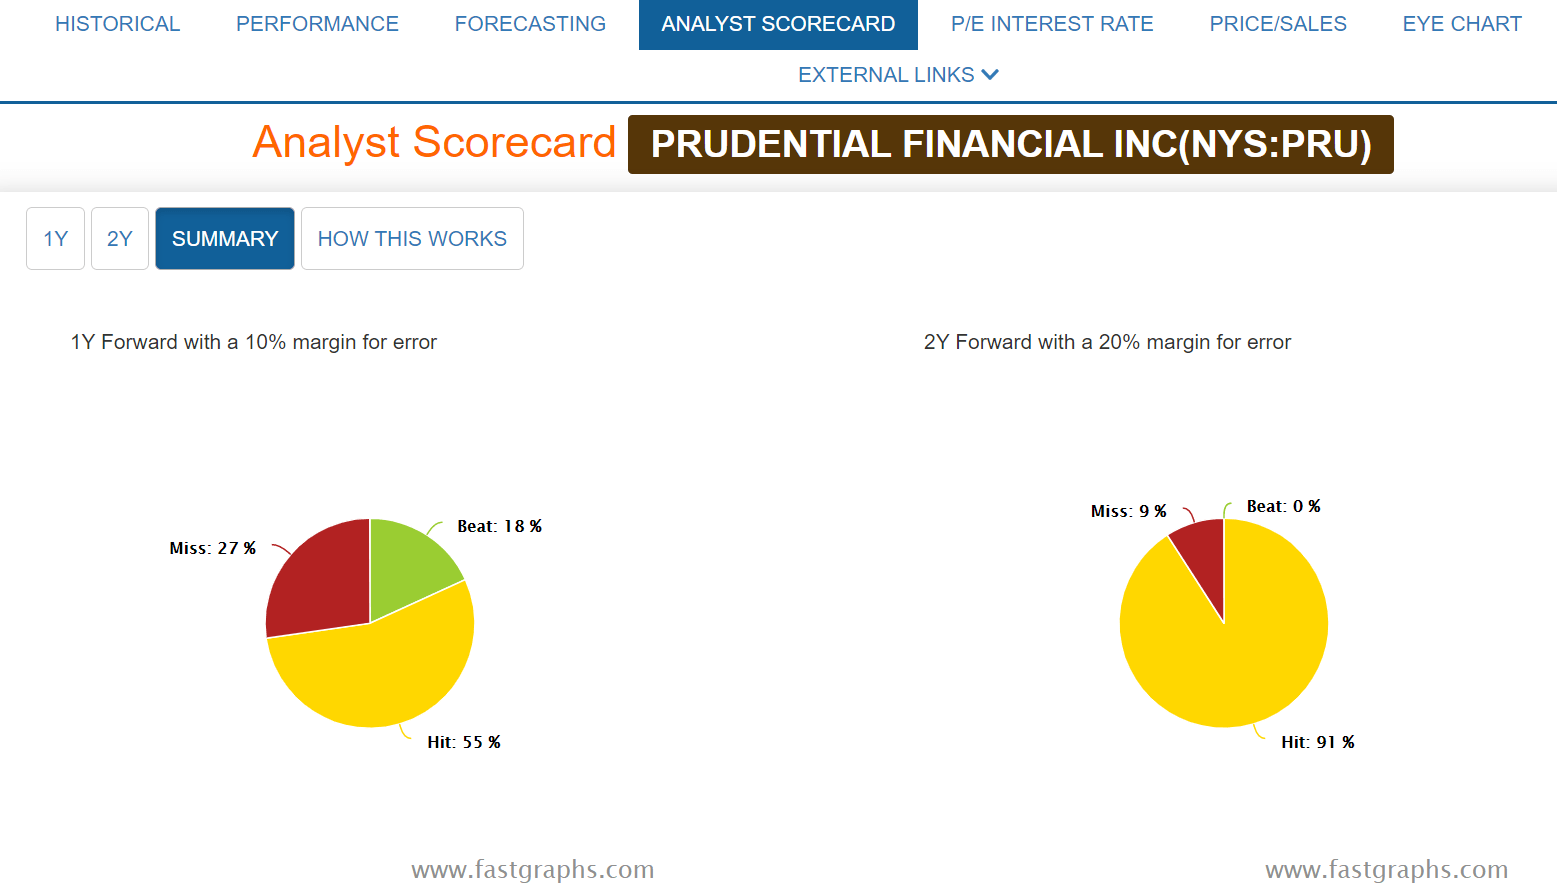

Outside of the Financial Crisis analyst margins of error is 20% to the downside and 15% to the upside.
- long-term analyst consensus growth range: 3.8% to 9.0% CAGR
- the margin of error adjusted analyst consensus growth range: 3% to 11% CAGR
(Source: F.A.S.T Graphs, FactSet Research)
Analysts expect between 8% and 9% CAGR growth outside of recessions, which is superior to the 6.4% CAGR probability-weighted consensus for the S&P 500.
- PRU yields almost 4X more than the S&P 500 and 3X more than the dividend aristocrats
- PRU is expected to grow faster than both the S&P 500 and aristocrats
- PRU is so undervalued it's priced for negative growth, which credit rating agencies, analysts and bond investors consider incredibly over pessimistic
Prudential Historical Market-Determined Fair Value
| Metric | Historical Fair Value (6 years) | 2020 | 2021 | 2022 |
| 5-Year Average Yield | 3.72% | $118 | $124 | $130 |
| 13-Year Median Yield | 2.78% | $158 | $166 | $174 |
| 18 Year Average Yield | 2.94% | $150 | $157 | $165 |
| Earnings | 9.3 | $88 | $109 | $121 |
| EBITDA | 7.3 | $103 | $120 | $126 |
| EBIT | 7.6 | $100 | $120 | $141 |
| Average | $114 | $130 | $140 | |
| Current Price | $63.09 | |||
Discount To Fair Value | 45% | 51% | 55% | |
| Upside To Fair Value | 81% | 10 | 122% | |
Annualized Total Return Potential | 3189% | 84% | 44% |
(Source: F.A.S.T Graphs, FactSet Research) PRU's 2021 fair value is $127 until the 5% dividend hike analysts expect in February 2021
- 2021 fair value range: $109 to $158
- Morningstar 2020 fair value estimate $78 (high uncertainty, based on 0.8 P/book value vs 0.84 historical and 0.38 today)
- 2021 Harmonic Average Fair Value (smooths out outliers): $127
- fair value uncertainty: 39% (medium)
Prudential 2022 Consensus Return Potential
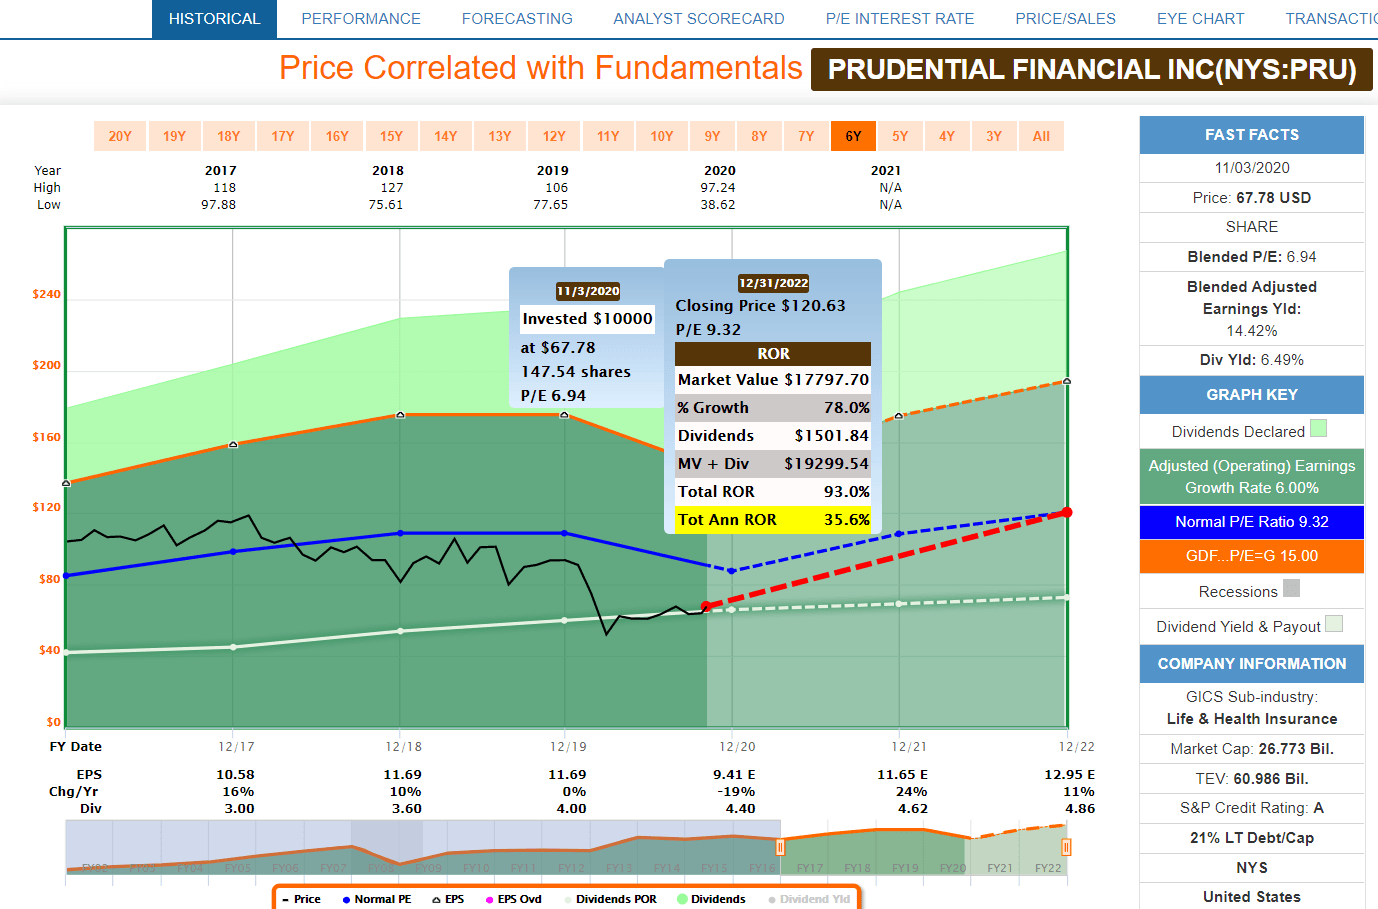
(Source: F.A.S.T Graphs, FactSet Research)
Note that this doesn't take into account PRU's decline today which boosts the 2022 consensus return potential to about 39% CAGR or about 10X that of the S&P 500.
Prudential 2025 Consensus Return Potential
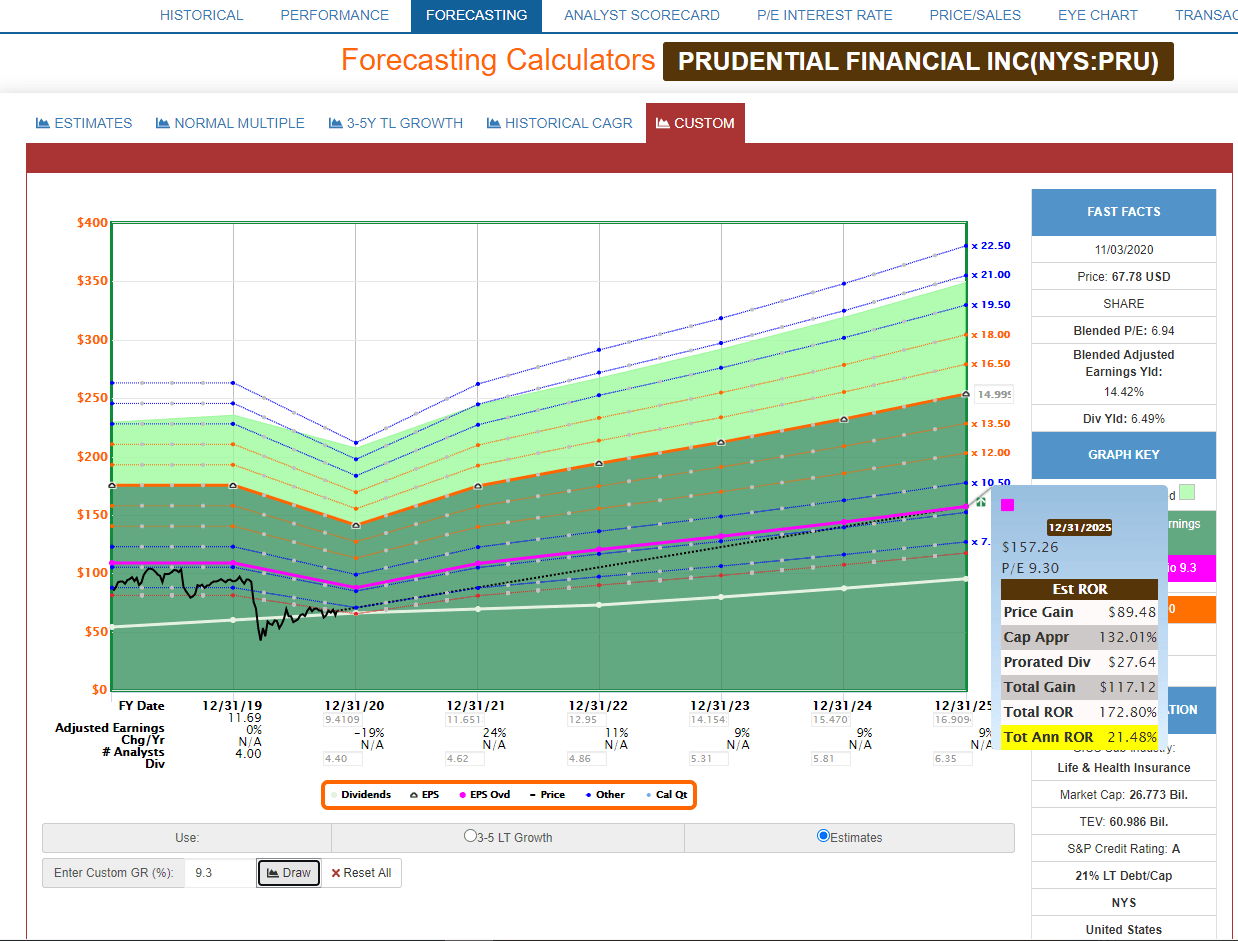
(Source: F.A.S.T Graphs, FactSet Research)
- accounting for today's CAGR decline the 5-year consensus return potential is about 22.5% CAGR
- S&P 500's 5-year consensus return potential is about 4.3% CAGR
- S&P 500 30+ year total return consensus is 8.2% CAGR
- PRU's is 15.0% CAGR, almost twice as much
Prudential Investment Decision Score
I never recommend a company, much less put my own money at risk, without first knowing exactly how prudent a potential investment it is relative to the S&P 500, most people's default alternative.
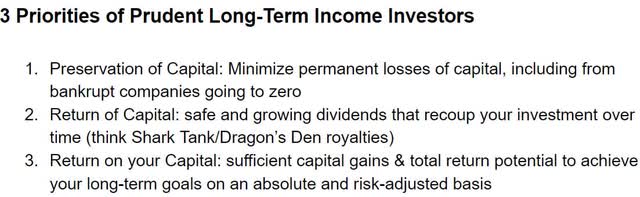
The investment decision score is based on valuation and the three core principles of all successful long-term investors.
| Ticker | Quality Score | Dividend Safety Score | Investment Grade | 5Yr Risk Adj. Return | |
| PRU | 9 | 5 | A+ | 16.8% | |
| Goal | Scores | Scale | Interpretation | ||
| Valuation | 4 | Ultra-Value Buy | PRU's 50.32% discount to fair value earns it a 4-of-4 score for valuation timeliness | ||
| Preservation of Capital | 7 | Excellent | PRU's credit rating of A implies a 0.6 chance of bankruptcy risk, and earns it a 7-of-7 score for Preservation of Capital | ||
| Return of Capital | 10 | Exceptional | PRU's 43.2% vs. the S&P's 10.30% 5-year potential for return via dividends earns it a 10-of-10 Return of Capital score | ||
| Return on Capital | 10 | Exceptional | PRU's 16.8% vs. the S&P's 3.2% 5-year risk adjusted expected return earns it a 10-of-10 Return on Capital score | ||
| Total Score | 31 | Max score of 31 | S&P's Score | ||
| Investment Score | 100% | Exceptional | 73/100 = C(Market Average) | ||
| Investment Letter Grade | A+ | ||||
(Source: Dividend Kings Automated Investment Decision Tool)
Prudential is one of the most reasonable and prudent high-yield blue-chip investments conservative income investors can make today. In fact, it's as close to a perfect high-yield investment as you can expect to find at any given time in the stock market.
In fact, I've bought Prudential twice just today, due to limit orders filling. I couldn't be happier to be locking in a very safe 7.0% yield at these anti-bubble prices.
Bottom Line: Don't Settle For Safe 7% Yield With Chevron When Far Superior Prudential Offers Superior Overall Fundamentals
Don't get me wrong, anyone buying Chevron at today's safe 7% yield is likely to earn about 11% to 12% CAGR long-term returns. That's assuming it grows as expected and returns to historical fair value over time.
But with Prudential you get the same yield, but much safer, courtesy of a less cyclical and slightly more predictable business model. What's more you get a far higher margin of safety because Prudential is trading at 5.4X 2021 consensus earnings, and priced for -6.2% CAGR long-term growth.
As long as Prudential grows at a positive rate, long-term income investors who own it within a diversified and prudently risk-managed portfolio literally can't lose money over time. That's as long as you're willing to tolerate periods of intense short-term volatility such as today's 7% plunge, which had nothing to do with the fundamentals of the company.
 (Source: AZ Quotes)
- good long-term investors tolerate volatility and pray for luck in the stock market.
- great long-term investors embrace and harness it to make their own luck.
----------------------------------------------------------------------------------------
Dividend Kings helps you determine the best safe dividend stocks to buy via our Automated Investment Decision Tool, Company Screening Tool, & Research Terminal.
Membership also includes
- Access to our five model portfolios
- Daily Blue-Chip Deal Videos
- 50% discount to iREIT
- 50 exclusive articles per month
- Our weekly podcast
- 20% discount to F.A.S.T Graphs
- Real-time chatroom support
- Exclusive daily updates to all my retirement portfolio trades
- Our "Learn How To Invest Better" Library
- Access to numerous valuable investing tools
Click here for a two-week free trial so we can help you achieve your financial goals while sleeping well at night in all market & economic conditions.
Disclosure: I am/we are long PRU. I wrote this article myself, and it expresses my own opinions. I am not receiving compensation for it (other than from Seeking Alpha). I have no business relationship with any company whose stock is mentioned in this article.
Additional disclosure: Dividend Kings owns PRU in our portfolios.
