The Outlook For Growth Continues To Improve

A collection of charts with the latest data and some brief commentary.
Strong improvement in export orders for US manufacturers. A good sign that global economic outlook is improving.
The market is pricing in an increase in future corporate profits.
On the eve of our historic election, here's a collection of charts with the latest data and some brief commentary:
Chart #1
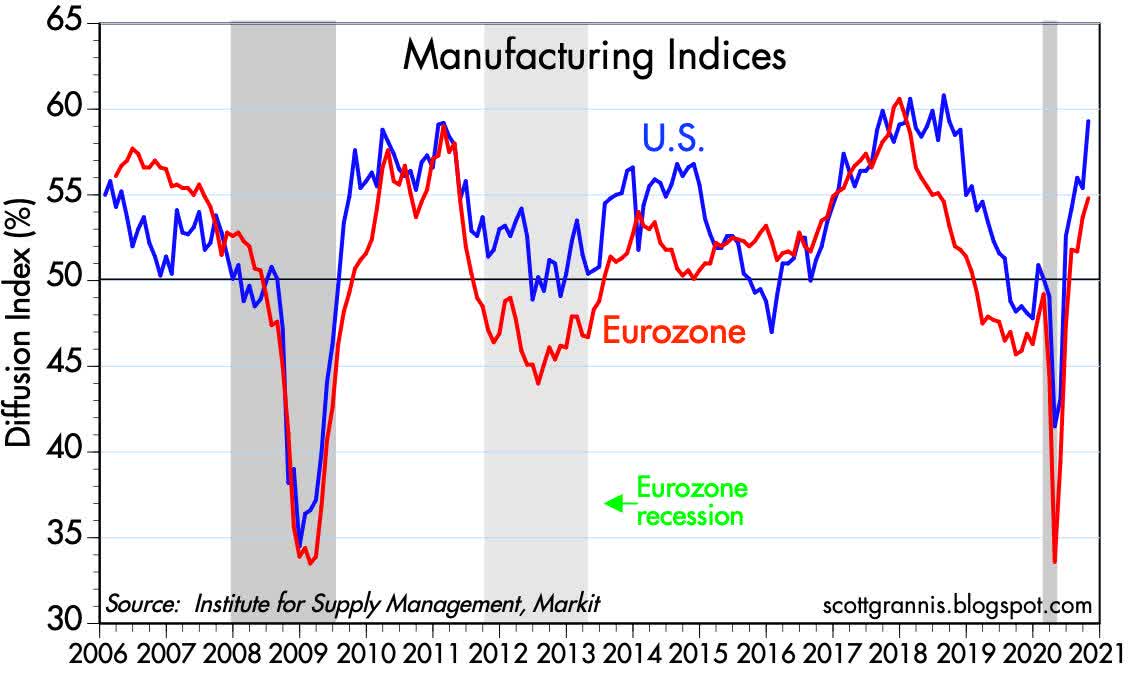
Chart #1 compares the US ISM manufacturing survey with that of the Europe. Conditions in both areas have improved dramatically in the past several months, but the US outlook is even brighter - almost as strong as it was a few years ago.
Chart #2
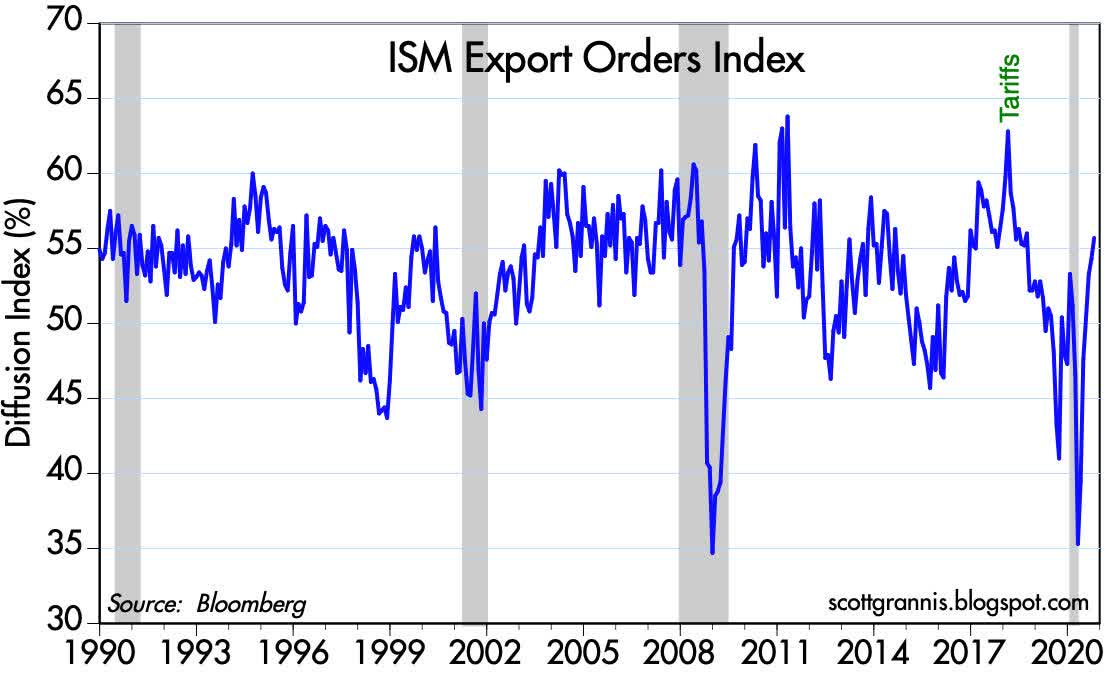
Chart #2 shows strong improvement in export orders for US manufacturers. This is a good sign that the global economic outlook is improving.
Chart #3
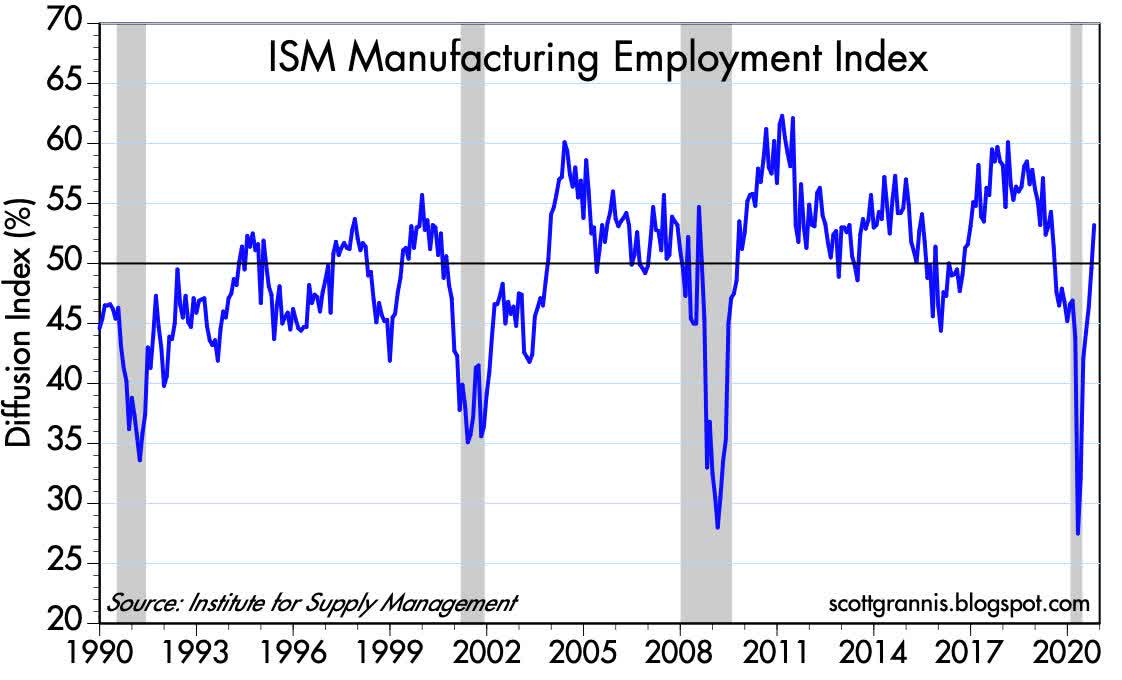
Chart #3 tells us there has been a much, much-needed improvement in manufacturers' outlook for new hiring. That also implies a new willingness to invest and expand operations.
Chart #4
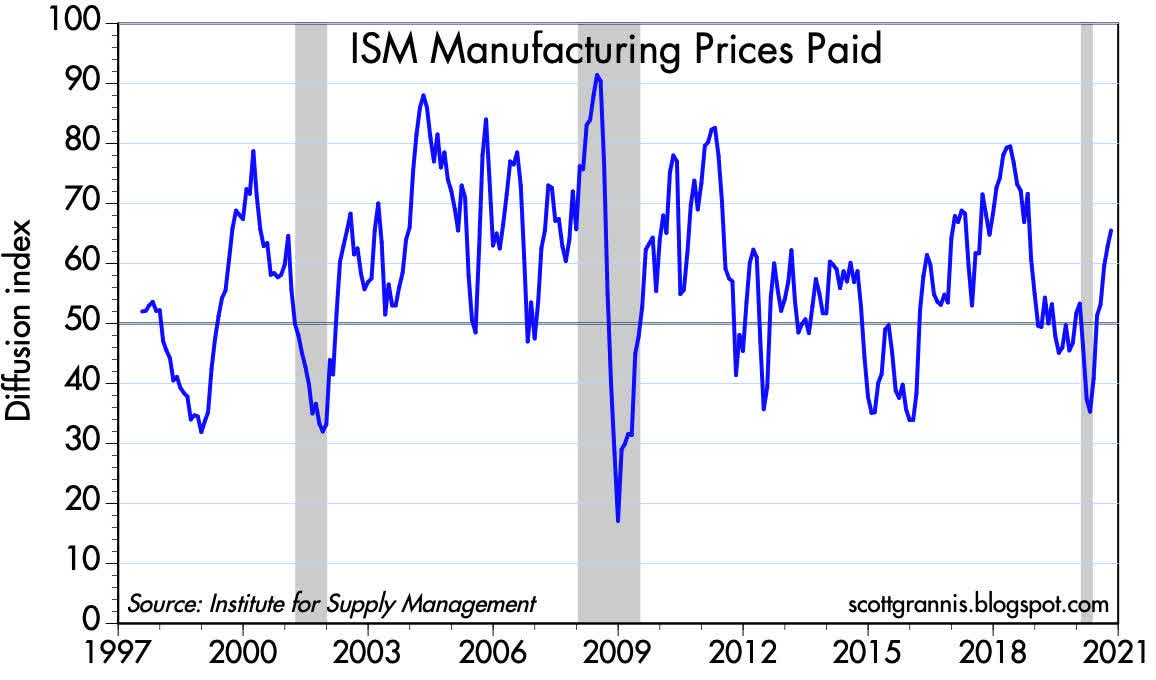
Chart #4 shows that a majority of manufacturing firms are seeing price increases in the things they buy. This confirms that monetary policy is accommodative, and at the very least it means that liquidity is abundant. The Fed poses no threat to the outlook for improved growth.
Chart #5
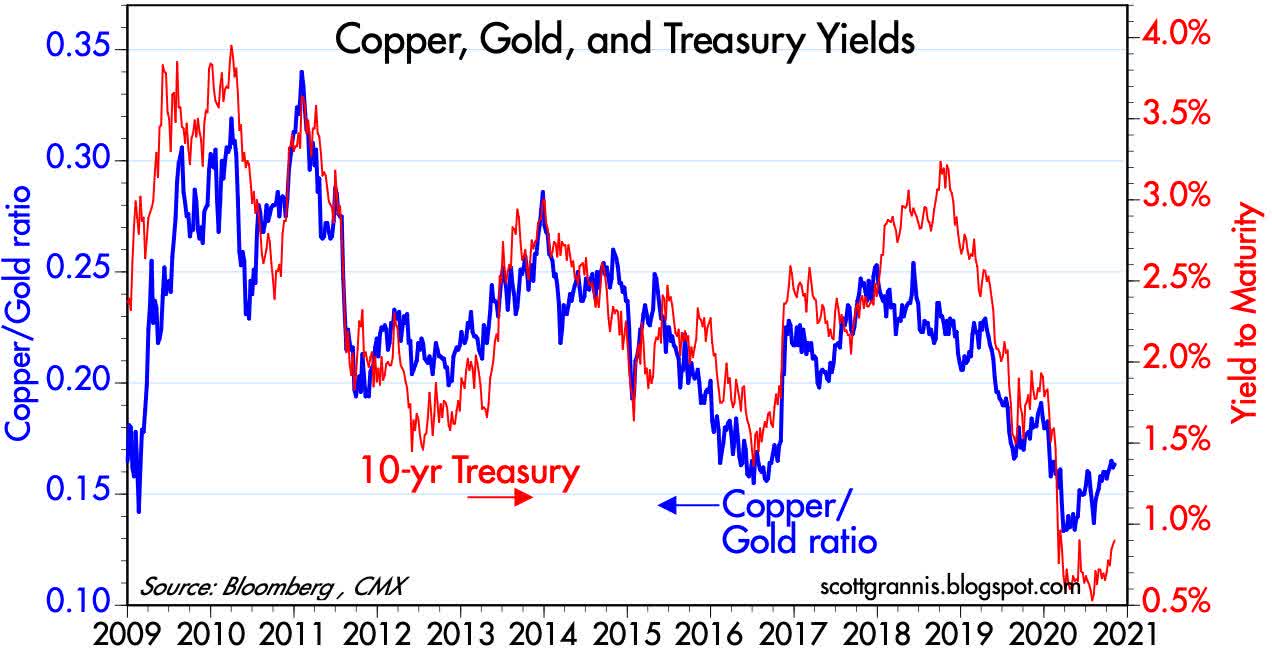
Chart #5 compares the ratio of copper to gold prices (blue) to the level of 10-yr Treasury yields (red). Both appear to have bottomed out; that in turn is strongly suggestive of a nascent rebound in growth expectations both in the US and around the world. 10-yr Treasury yields today reached 0.9%, which is their highest post-Covid level. Yields are still extremely low from an historical perspective, which is consistent with their being still a lot of risk aversion priced into the market (i.e., people are still willing to pay extremely high prices for the safety of Treasuries). Optimism is returning, but only by a little.
Chart #6
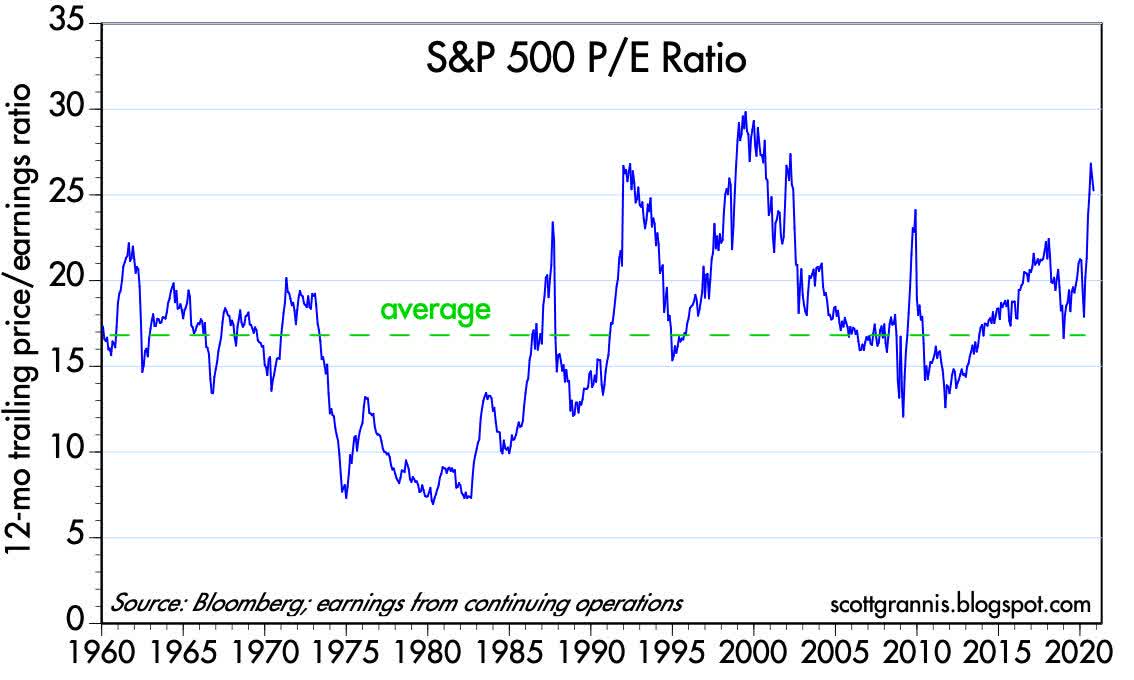
As Chart #6 shows, the PE ratio of the S&P 500 Index is quite high (a bit over 26 as I write this). Does this mean the market is over-valued and primed for a crash? Not necessarily. The market understands that corporate profits have plenty of room to grow, being still depressed after the huge Covid-induced economic crash we are still recovering from, so an elevated PE ratio today only means that the market is pricing in an increase in future corporate profits.
Today, the market expects profits (EPS) over the next year to grow by about 8% from current levels; that would leave next year's earnings per share about 12% higher than they were last year.
Chart #7
Stocks don't exist in a vacuum, however. Investors have a choice between the expected returns on stocks or the guaranteed returns on Treasury bonds. The higher the price one pays for a security, the lower the expected return. Today, Treasuries (and their close cousin cash) are trading at very high prices historically, though they have dropped a bit of late.
Cash is more "expensive" to own than every before: it yields either zero if held in the form of currency or in some savings deposits, and a minuscule 0.09% if held in the form of ultra-safe and extremely liquid T-bills. Meanwhile, inflation is running at least 1.5% per year. So the real return on cash is negative: holding cash implies losing about 1.5% of your purchasing power every year.
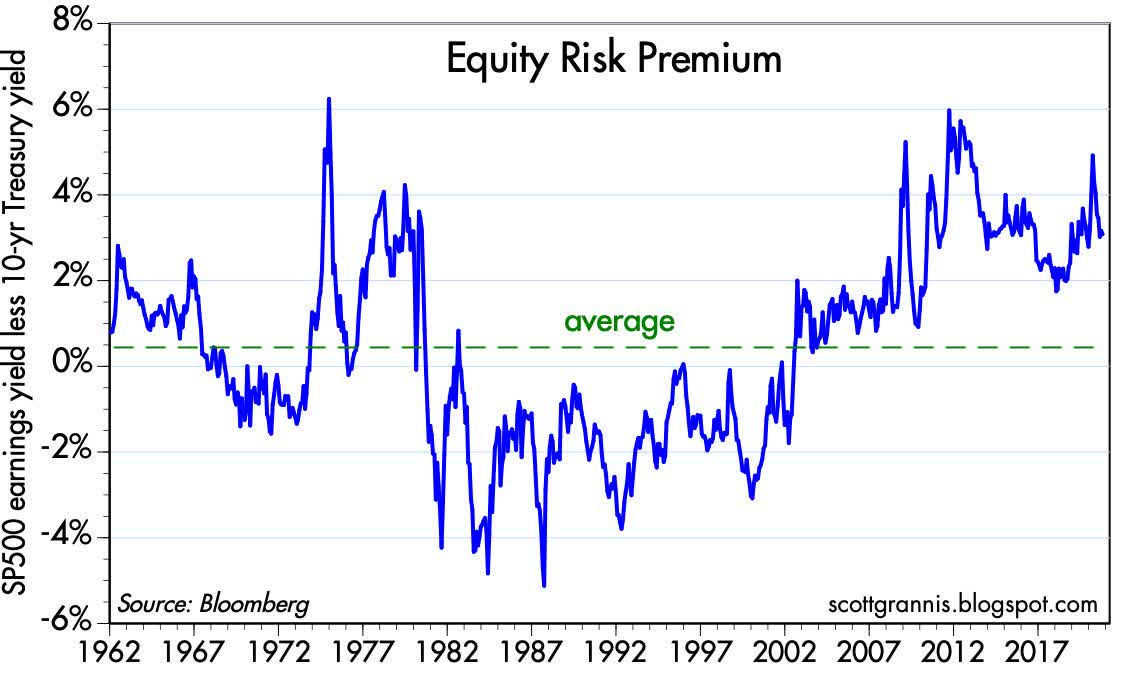
Holding cash is a losing strategy, and even holding 10-yr Treasuries (0.9% yield) is a loser in terms of purchasing power. But stocks have an earnings yield (the inverse of their PE ratio, which is the dividend yield an investor would receive if companies paid out all their earnings in the form of dividends) of about 3.8%. That represents a "risk premium" over 10-yr Treasuries of almost 2%.
As Chart #7 shows, stocks today are not at all expensive relative to Treasuries (e.g., when the risk premium is negative, they are expensive). The reason stocks are "cheap" relative to Treasuries can be easily explained by the prevailing preference among investors to pay up for safety. Risk aversion is alive and well.
Chart #8
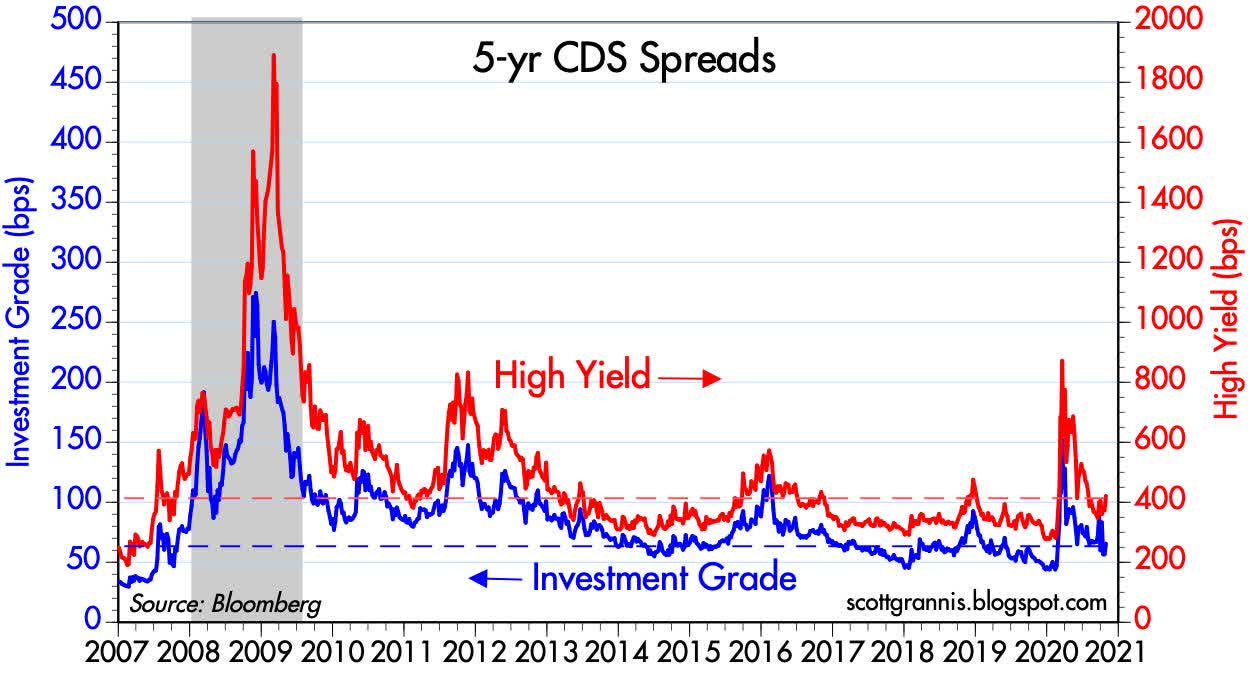
Chart #8 shows Credit Default Swap spreads, which is a measure of the cost of hedging oneself against the risk that corporate bonds default. That cost today is pretty low from an historical perspective, which means the market-despite the prevailing mood of risk aversion which makes stocks relative cheap-is fairly confident in the outlook for corporate profits and, by inference, for the health of the economy. It also indicates that liquidity is plentiful.
Chart #9
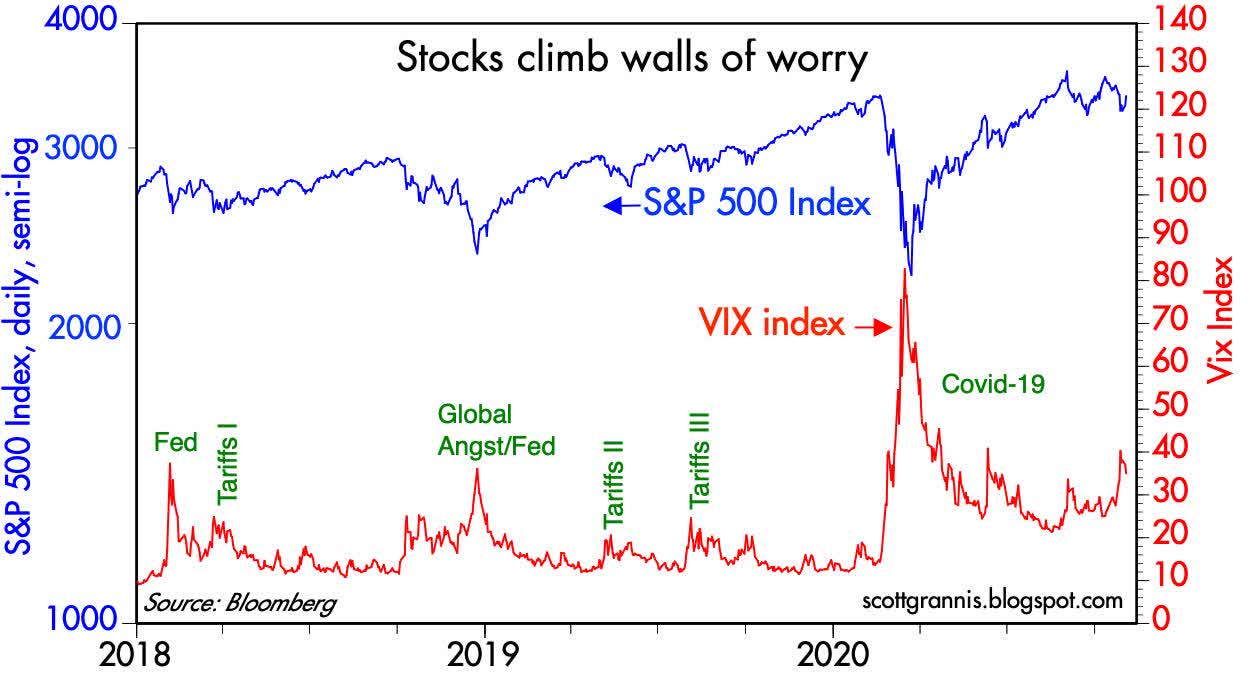
Chart #9 sums it all up. The Vix (fear) index is still quite elevated, and the stock market is trading today at about the same level as before the Covid crisis struck. The stock market is priced to some bad news (according to the Vix index), so it is not necessarily vulnerable to a negative news shock.
And with that I'm going to sit back and watch the election returns. Biden has been leading strongly in the polls until recently, and now it's possible Trump could snatch a victory from the impending jaws of defeat. It's going to be a wild ride no matter what. My fingers are crossed for Trump, mainly because I am sure his policies would be much more likely to deliver a prosperous economy than Biden's.
Editor's Note: The summary bullets for this article were chosen by Seeking Alpha editors.
