BlackSwan ETF Outshines Through Yet Another Market Pullback

The markets underwent yet another period of turbulence in September, and the Amplify BlackSwan ETF was tested once again.
Since the September 2 peak in the S&P 500, SWAN produced the same returns as the benchmark, but with a much better risk profile.
Were I to set up a simple growth portfolio, I would seriously consider SWAN as a replacement to most of my stock-only holdings.
Back in July, I wrote about the Amplify BlackSwan Growth & Treasury Core ETF (NYSEARCA:SWAN). I concluded that the fund was "compelling due to its asymmetric risk-reward profile", although I also saw "a couple of problems with it that could be easily solved".
The young ETF has already seen enough market disruption to test its investment strategy, despite it being around for only two years. Through the February and March bear market, SWAN dropped substantially less than the S&P 500 (NYSEARCA:SPY), even though it had been performing on par with the equities benchmark since inception. So far so good.
But, in September, the markets underwent yet another period of turbulence, with the S&P 500 dropping nearly 10% from peak to trough. Today, I look at how SWAN has handled another bump in the road.

Credit: Yuting Liu
A very quick recap
Before diving into the data, let me quickly revisit SWAN's investment philosophy - see my previous article for more information.
The fund is essentially a modified 60/40 portfolio of ten-year treasuries and stocks, in this order, but with notable improvements:
- the equity exposure is achieved through long call options, which limits the downside risk to stocks in exchange for some decayable option premium.
- to compensate for the lower expected returns on the treasury side, the ETF is effectively leveraged at a factor of about 1.5x. This is achieved through the 10% initial amount allocated to stock options, which tends to represent exposure of about 50% to 60% of the total assets to stocks.
Below is a pie chart depicting the ETF's current holdings:
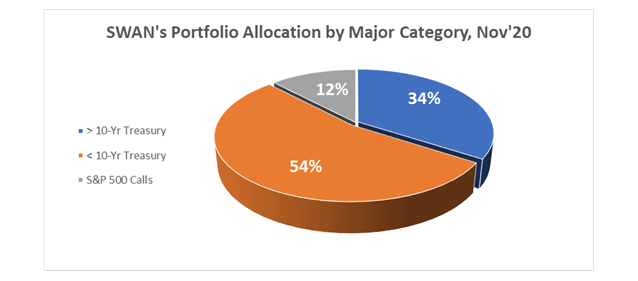
Source: DM Martins Research, data from Amplify
Good performance in September
Now, let's turn our attention to the performance of SWAN since September 2, i.e. through the most recent period of softness in the stock (and bond, mind you) market.
The chart and table below summarize the observations and compare SWAN (thick blue line) to (1) the S&P 500, (2) a plain 60/40 stock-and-long term treasury portfolio, and (3) a 60/90 leveraged stock-and-bond portfolio whose performance I believe SWAN should track more closely over time.
Notice a few things:
- the first three strategies above (SWAN, S&P 500, and 60/40) would have produced comparable returns of -6% since the start of the market pullback.
- but when it comes to risk and volatility, SWAN did substantially better than the broad stock market (less volatility, less severe drawdowns), and not very differently from 60/40.
- compared to 60/90, SWAN tracked closely through the first week of October, at which point the ETF began to display some resilience to further losses. This probably happened as volatility began to rise, which tends to increase the market price of options, hence benefiting SWAN.
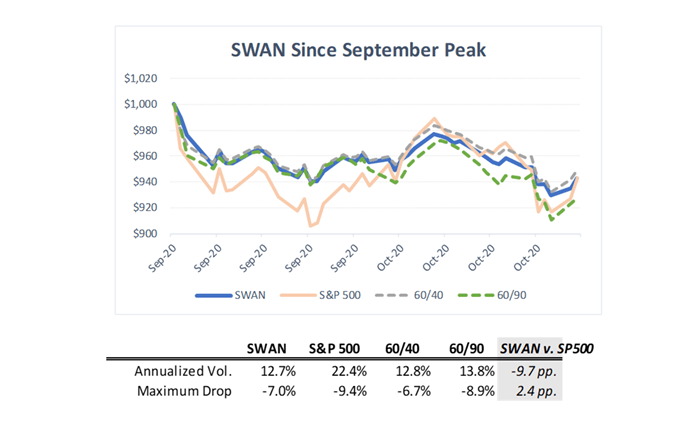
Source: DM Martins Research, data from Yahoo Finance
Keeping in mind that SWAN had been outperforming the S&P 500 since inception until September 2020, it was quite impressive to see the fund beat the risk-adjusted performance of the stock benchmark once again.
To me, this is yet another data point that supports my bullishness towards this ETF. In fact, were I to establish a core holding in my portfolio today with long-term growth in mind, I would seriously consider SWAN as a replacement to most of my stock-only holdings. This is the case because, in my opinion, SWAN represents a much better approach to the traditional 60/40 portfolio - one that is protected against sizable losses yet exposed to stock market-like gains.
Want to learn more?
The whole idea behind my Storm-Resistant Growth (or SRG) strategy revolves around the concepts described in this article. For over three years, I have been working diligently alongside my SRG premium community on Seeking Alpha to generate market-like returns with lower risk through multi-asset class diversification. To become a member of this community and further explore the investment opportunities, click here to take advantage of the 14-day free trial today.

Disclosure: I/we have no positions in any stocks mentioned, and no plans to initiate any positions within the next 72 hours. I wrote this article myself, and it expresses my own opinions. I am not receiving compensation for it (other than from Seeking Alpha). I have no business relationship with any company whose stock is mentioned in this article.
