My Current View Of The S&P 500 Index: November 2020 Edition

The IWM:SPY ratio closed above its 6- and 10-month moving averages.
I will change my allocation to 80% SPY and 20% IWM.
The bull market is still in place.
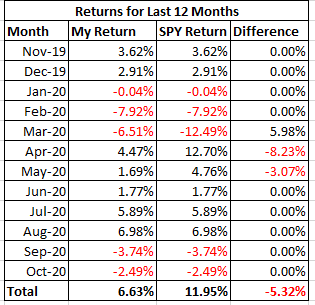
This month's article will outline why I will change the allocation of my retirement assets. I am moving 20% of my funds into the iShares Russell 2000 ETF (IWM) and I am keeping 80% of my funds allocated to the SPDR S&P 500 Trust ETF (SPY) in November. First, let me review my performance in October. Most of the equity ETFs I monitor moved lower in October. IWM was the best performer in October by being the only ETF that finished up for the month. The market, as measured by the S&P 500 index, lost 2.77%. As for my pension plan assets, I had a slightly lower loss of 2.49% in October which equaled the return of SPY. My investment objective of preserving my capital was not met; however, I did beat the overall market as measured by the S&P 500 index. Table 1 below shows my returns and allocations for the month of September and Table 2 below shows my returns for the past 12 months.
Table 1 - Investment Returns for October
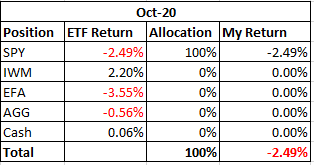
Table 2 - Investment Returns Last 12 Months
To review the purpose of this series of articles, my retirement account only allows me to buy the following four ETFs: iShares Core U.S. Aggregate Bond ETF (AGG), SPDR S&P 500 ETF, iShares Russell 2000 ETF, and iShares MSCI EAFE ETF (EFA). I can also have my money in cash. The question is how to decide where and when to allocate money to these various ETFs.
I use my moving average crossover system combined with relative strength charts to determine how to allocate my pension plan assets. My moving average crossover system uses the 6-month and the 10-month exponential moving averages to identify which of the four ETFs are in a position to be bought. If the 6-month moving average is above the 10-month moving average, then the ETF is a buy. I call this setup being in bullish alignment. When the 6-month moving average is below the 10-month moving average, the setup is referred to as a bearish alignment. When a bearish alignment happens, I don't want to hold that asset. See Chart 1 below for a long-term look at the S&P 500 index using my moving average crossover system.
Chart 1 - Monthly S&P 500 Index with 6/10 Moving Averages
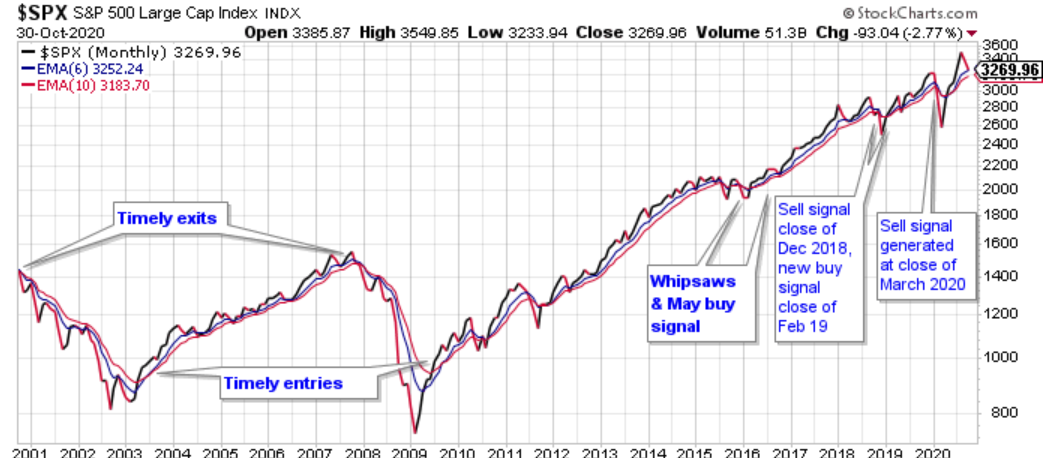
You can see that the moving average crossover system provided some excellent long-term buy and sell signals that would have allowed investors to capture long-duration moves in the index; while avoiding costly drawdowns. Avoiding these costly drawdowns allows me to meet the objective of capital preservation.
I employ this strategy because I do not want to experience a large drawdown with my pension assets. During the 2008-2009 market crash, many people didn't even look at their retirement statements because they were afraid of what they would find. I submit that if those people would have used a market strategy similar to what I outline in this series of articles, they would have been able to avoid much of the decline during the bear market and, consequently, would have had less emotional stress during that time period.
The following charts show the current status of the ETFs that I am allowed to buy in my retirement account.
Chart 2 - Monthly SPY with 6/10 Moving Averages
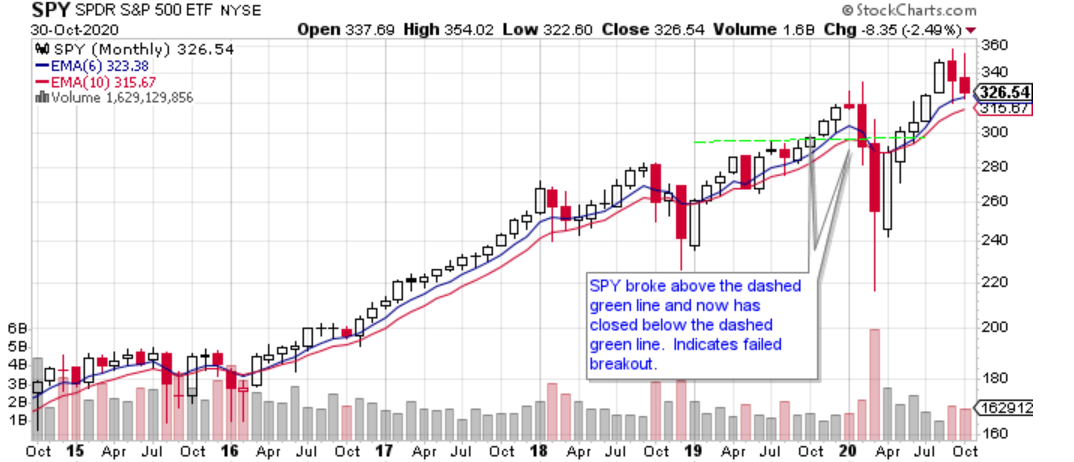
SPY lost money for the second month in a row by losing 2.49% in October. Volume in October declined from the previous month. SPY remains in bullish alignment and price remains above both moving averages. I maintain that the bull market is still in session. Consequently, I will keep 80% of my funds in SPY.
Chart 3 - Monthly IWM with 6/10 Moving Averages

Chart 3 shows that IWM had a bullish month in October. It rose 2.20% for the month and remains in bullish alignment. Volume for the month was higher than the previous month which is what you want to see if you are in the bullish camp.
Chart 4 - Monthly IWM:SPY Relative Strength
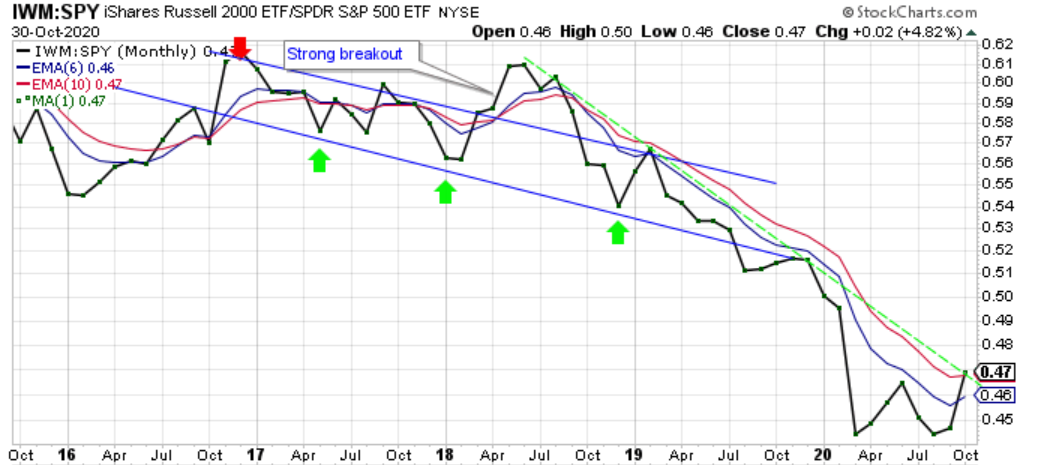
Chart 4 shows why I am allocating 20% of my assets to IWM in November. IWM outperformed SPY by 4.82% in October. I have been saying for the past few months in these articles that the IWM:SPY ratio would have to close above the 10-month moving average for me to allocate money to IWM. That condition occurred in October. With Chart 3 being in bullish alignment and Chart 4 showing a positive development in the relative strength ratio, I feel comfortable moving 20% of my funds to IWM.
Chart 5 - Monthly EFA with 6/10 Moving Averages
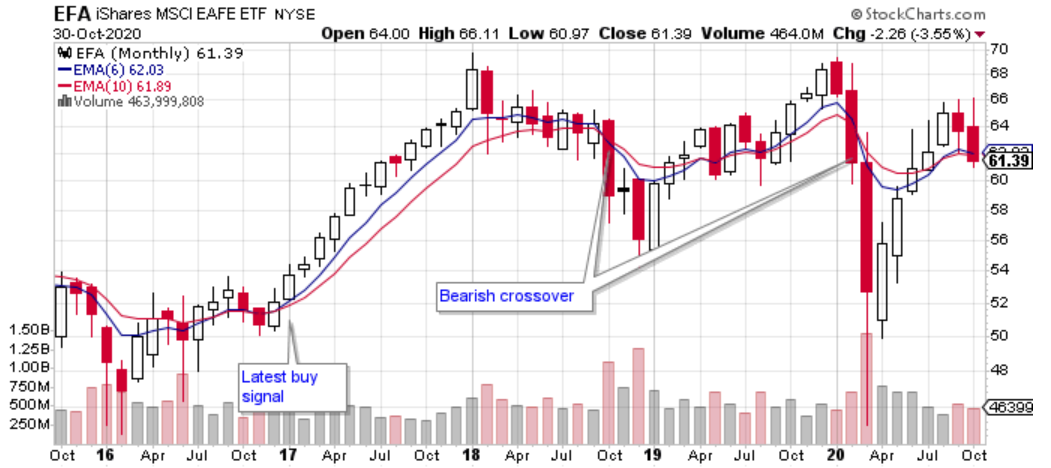
EFA lost money for the second month in a row by declining 3.55% in October. EFA closed below both moving averages while the moving averages stayed in bullish alignment. Volume was lower for the month. I believe that investors should respect the close below the 10-month moving averages.
Chart 6 - Monthly EFA:SPY Relative Strength

Chart 6 shows that EFA underperformed SPY by 1.08% in October. The ratio remains below both moving averages and the two moving averages remain in bearish alignment. As a proponent of trend following, I will wait until I see more improvement in this ratio before I allocate money to EFA over SPY. I will continue to review this ratio looking for the ratio to close above its 10-month moving average before I consider adding money to EFA.
Chart 7 - Monthly EFA:IWM Relative Strength
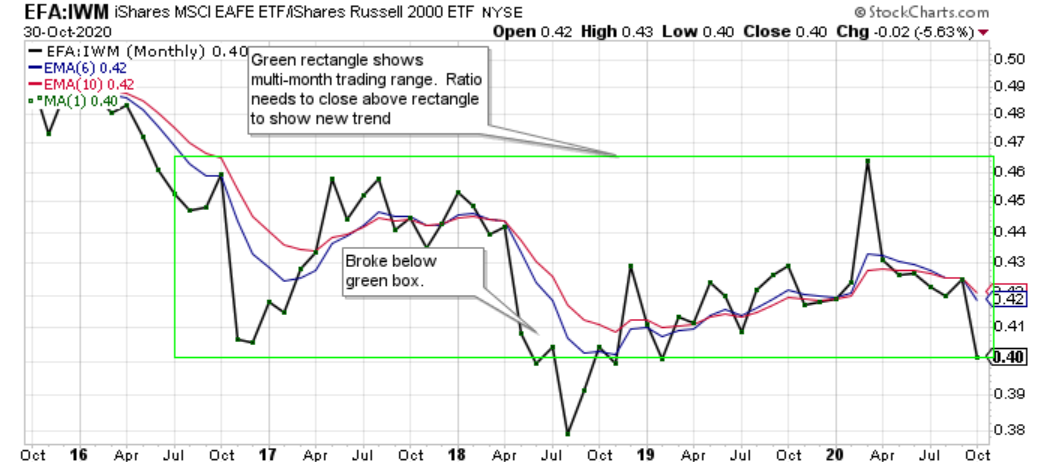
EFA underperformed IWM in October by 5.63%. The ratio remains inside the green box. Neither ETF can gain on the other. At this time, there is no compelling reason to invest in EFA over IWM. I will continue to monitor this ratio.
Chart 8 - Monthly AGG with 6/10 Moving Averages
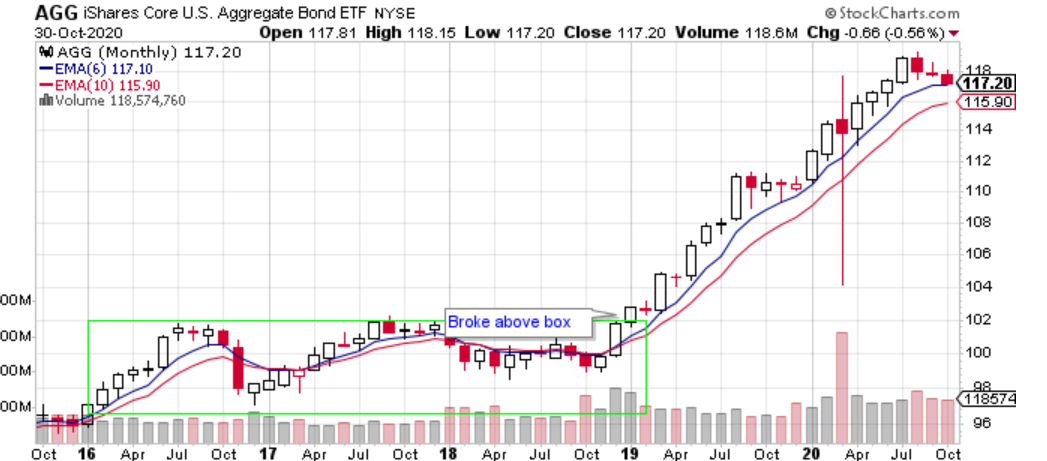
AGG also lost money in October by declining 0.56%. AGG remains in bullish alignment like SPY, IWM, and EFA and AGG closed above both moving averages.
Chart 9 - Monthly AGG:SPY Relative Strength
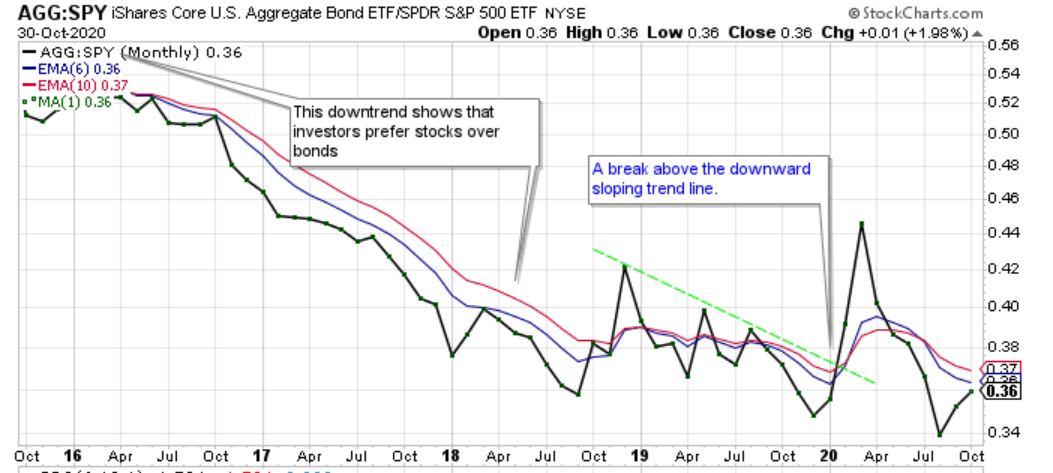
Chart 9 shows that AGG outperformed SPY by 1.98% in October. The ratio remains in bearish alignment closing below both moving averages. I will need this ratio to close above its 10-month moving average before I allocate money to AGG. I will continue to monitor this ratio and look for evidence of a change in investor preferences.
In summary, every ETF I follow lost money in October except for IWM which closed higher. More importantly to me, the IWM:SPY ratio, shown in Chart 4, closed above its 6- and 10-month moving averages. This development, combined with IWM being in bullish alignment, has influenced me to allocate 20% of my funds to IWM in November. The other 80% will be allocated to SPY as SPY is still in a bull market.
Disclosure: I/we have no positions in any stocks mentioned, but may initiate a long position in IWM over the next 72 hours. I wrote this article myself, and it expresses my own opinions. I am not receiving compensation for it (other than from Seeking Alpha). I have no business relationship with any company whose stock is mentioned in this article.
Additional disclosure: I am long SPY.
