
Ladder's valuation is being pushed and pulled by competing market forces. Its peers are in the same bucket. As the largest internally managed commercial mREIT, however, Ladder is unique.
Q3 earnings were released yesterday, making it a great time to discuss how far this commercial mortgage REIT has come and the challenges that lie ahead.
This is a story of management doing everything in its power to salvage a difficult situation. We integrate Q3 results into our full-year 2020 and 2021 outlooks.
This article was produced with Williams Equity Research ("WER")
A few days ago, I wrote an article detailing the attributes of owning blue-chips, including the list below:
- Outstanding and proven management
- A track record of effective asset deployment to create shareholder value
- Balance sheet strength and flexibility
- A sector focus with deep regional or local market expertise
- A conservative and intelligent dividend policy
- Good corporate governance
- Meaningful insider stock ownership
I pointed out that "some people want to tout Ladder Capital (LADR) and Simon Property Group (SPG) as blue chips. But they simply don’t fit the bill according to that dividend growth metric."
I added,
"Don’t get me wrong. I own Simon and Ladder, and have buy ratings on both. In fact, I’m working on an iREIT on Alpha exclusive about that second stock even now.
But I would never call a company a blue-chip when it’s sliced its dividend like that. The term should be used to signify excellence, including a conservatively intelligent dividend policy.”
The expression "you cannot get blood out of a stone" is believed to originate from a 1662 Italian proverb Universale di Proverbi Italiani before becoming popularized in an Old English proverb written in 1788.
WER's lead portfolio manager enjoys studying chess, particularly analysis of advanced games, where the phrase "squeezing water from stone" is used to describe certain late game tactics.
In a nutshell, this expression indicates accomplishing the impossible through the utilization of otherwise invisible moves or applying immense pressure to the point that the opponent breaks.
Of all the sectors we follow, none fit this description better in the current environment than mortgage REITs ("mREITs"). We believe the point of maximum pressure is behind us, but that doesn't mean much on its own.

Upon analyzing Ladder Capital’s Q2 results, we stated to subscribers that the firm continues to execute one of the most rapid and successful portfolio transitions we’d ever seen in real-time.
As a repercussion of nationwide lockdowns and an economy screeching to a halt spread throughout the financial markets, mortgage REITs and their lenders were forced to act quickly.

This included the sale of $240 million of "unsellable" loans and $439 million in securities at 96% and 97% of par, respectively, in Q2. This was no easy task or decision. Ladder also increased unrestricted cash from $358 million to $826 million in only three months.
Leverage remained in check at 3.1x, and its GAAP book equity value rose by 1% in Q2, demonstrating stability in the portfolio. As mentioned in our recent Starwood Property Trust (STWD) article, that giant mREIT ended July with 3.2x leverage.
Ladder's undepreciated book value per share $14.17 at quarter end, up $0.16 from Q1. Despite more than doubling in value from March's lows, the current stock is ~50% of undepreciated book value. Let's get a better understanding of the REIT's tailwinds and challenges for Q4 and 2021.
Cash Flows and Portfolio Update
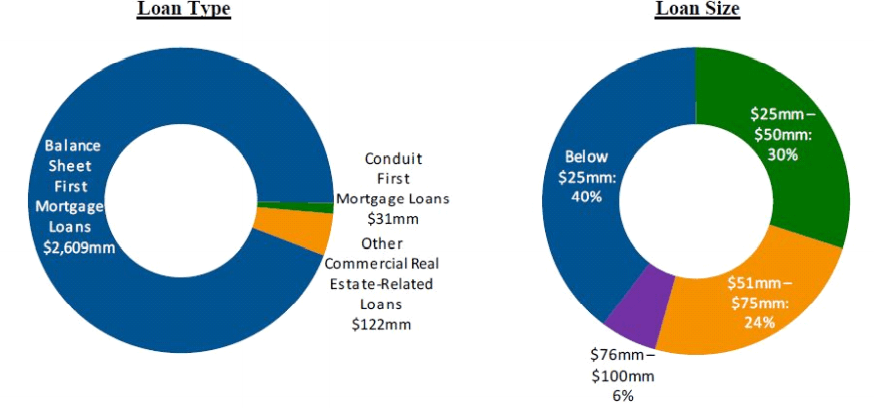
Source: Ladder Q3 10-Q
Ladder's portfolio is heavily concentrated in first-lien mortgage loans that are small to medium in size. Given its scale, direct origination capabilities, and internal management structure, Ladder is, in many ways, one of a kind. By all accounts, underwriting seems strong: the company collected 98% of interest payments in Q3, and no additional loan loss provisions were required. The firm has a couple assets in non-accrual status, but they represent less than 2% of the portfolio.
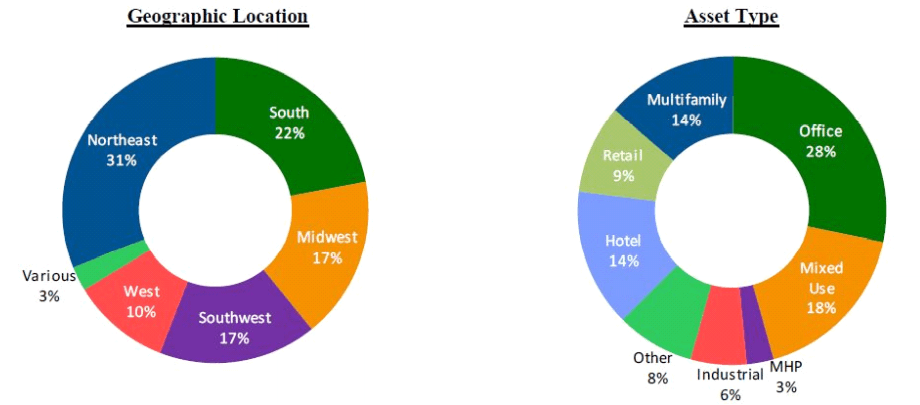
Source: Ladder Q3 10-Q
The loans are attached to commercial real estate assets spread throughout the U.S. with a slight overweight to the Northeast. This geographical exposure is better than most peers, which tend to have 20%+ of their loan portfolios in lockdown susceptible West coast cities.
The 14% and 9% allocated to hotel and retail loans is problematic, but for comparison, Blackstone Mortgage Trust (BXMT) and Starwood Property Trust had 17% and 23% exposure to hotels (Q3 data), respectively. The CEO mentioned on the Q3 conference call that one $45 million hotel in Miami was delinquent.
The physical asset exposure in the real estate division is better-positioned than the loan portfolio with 25%, 14%, 13%, 11%, 10%, and 9% in office, multi-family, dollar store, wholesale club, drug store, and grocery store, respectively, with no exposure to hotels and only 5% to other types of retail. Ladder collected 100% of rent from its real estate division. That’s a powerful metric given what we’ve seen from top equity REITs.
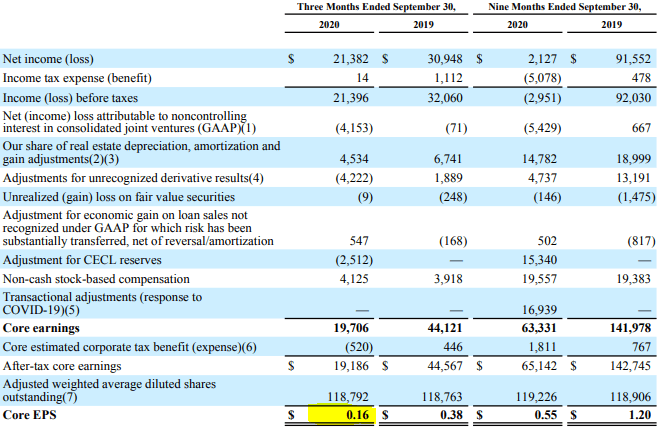
Source: Q3 Supplemental
Core Earnings Per Share ("EPS") of $0.16 in Q3 is well below Q3 2019's $0.38 but an improvement compared to Q2's $0.12. While headline numbers are important, understanding the mechanics behind them is equally critical.
In Ladder's case, interest income declined from $82.3 million in Q3 2019 to $54.6 million in Q3 of this year. Interest expense, however, rose from $51.4 million to $56.4 million over the same period.
As a result, net interest income was a meager $735,000, even after releasing $2.5 million in previously reserved loan losses. Without the release, net interest income would have been a negative $1.78 million. Without a doubt, lower interest income due to the disposition of loans and delevering of the portfolio has hurt top line income.
Ladder has not been able to reduce interest expense proportionately. Putting the nearly $1 billion currently on the sidelines back in the game will reverse a good portion of the delta. A deeper dive is warranted on this subject, and in order to do that, we need to analyze each segment.
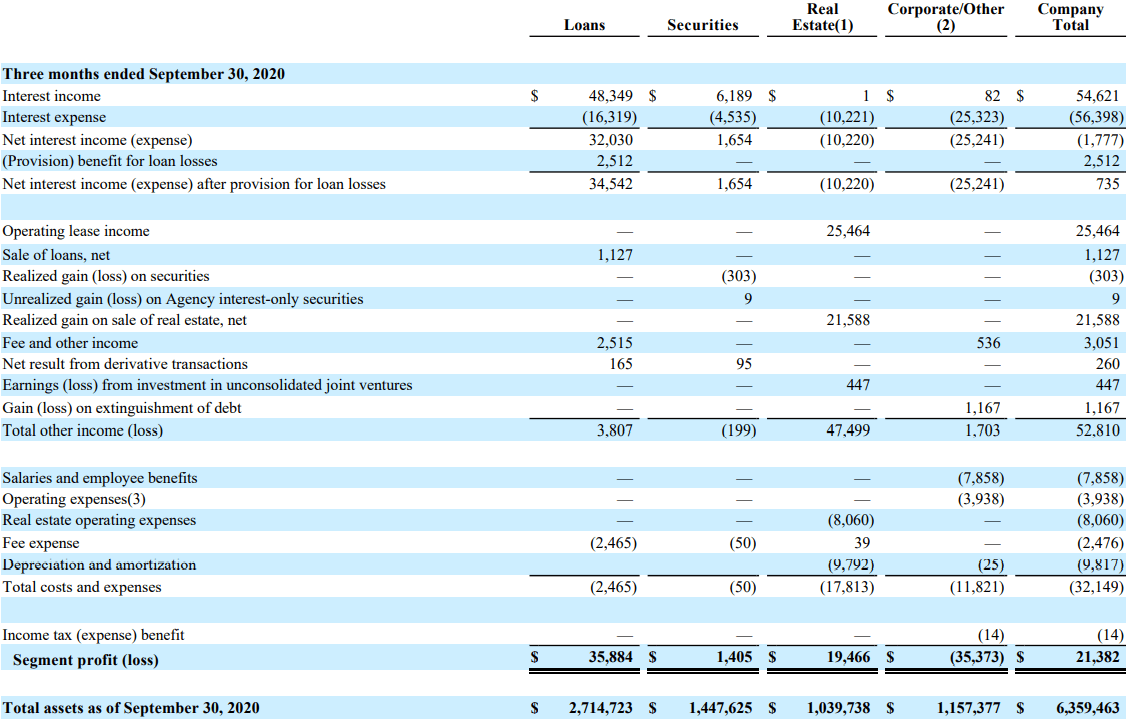
Source: Ladder Q3 10-Q
The loan division generated healthy net interest income of $35.9 million. The securities division was also profitable, albeit with much lower margins, as one would expect. The real estate division delivered a mere $1,000 in interest income against $10.2 million in interest expense. This segment includes $49.2 million in unconsolidated joint ventures.
The reason for the wide delta is because the real estate division's revenue is classified as operating lease rather than interest income; we see that with the outsized $25.5 million line item six rows from the top.
The corporate segment, as WER has mentioned in past analyses, often absorbs the bulk of salaries and G&A, and subsequently, consistently generates losses. Ladder generated $21.6 million in realized gains compared to a mere $963,000 for the first three quarters of all of 2019. Total "Other income" of $52.8 million was 38.2% greater than Q3 2019.
In aggregate, Ladder generated profit of $21.4 million in Q3. The company's improvement in Other Income, mostly due to one-time realized gains, offset $14.6 million or roughly half of the decline in net interest income.
Ladder needs to resolve the stress on net interest margins; Q4 2020 and Q1 2021 will be at least as challenging as last quarter as large realized gains can't bolster results indefinitely. The REIT needs to put as much capital to work as quickly as possible, while simultaneously maintaining very high levels of liquidity. The expression we started this article with comes to mind.
Balance Sheet and Book Value
Management teams can pull many levers in difficult environments. One of the most popular and hated is common equity dilution. That option mirrors a fiscally irresponsible government quietly issuing more currency to pay the bills. We all know how that works out in the end.
![]()

Source: Q3 Supplemental
It's more complicated for publicly traded companies, as their "currency" shifts dramatically over time relative to fair value. Issuing stock at a significant discount to net asset value compounds problems. In Ladder's case, management has been reasonably disciplined with what appears to be an 8% increase in shares outstanding since the end of 2019.
After adjusting the total share count for Class B shareholders, however, shares outstanding has not changed in the past year. This is a good point to remind readers that Ladder's management team owns equity equating to 10.7% of its total market capitalization.
Per the latest 10-Q, the company ended Q3 with $41.1 million in capital available under its share repurchase program. Given where it is trading relative to book value, that’s enough to make a small difference in per share statistics. The firm repurchased 124,000 Class A common shares at an average price of $7.21 in Q3, or a gain of approximately $880,000.
As a sidenote, Ladder finally has one class of equity, as all of the firm’s original partners have exchanged their Class B shares.
One reason WER classified Ladder as higher-risk going into 2020 (well before the coronavirus landed on U.S. shores) was sizeable debt maturities in Q2, Q3, and Q4 2020, with little relief in 2021 and 2022. A moderate challenge quickly transformed into a very precarious situation as high yield bonds and loans capitulated in value in late Q1.
On top of that, certain industries, like hotels, restaurants, and entertainment venues, were infected with a disease carrying a much higher mortality rate than the novel coronavirus.
Ladder, to its credit, did not wait and around and hope for an improved environment. Instead, it quickly managed to move or eliminate $822 million of those liabilities during Q2 of this year. In the period since, the company has been strategically repurchasing bonds at discounts to par.
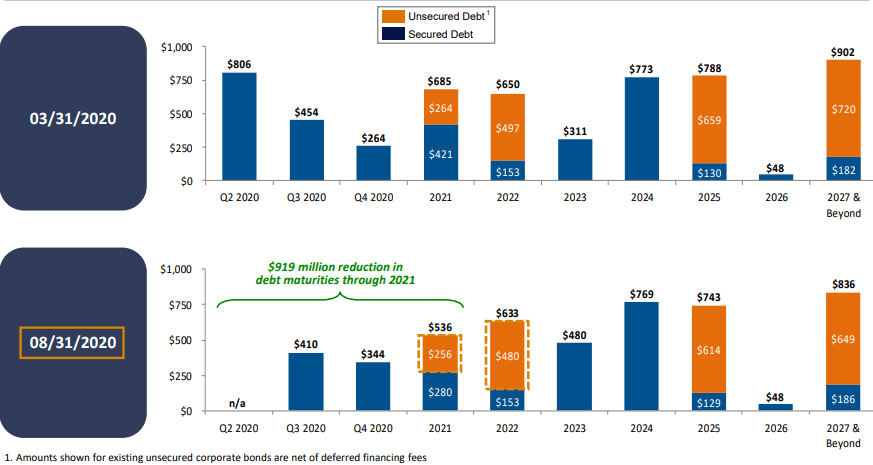
Source: Ladder Q2 Presentation
As shown above, Q3 and Q4 2020 were still potentially problematic as Q2 came to a close. That's not an ideal position.
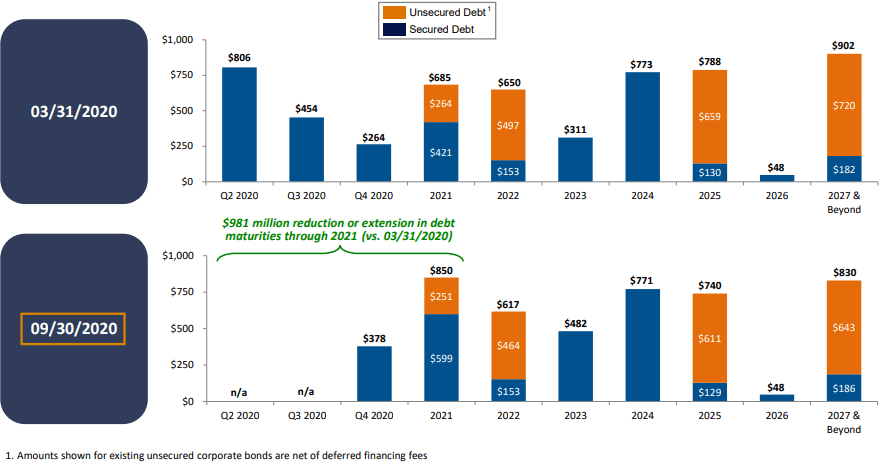
Source: Ladder Q3 Supplemental Data
Management successfully dealt with all Q3 liabilities. Q4's $264 million in secured debt maturities has increased to $378 million, however, since the end of Q2. In addition, 2021's $685 million in liabilities due has grown to $850 million. To Ladder's credit, that's nearly $1 billion maturities that it managed to move farther out during what's clearly an extremely difficult environment for mortgage REITs.
That said, there is still a lot of work to do in the next three to six months. In terms of risk, there is now sufficient cash on the balance sheet to pay down all of Q4 and most of 2021's maturities. Ladder demonstrated its ability to handle maturities in the heart of the recent crisis; there is little reason to believe it won't be able to refinance at least a large portion of near-term maturities now that much of the storm has cleared.
In terms of liquidity, the company's cash position (including restricted cash) rose from $121.8 million at the end of Q3 2019 to $917.7 million as of September 30th. This contributed the ~50% decline in return on after-tax return on average equity ("ROAE") from 10.9% to 5.1% that occurred over the period. While rarely mentioned, future funding obligations are a key component of overall liquidity.
In Ladder’s case, it has only $227 million; that’s a small percentage of its loan portfolio compared to most, if not all, peers. A contributor to this is the firm’s strategy focused on “lightly transitional” properties rather than ground-up construction loans.
This makes sense; a renovation isn’t going to need as many rounds of financing compared to a potentially multi-year ground-up construction job. Its repo debt outstanding is also modest at $288 million, another positive for the balance sheet.
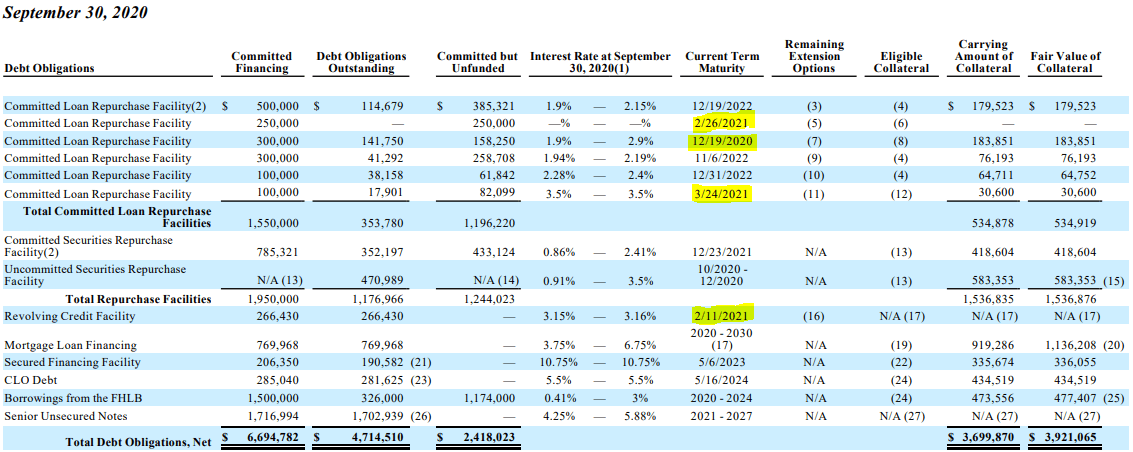
Source: Ladder Q3 10-Q
The latest 10-Q breaks down what is due and when. It's worth noting there are three 2021 maturities occurring in Q1 2021; that isn't obvious when looking at the charts in the Q3 supplements.
While that's a little harder to swallow for management, it also means that most concerns surrounding its balance sheet will be resolved by the time Q1 2021's earnings are released, all other things being equal.
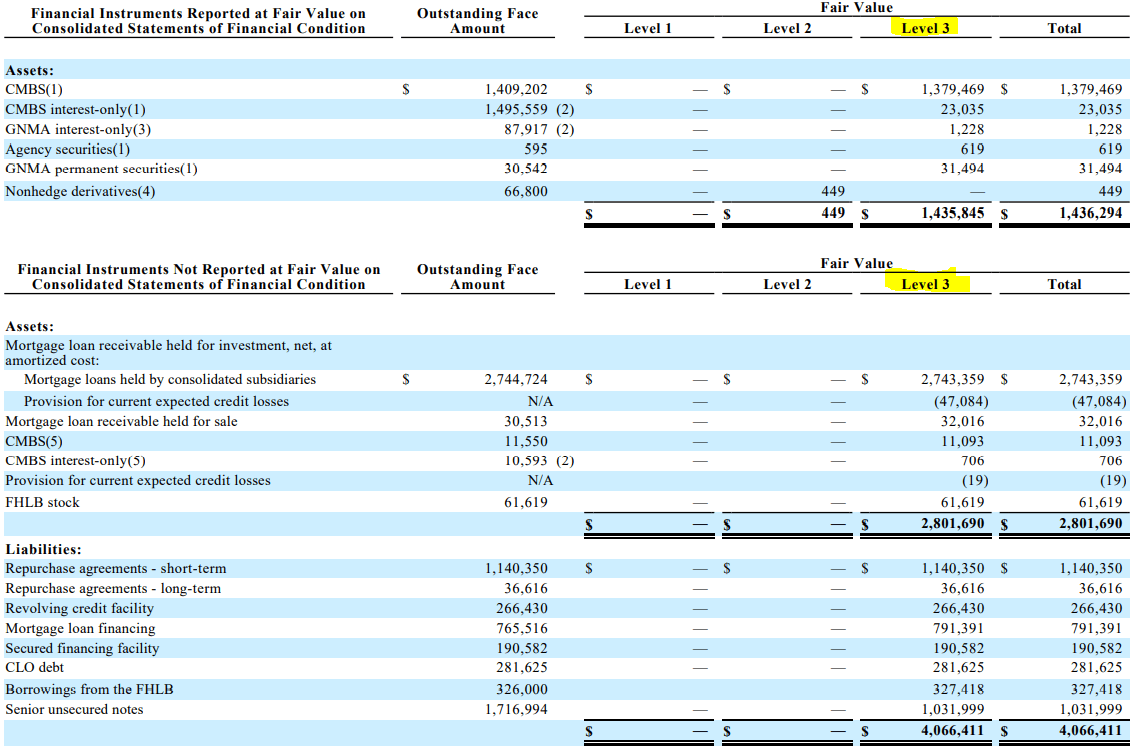
Source: Ladder Q3 10-Q
Another item worth remembering is transparency of valuations. While Ladder uses third-party inputs on most of its asset base, in line with institutional best practices, effectively all its asset base is classified Level 3.
That means there are few to no market-oriented prices available, and various models or estimates are required to determine book value. This same situation applies to the vast majority of mREITs and Business Development Companies (“BDCs”).
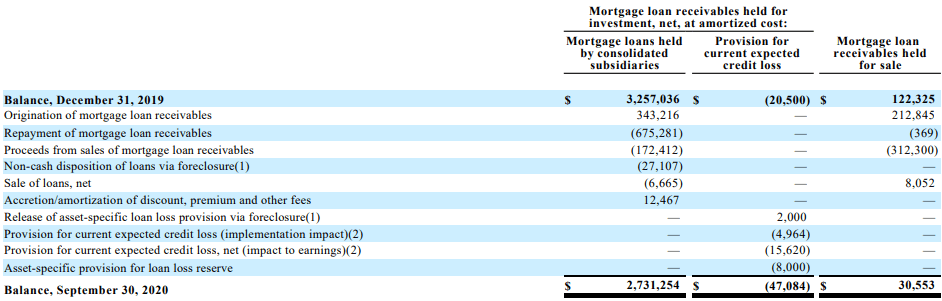
Source: Ladder Q3 10-Q
This chart demonstrates precisely what actions management has taken concerning debt outstanding. It also shows the level and types of provisions for credit losses, which are modest against the portfolio’s size.
Ladder's undepreciated book value increased $0.18 to $14.35 in Q3. That's two quarters in a row that the REIT has increased book value per share.
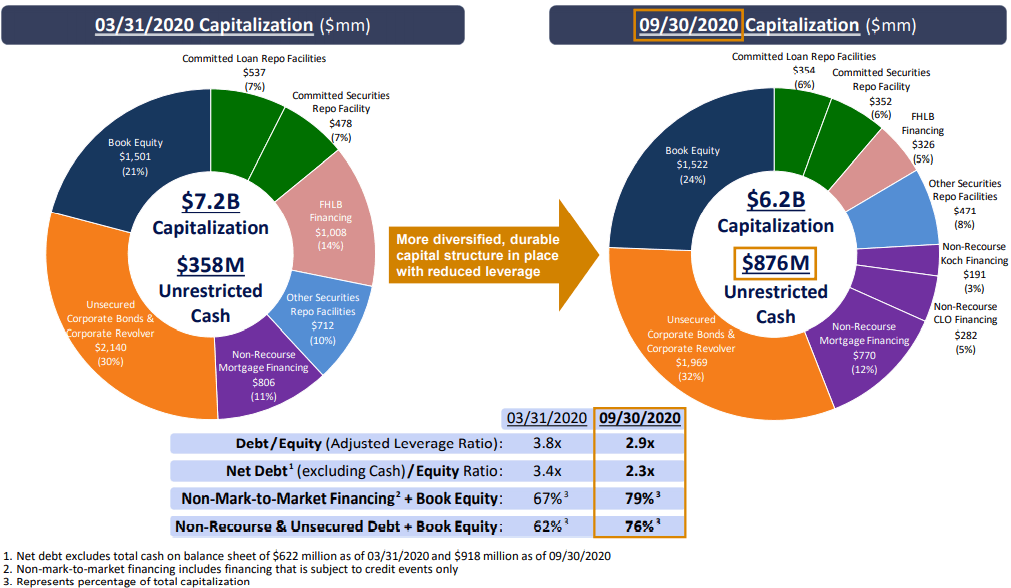
Source: Q3 Earnings Supplemental
There are two primary considerations related to this complex table. First, debt-to-equity ratios have declined markedly since the end of Q1 2020. Net debt is also way down, while Ladder has also improved its position in terms of non mark-to-market financing and recourse debt. The greater the percentage of debt not susceptible to revaluations during a crisis, the more stable the value of the asset base and overall liquidity.
Second, we need to analyze trends since the end of Q2. Debt-to-equity declined from 3.1x to 2.9x and net debt over equity fell from 2.5x to 2.3x. Unrestricted cash increased over the period from $826 million to $876 million, while the firm's capitalization decreased by only $300 million, or 3%, over the period.
Ladder's efforts to improve its balance sheet continued in Q3, and from a liquidity and leverage perspective, is in line with or better than peer averages. In terms of its securities portfolio, 100% are investment grade with 92% AAA rated.
Dividend Durability
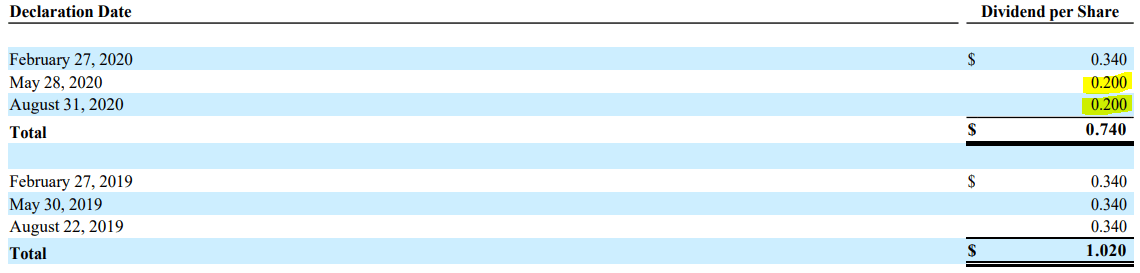
Source: Ladder Q3 10-Q
The REIT cut its distribution from $0.34 quarterly to $0.20 starting in Q2 of this year. We would have made the same move if in management's shoes, if not reduced it to $0.16.
Although not the sole reason, it’s near impossible to shore up the balance sheet with nearly $1 billion in cash, while maintaining previous levels of income generation. Core EPS, a reasonable measure for cash flow, was $0.12 and $0.16 in Q2 and Q3 2020, respectively. That means Ladder was significantly overdistributing despite the 41% reduction in the dividend.
For the first three quarters in 2020, Ladder generated $63.3 million in total core earnings, or $0.54 per share, compared to distributions of $0.74. That's substantial overdistribution for the year even with two reduced payments. The company currently yields an annualized 10.67%.
Valuation and Conclusion
At current levels of earnings and distributions, Ladder is actually paying a cash distribution of $0.16 and another $0.04 return of capital. This is a great example of why comparing yields between firms is often flawed. It is mandatory to analyze underlying earnings.
For 2021, we estimate Ladder will produce between $0.75 and $0.85 in cash earnings. It's difficult to gauge beyond that reliably, but the company could near $1.0 in 2022 if spreads improve and management puts the $900+ million in cash to work effectively. The securities portfolio sitting almost entirely in AAA bonds, coupled with the giant cash position, is causing a predictable drag on cash flow.
That means Ladder currently trades at a 10.67 multiple of our 2021 earnings midpoint estimate. Blackstone Mortgage Trust just released its Q3 results of $0.63 in Core EPS. At $21.70 per share, that puts BXMT at an 8.61 multiple assuming zero improvement next year.
Arbor Realty Trust (ABR) just posted Q3 GAAP EPS of $0.72 share, or a mere 4.10x multiple. Adjusting for a more sustainable measure, Arbor still trades at a 5.85 multiple excluding the fact that it's arguably increasing earnings at the fastest rate in the mREIT industry.
On the other hand, Ladder's discount to book value of nearly 50% is way steeper than BXMT's 18%, for example. Don't forget that Ladder, unlike BXMT and STWD, is internally managed. On top of that, the executive team has much more skin in the game per their 10%+ ownership stake.
From a cash flow perspective, both in terms of dividend safety and multiple paid, investors are better off investing in the likes of ABR or BXMT. Ladder Capital is not currently a “blue chip” company, no matter which definition one prefers.
From a discount to book value standpoint, however, Ladder is the most attractive commercial mortgage REIT we follow. In fact, due to the incredible discount, the company now has more cash on its balance sheet than its entire market capitalization. If it used $500 million to buy back shares, that adds $225 million to its equity value. That’s not necessarily what we are suggesting, but it does put things into perspective.
Author's note: Brad Thomas is a Wall Street writer, which means he's not always right with his predictions or recommendations. Since that also applies to his grammar, please excuse any typos you may find. Also, this article is free: written and distributed only to assist in research while providing a forum for second-level thinking.
Join the iREIT Revolution! (2-Week FREE Trial)
At iREIT, we're committed to assisting investors navigate the REIT sector. As part of this commitment, we recently launched our newest quality scoring tool called iREIT IQ. This automated model can be used for comparing the "moats" for over 150 equity REITs and screening based upon all traditional valuation metrics.
Join iREIT NOW and get 10% off and get Brad's book for FREE!

* Listen to our Ground Up Podcast * 2-week free trial * free REIT book *
Disclosure: I am/we are long LADR, BXMT, STWD, ABR, BRMK. I wrote this article myself, and it expresses my own opinions. I am not receiving compensation for it (other than from Seeking Alpha). I have no business relationship with any company whose stock is mentioned in this article.
