Rule Of 40 For SaaS Companies - Part 3, Valuation

In this series, we have been looking at SaaS companies who pass the Rule of 40, a rule of thumb balancing sales growth and profitability.
Rule of 40 stocks have outperformed the broader indices and IT benchmarks over the last 15 years, as have stocks in our All Software Stocks universe.
In this piece, we breakdown a popular method for estimating relative valuation of SaaS companies to potentially find any undervalued stocks in this very richly valued arena.
The performance results of Rule of 40 stocks based on this valuation method may (or may not) surprise you.
I provide the current Rule of 40 stocks in our universe, based on valuation groups.
 Source: Pixabay, Author Text
In this series, we have been looking at the Rule of 40 for software-as-a-service (SaaS) companies. As these companies usually go through a phase of very high growth with limited or no profitability, the Rule of 40 provides guidance on a healthy balance between sales growth and profitability.
Brad Feld popularized the Rule of 40 back in 2015, he summarizes the Rule as follows:
So, if you are growing at 20% (sales), you should be generating a profit of 20%. If you are growing at 40%, you should be generating a 0% profit. If you are growing at 50%, you can lose 10%. If you are doing better than the 40% rule, that’s awesome.
In Part 1 of this series, we looked at performance of software stocks over the last 15 years, and then those stocks passing variations of the Rule of 40 (“R40 Stocks”). While sales growth is straight forward, the profitability measure can vary, i.e. free cash flow, operating margin, or even EBITDA margin. In Part 1, as a group of stocks, those R40 stocks based on FCF profitability performed the best.
Summary results are as follows:
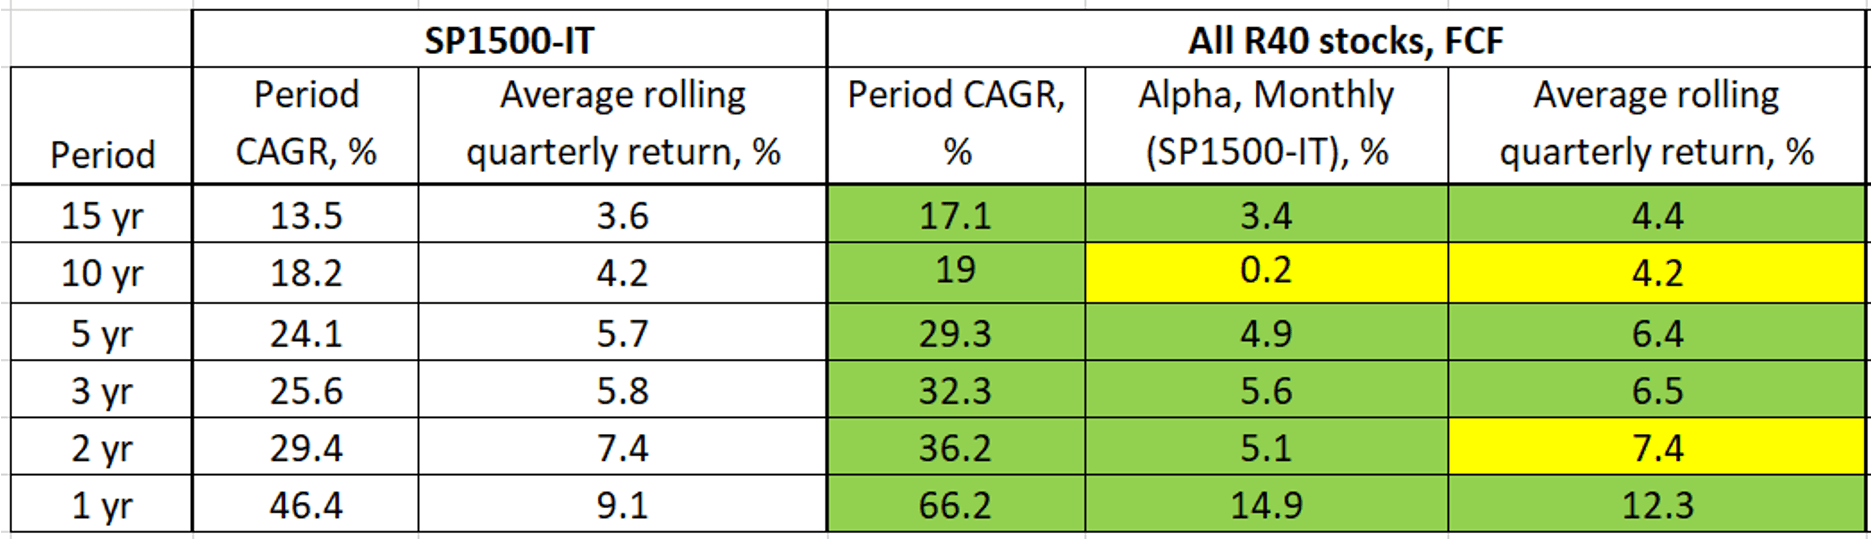
Source: Portfolio123, Author Table
In Part 2, we took a closer look at R40 stocks and found that not all are created equal. While a SaaS company with combined sales growth and profitability greater than 40% is considered “healthy” according to the Feld’s rule, we found that those on the higher ends of both sales growth and profitability tended to underperform, due to their tendency to revert to the mean.
In this piece, I would like to focus on the valuation of R40 stocks and the associated returns based on different groupings of valuation.
Rule of 40 Stocks – Valuation Methods
In previous installments, readers asked about valuation of R40 companies. Most would agree that discounted cash flow analysis, or DCF, is generally understood to be the proper way to value companies, i.e. predict future cash flows and discount back to today. In my experience this method works in theory, however the actual implementation is near impossible in the accurate prediction of cash flow, or the prediction of anything for that matter. The efficacy of prediction is beyond the scope of this piece, but the point is that DCF is difficult to implement, and even more difficult from a quant strategy perspective.
Another method for valuing companies is through relative valuation. To find potentially undervalued companies, those firms with a lower price to earnings (or price to other factor) has historically been one method that has produced alpha for stocks (although this approach, in isolation, has struggled in recent years). This approach forms the basis for Magic Formula investing and low EV/EBIT(DA), (aka Acquirer’s Multiple) investing.
A common approach for SaaS companies is to compare the revenue multiple valuation the market has assigned to all stocks, based on the SaaS companies’ revenue growth (either trailing for forward). For example, below is a plot of all the stocks in our All Software Stocks universe (described in part 1) at time of writing. Revenue growth (trailing, TTM) is shown on the horizontal ‘x’ axis, and the corresponding revenue multiple (price-to-sales, TTM) is shown on the vertical ‘y’ axis. For clarity, only a few stock ticker labels have been added for reference.
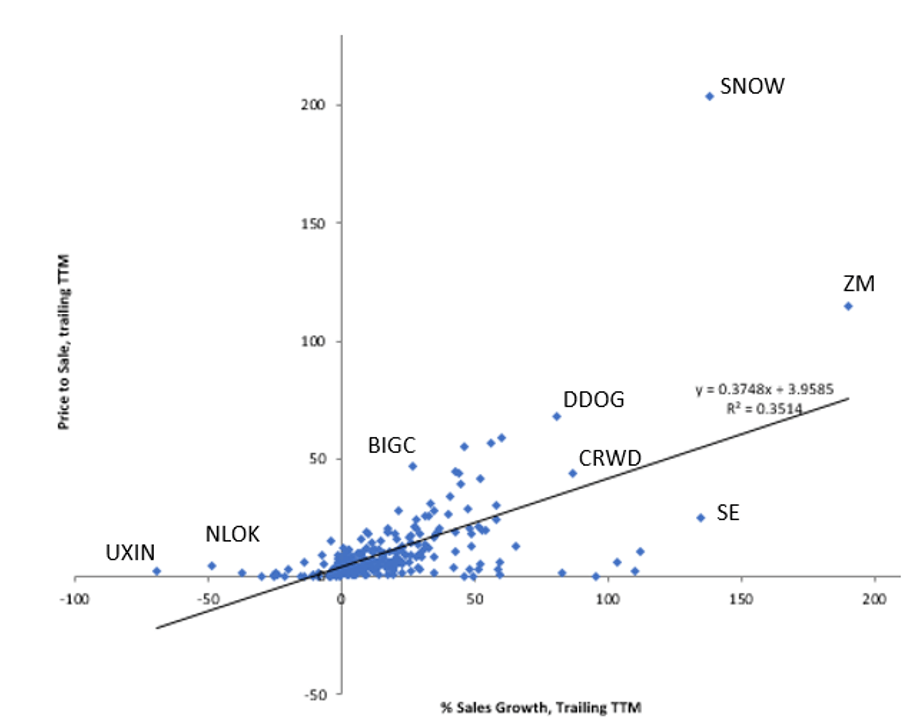
Source: Portfolio123, Author MS Excel Graph
A regression line is then calculated (Excel can do this) and plotted, estimating the average trend between sales growth and revenue multiple for all of the stocks in the universe. The linear relationship and correlation (R 2) is shown above.
The trendline is assumed to be linear, where stocks with higher revenue growth should receive higher multiples (valuations) than others. On this basis, we can parse out three different valuation buckets:
- Fairly valued – stocks located along (or near) the trendline
- Undervalued – stocks located below the trendline, lower valuation for given sales growth
- Overvalued – stocks located above the trendline, higher valuation for given sales growth
The plot below shows these approximate groupings:
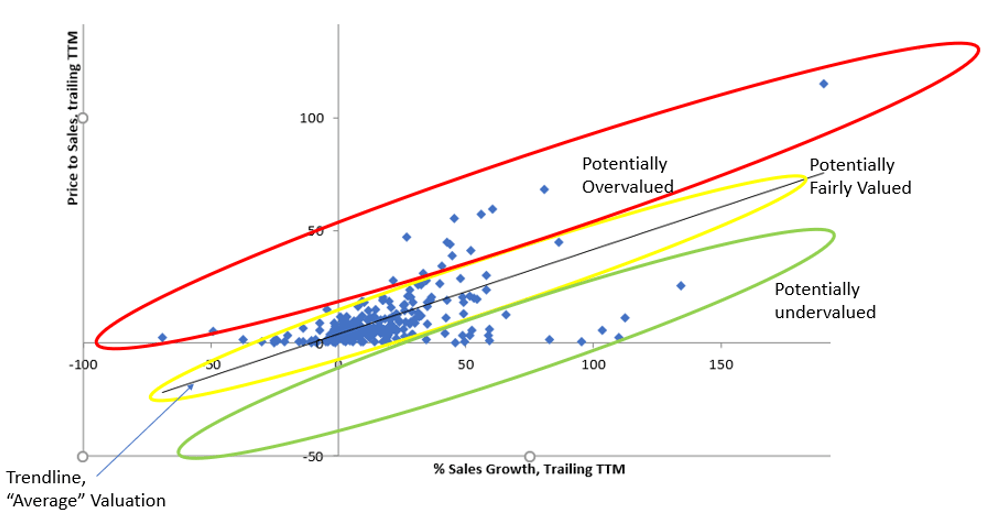
Source: Portfolio123, Author MS Excel Graph
If we look only at R40 stocks at time of writing, our valuation scatter plot looks like this:
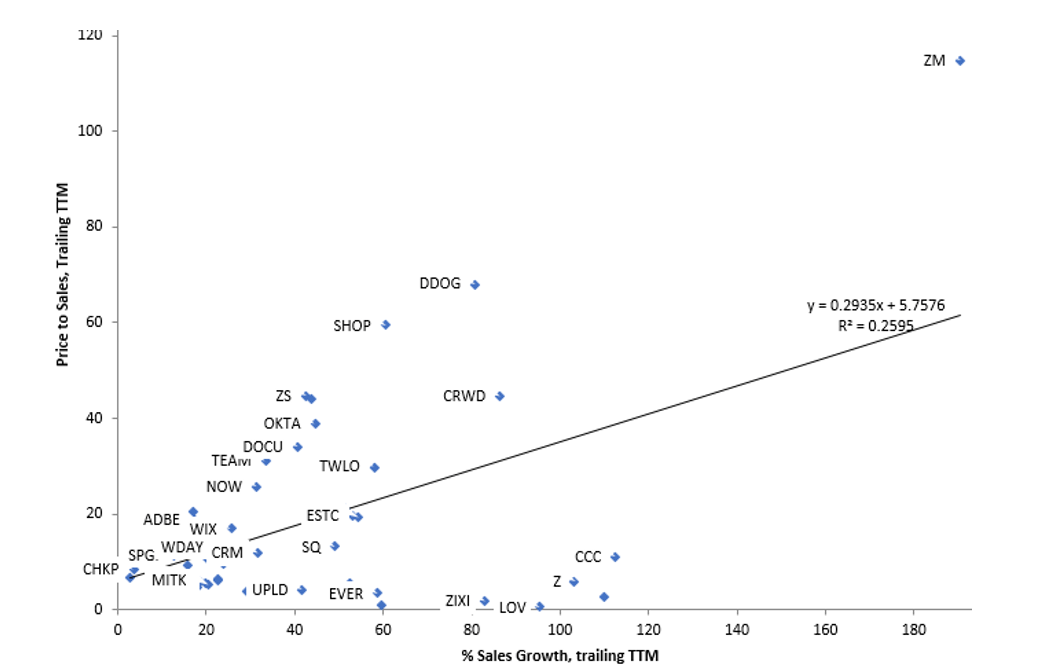
Source: Portfolio123, Author MS Excel Graph
Some ticker names removed for clarity. If we continue with the assumption above, those stocks with valuations above the trendline should be overvalued, which would include ZM, DDOG, SHOP, CRWD, OKTA and several others. Fairly valued stocks may be ESTC, MITK, WDAY. The undervalued stocks would include CCC, Z, ZIXI and LOV.
This now begs the question, do undervalued SaaS companies or R40 stocks offer an opportunity for alpha? In this piece, we will test this question.
Statistics Sidebar: Before we look at answering this question, a quick primer on regressions and linear statistics. The trendlines above include values for R2, or correlation. This value represents the proportion of variance in the dependent variable (revenue multiple valuation) that can be explained by the independent variable (sales growth). A value of 0 represents no correlation, and a value of 1 is perfect correlation. For the plots above, correlation between sales growth and valuation for all software stocks and R40 stocks only are 0.35 and 0.26 respectively. These are not very strong correlations statistically speaking; keep this in mind for later.
Rule of 40 Stocks – Valuation Groups
In order to test if there is opportunity in undervalued R40 stocks, we will require a method to separate our stocks into various valuation buckets. There are various ways to achieve this, one could potentially measure the valuation standard deviation of the stock away from the mean of the group, etc.
For this study, we will rank all stocks in our universe based on valuation, defined as revenue multiple (trailing Price/Sales) divided by Sales growth, or (P/S)/growth. The higher the (P/S)/growth values, the higher the revenue multiple the market is applying to the stock for a given growth rate. These would be considered “overvalued” (stocks above the trendline). For low ranking (P/S)/growth stocks, the market is assigning a lower revenue multiple for a given sales growth, and therefore would be considered “undervalued” (below the trendline).
We will group all of our stocks into three (3) valuation buckets, and test their performance over time:
- Overvalued, highest 33% by (P/S)/sales growth
- Fairly valued, mid 33% by (P/S)/sales growth
- Undervalued, lowest 33% by (P/S)/sales growth
As we did in Part 1, we will form portfolios including all stocks in the given universe (All Software Stocks, or all stocks passing the Rule of 40), with quarterly rebalance, and allowances for slippage and commission. Stocks must have minimum annual sales of $50M, with minimum $100k average daily volume. Software stocks are based on RBICS industry codes as described in Part 1.
For reference, at any given time the All Software Stocks universe contains approximately 250 stocks, and of those roughly 50 pass the Rule of 40.
We will look at valuations based on both trailing and forward values for sales growth and profitability.
We will measure performance based on:
- Cumulative annual return (%), or CAGR, over various periods
- Average monthly alpha for each period (based on the SP1500-IT index)
- Average rolling quarterly return, with 1 month offset, to control for any seasonal effects in the rebalancing
And as usual, we will perform all tests on Portfolio123.
Software Stocks – Valuation & Performance, Trailing Sales Growth
Before getting into R40 stocks, let’s test on the broader All Software Stocks universe (which captures much of the SaaS companies).
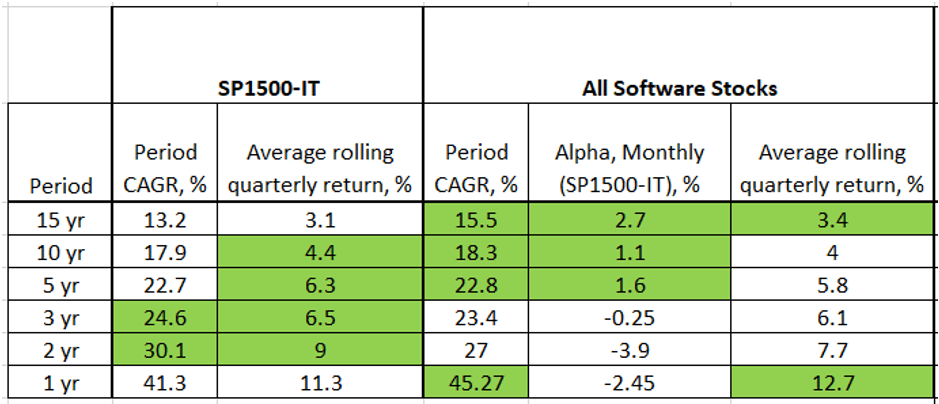
Here is our performance for the SP1500-IT and All Software Stocks so far:
Source: Portfolio123, Author Table
While performance to date has varied between the SP1500-IT benchmark and our All Software Stocks universe, the fact remains that both have provided outstanding returns in the last 15 years.
Fairly Valued Performance
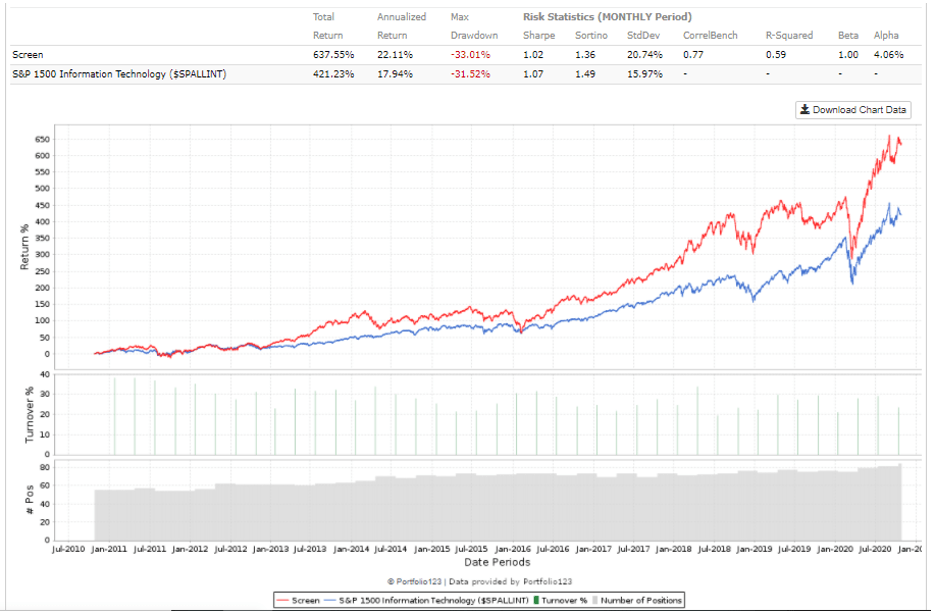
Here is the 10 year equity curve for the Fairly Valued group of stocks (trailing values) from the All Software Stocks Universe:
Source: Portfolio123
With positive alpha, those stocks in the “fairly valued” group of all software stocks based on (P/S)/growth have outperformed nicely, and managed to stay ahead of the SP1500-IT benchmark nearly the entire period.
Here is the summary performance of this group:

Source: Portolio123 data, Author Table
“Fairly valued” stocks beat the SP1500-IT and All Software Stocks in all periods, except for negative alpha in the last 2 years.
Undervalued Performance
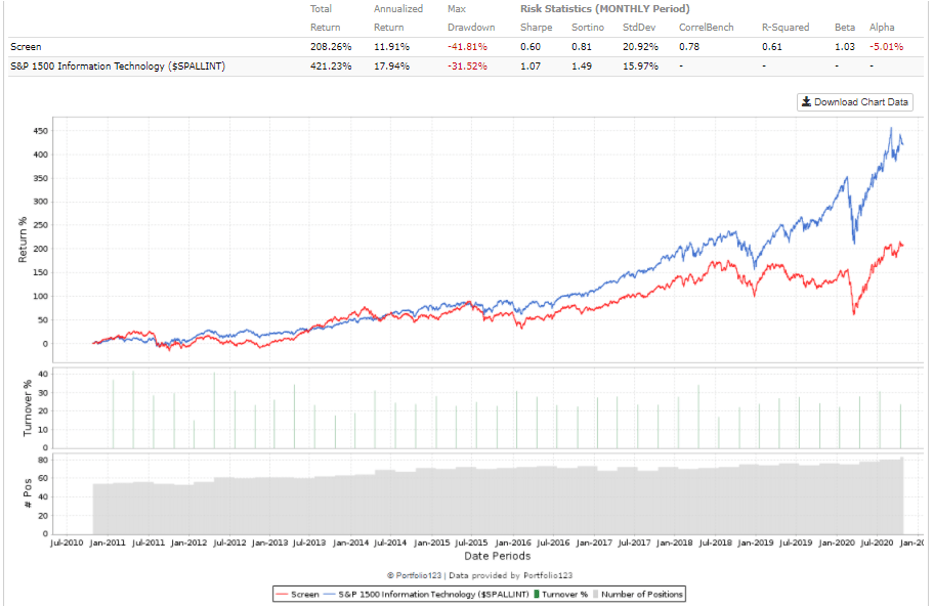
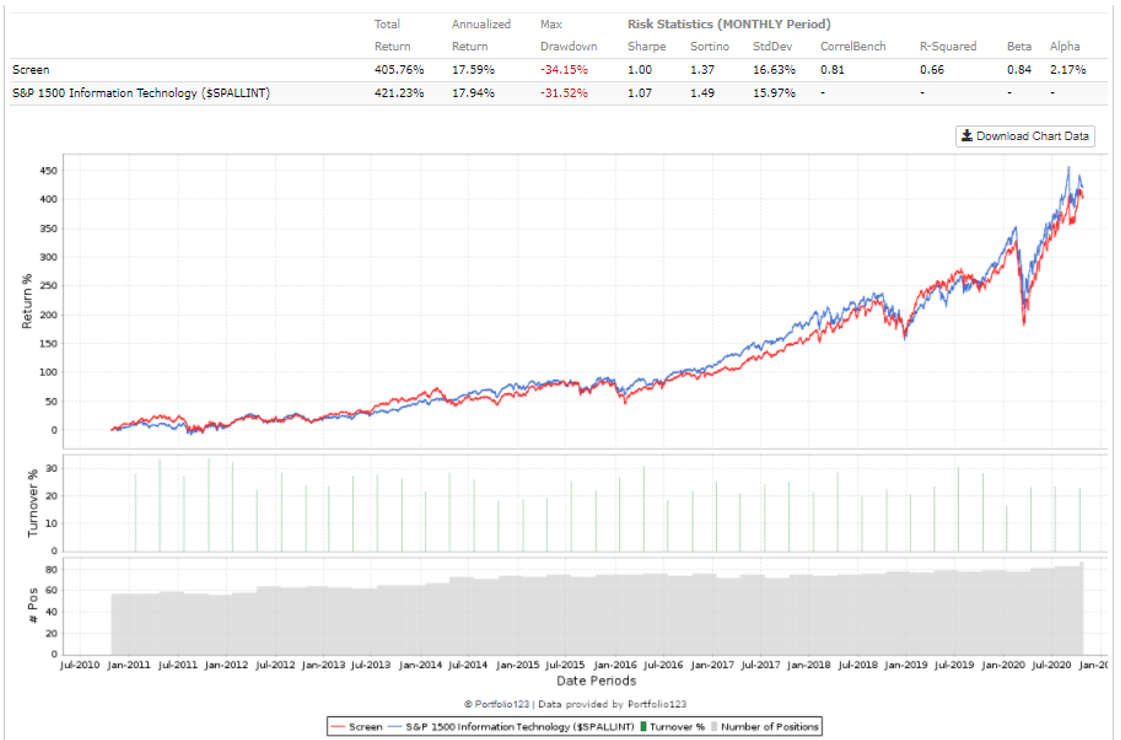
The 10 year equity curve for our undervalued group of All Software Stocks is below:
Source: Portfolio123
Interestingly, the “undervalued” group of Software stocks did not perform well at all compared to the SP1500-IT, and considerably worse than our “fairly valued” group.
Summary performance for the undervalued group of All Software Stocks:
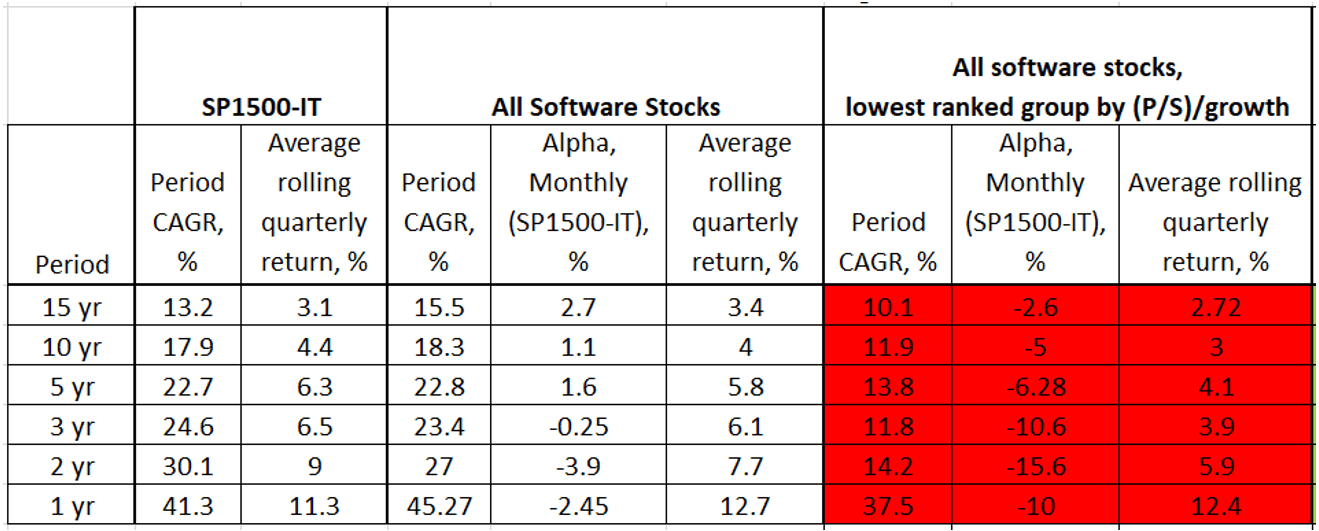
Source: Portolio123 data, Author Table
Undervalued stocks lagged the All Software Stocks universe on all metrics over all periods. This may suggest that the undervalued stocks are not necessarily undervalued, but instead be of poor value. We’ll take a closer look at this below.
Overvalued Performance
In contrast, here is the “overvalued” group of software stocks by (P/S)/growth:
Over the 10 year period, the overvalued group of stocks managed positive alpha, but still trailed the SP1500-IT marginally over the entire period.
Summary stats for the overvalued software stocks:
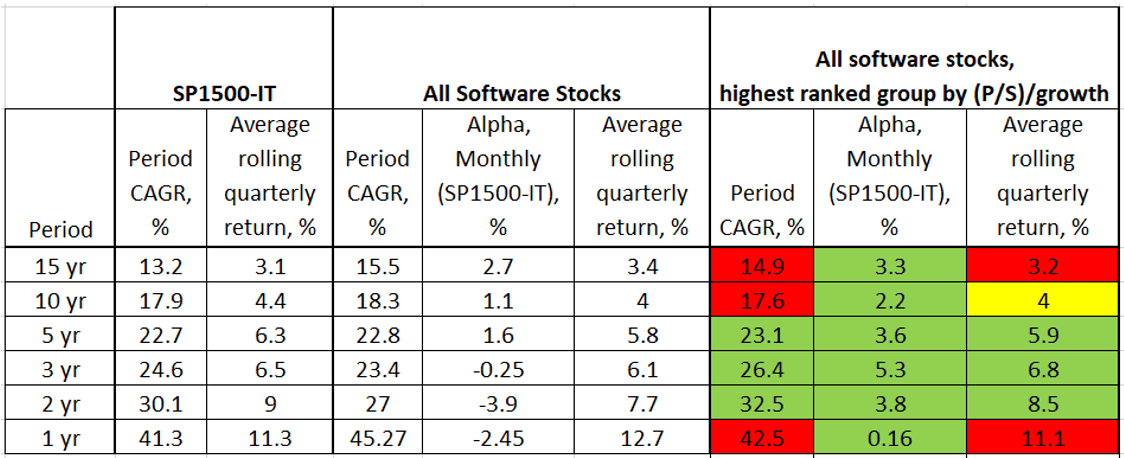
Source: Portolio123 data, Author Table
Interestingly, over all periods and for all metrics, the “overvalued” group of software stocks compared to the broader universe of software stocks had mixed performance, however outperformed most consistently on an alpha basis.
Summary Performance
Here are all valuation groups for our All Software Stocks universe (based on trailing values):
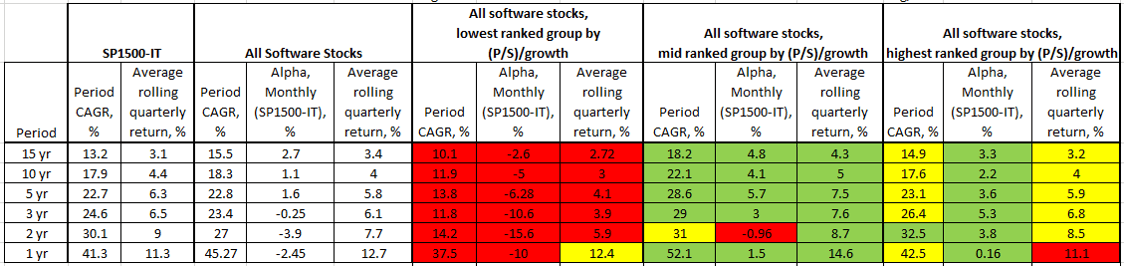
Source: Portolio123 data, Author Table
In summary, when our Software stocks are grouped by (P/S)/growth valuation, our mid ranked (or fairly valued) stocks generally outperformed all benchmarks, and low and high ranked stocks. This may suggest that:
1) the market is discounting the undervalued stocks for a reason(s), and
2) those stocks with the richest valuations eventually do mean revert and come back to earth (as we saw in Part II), but not to the extent that one would expect.
All Software Stocks – Common Attributes based on Valuation
Now let’s see what types of stocks are included in each of these valuation groups. We will look at some fundamental and market sentiment characteristics of these groups of stocks to see if there is a reason the market is rewarding or punishing these groups.
Our metrics will include the following:
- Financial strength:
- Current ratio (ratio of current assets over current liabilities, the higher the better)
- Long term Debt to equity, latest quarter, lower the better
- Interest coverage (based on operating income after depreciation), latest quarter, lower the better
- Market sentiment:
- Analyst recommendation, rating 1 – 5, lower (strong buy), 5 (strong sell)
- Short interest, as % of shares outstanding (to date) Short interest trend
- Short Interest change, value for the most recent month compared to the Short Interest for the previous month, lower (or negative) values better
- Expectations:
- As sales growth is so important for SaaS companies, how likely are these stocks to beat analyst sales estimates?
Below is a snapshot of the average values for these metrics at time of writing, for the All Software Stocks universe:

Source: Portfolio123 data, Author Table
The “overvalued” stocks are financially the strongest, on balance, with the lowest debt to equity, highest current ratio and highest interest coverage.
In terms of sentiment, there is no clear winner. Of note however, the richly valued firms have the lowest proportion of short interest.
The “fairly valued” firms managed to beat analyst expectations on sales the most, with the “overvalued” group a close second.
Keeping in mind that the above is only a snapshot for today, it is instructive in identifying some trends.
With the scene set for software stocks, let’s now focus on our R40 stocks in terms of performance on relative valuation.
Rule of 40 Stocks – Valuation & Performance, Trailing Values
Now let’s repeat the analysis above on our R40 stocks. Recall that R40 stocks are all software stocks that have a minimum combined sales growth and free cash flow profitability of 40% (TTM values). For this section, we will use trailing values.
Fairly Valued Performance
To start out, here is the 10 year performance of fairly valued R40 stocks:
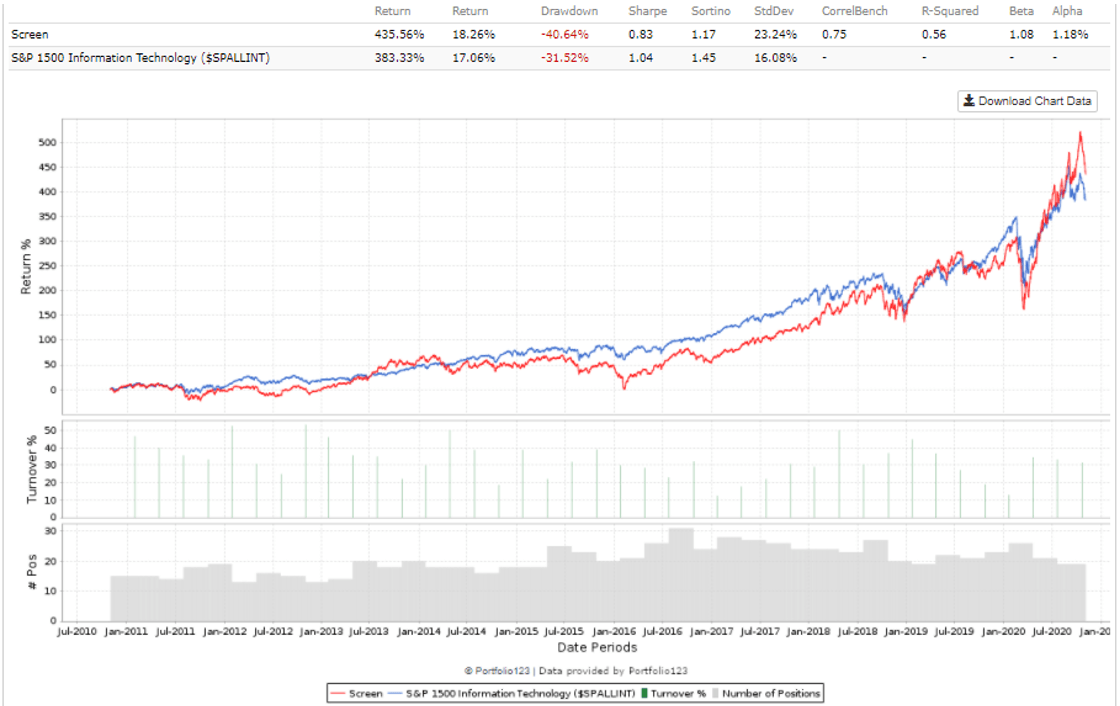
Source: Portfolio123
For this period, the midvalued R40 stocks just barely kept up with the benchmark, with much higher volatility.
Over all periods and metrics, mid ranked R40 stocks have had mixed performance compared to all R40 stocks:
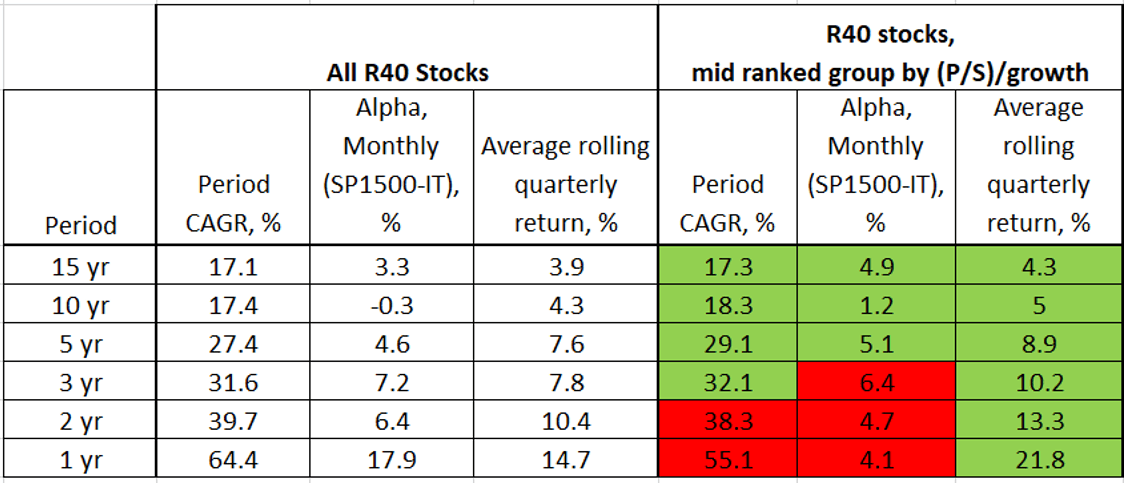
Source: Portfolio123 data, Author Table
Undervalued Performance
Here is the 10 year equity curve on “undervalued” R40 stocks:
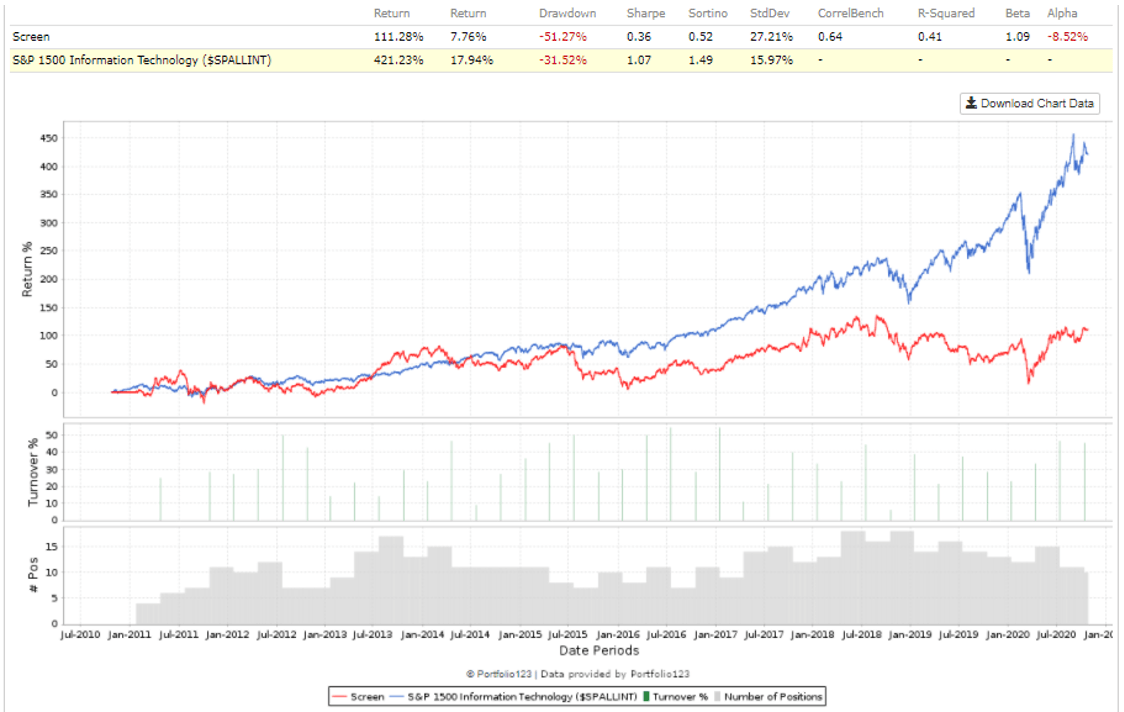
Source: Porfolio123
Note the significant underperformance of this group of stocks over the last 10 years, with both negative alpha, and total return of nearly one quarter of the SP1500-IT index.
Summary stats for the undervalued R40 stocks, compared to all R40 stocks:
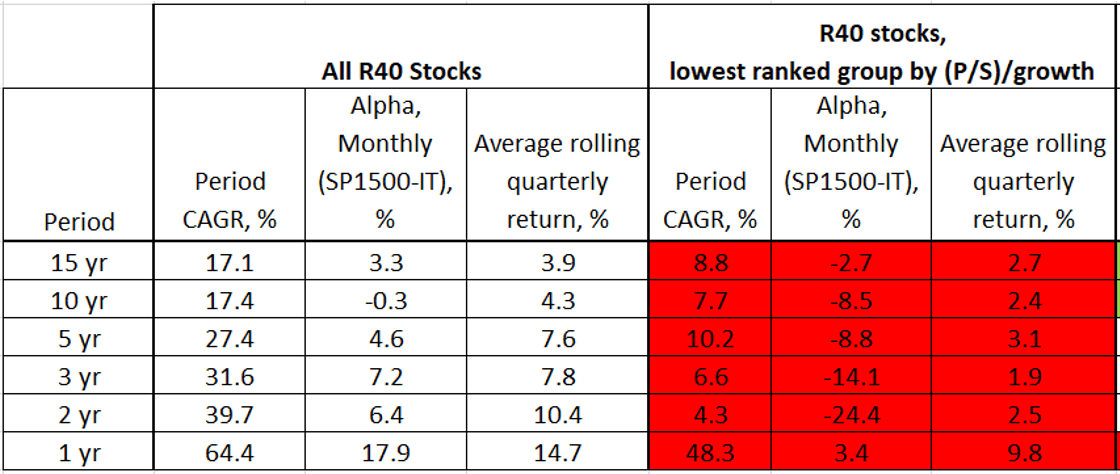
Source: Portfolio123, Author Table
Over all periods and metrics, undervalued R40 stocks lagged our All R40 Stocks universe.
Overvalued Performance
On the opposite end of the valuation spectrum, here is the 10 year equity curve for the most richly valued R40 stocks, quarterly rebalance:
Source: Portfolio123
While this group of stocks outperformed on balance, it was lagging the benchmark until early 2019, and then really outperformed.
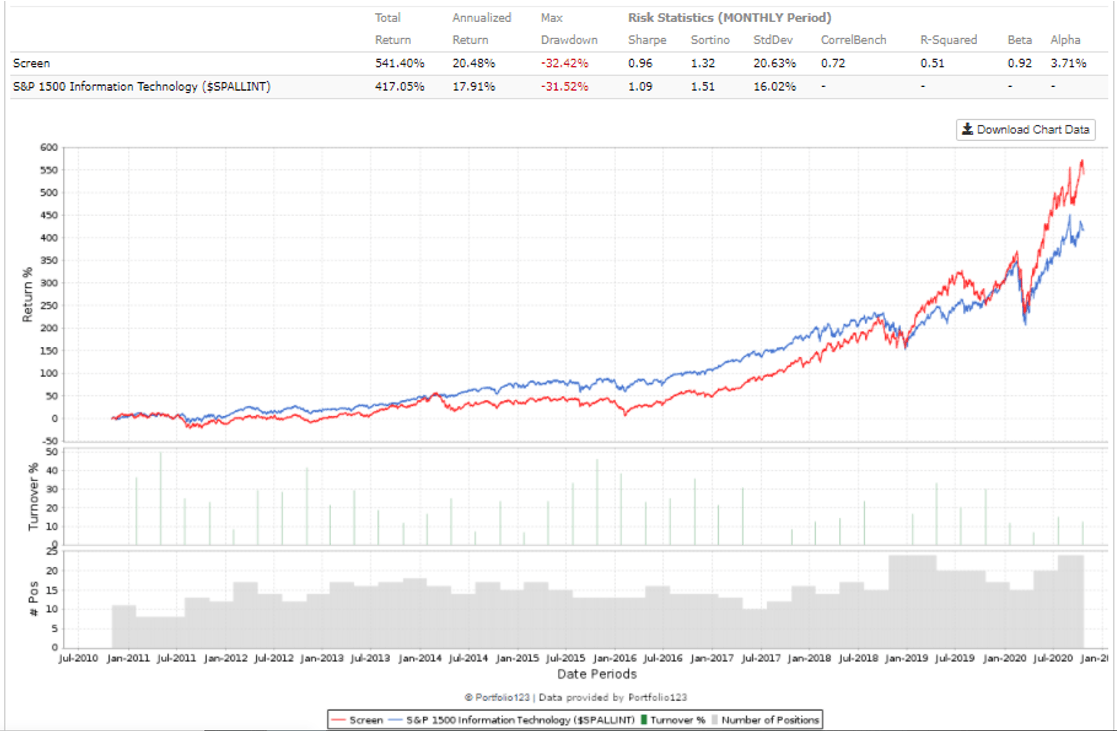
For all periods and metrics, here is summary performance for the “overvalued” R40 stocks:
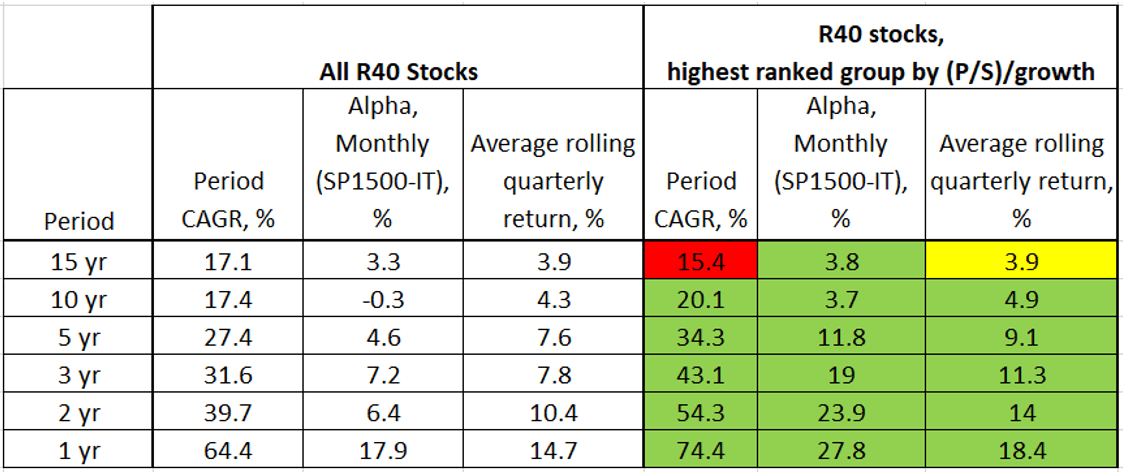
Source: Portfolio123, Author Table
Summary Performance
In summary, performance of the R40 stocks based on valuation buckets (trailing values):
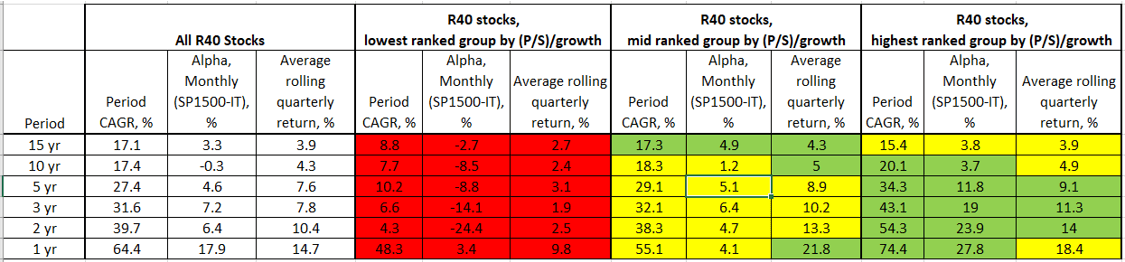
Clearly, the “undervalued” group not only underperformed consistently compared to all R40 stocks, but also within the fairly and overvalued groups. Again, this suggests that these stocks are trading at low multiples for a reason, and that there is little mispricing opportunity for alpha.
Both fairly and overvalued groups beat R40 stocks, with the most richly valued group performing the best.
Rule of 40 Stocks – Common Attributes based on Valuation (trailing)
When we break down the different valuation groups for R40 stocks, we find the following picture:
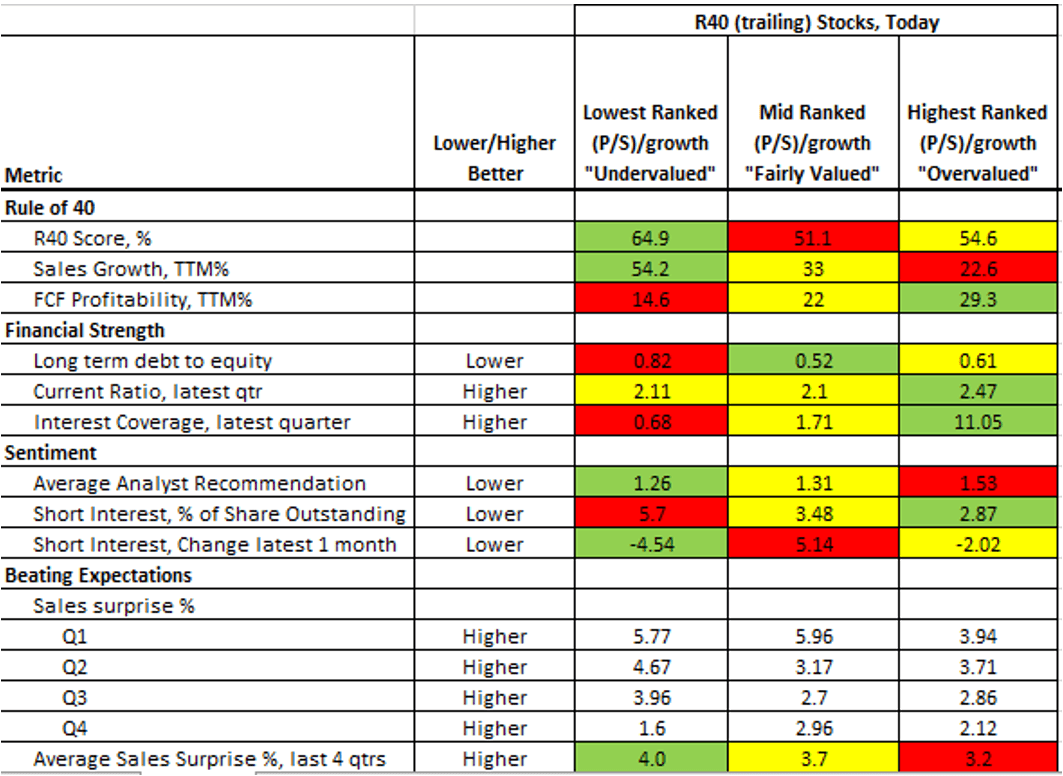
Source: Portfolio123 data, Author Table
Interestingly, the lower performing valuation group (“undervalued”), also had the highest R40 score and sales growth value. This should not be a surprise from our findings in Part 2 of this series, where the highest R40 stocks on overall score or sales growth did tend to underperform over time, likely due to mean reversion.
The lowest valuation group also had the poorest values in terms of financial strength, compared to the fairly and overvalued groups.
Sentiment metrics are mixed, with the lowest valued group having the highest short interest, but also the highest analyst recommendation (which could also imply that analysts are expecting these undervalued stocks to outperform).
At time of writing, the undervalued stocks had a slightly higher % of sales surprises of the groups.
Remember that these are select metrics, at a very select group of stocks at time of writing. These trends may vary over time, but it is instructive to see what types of stocks are included in each valuation group.
Rule of 40 and Valuation – Findings so far
To sum up our findings at this point, undervalued Rule of 40 stocks tend to be undervalued for a reason, at time of writing are also of poorer quality based on the fundamental metrics covered, and historically have produced the lowest returns of all R40 stocks. Interestingly, the more richly valued stocks have continued to outperform, and show some high levels of quality on several metrics.
Up to this point, we have been looking at trailing values for both sales growth and profitability of R40 stocks. Now let’s turn our attention on those stocks that pass the Rule of 40 based on forward looking values.
Rule of 40 Valuation – Forward Growth
Up until now, in this series we have been looking at trailing values for R40 stocks, i.e. trailing sales growth, and trailing FCF profitability. The valuation method of plotting sales growth against revenue multiple as we have done above can also be used with forward values from analyst estimates.
One could expect that using forward values would be more accurate, so let’s compare the returns of both trailing and forward versions of R40 stocks. Where trailing values are the difference between the last twelve months from the previous twelve months, forward values for sales growth and FCF profitability are next year’s analyst estimate compared to the actual values of the previous year.
Here is summary performance of both trailing and forward versions of the R40 portfolios:
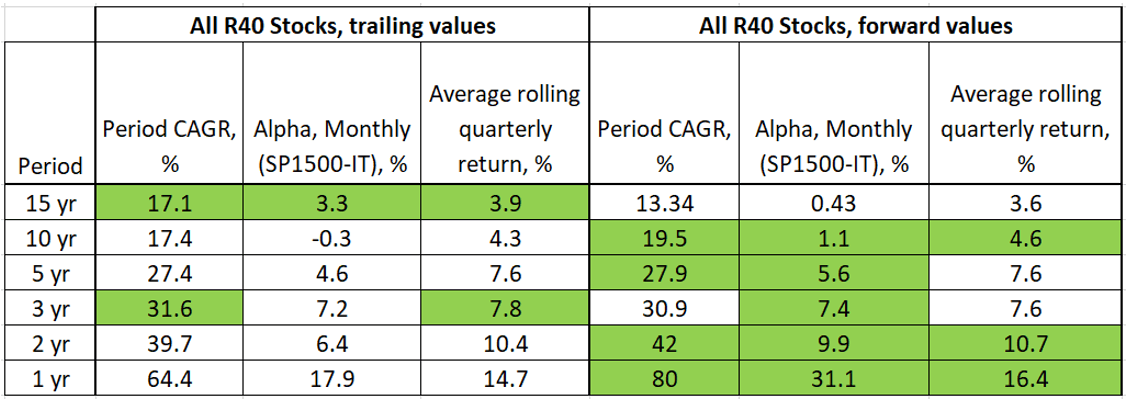
Source: Portfolio123, Author Table
Note that forward values of sales growth and FCF profitability were not available to Portfolio123 until Q2 of 2006, which may skew the results for 15 year performance for the forward R40 stocks. Forward values for R40 stocks are slightly improved over the trailing versions, particularly for more recent periods.
Now let’s apply the valuation exercise on our forward R40 stocks. We will use the same basis of valuation groups for the forward portfolios based on the trailing portfolios:
- Overvalued, highest 33% by (P/S)/growth
- Fairly valued, mid 33% by (P/S)/growth
- Undervalued, lowest 33% by (P/S)/growth
Fairly Valued
Let’s start in the middle, with the 10 year equity curve for the fairly valued Rule of 40 Stocks (forward values):
Source: Portfolio123
Other than the first few years, the fairly valued group managed to stay ahead of SP1500-IT nearly the entire period.
As for other periods, the fairly valued forward R40 stocks outperformed on all fronts:
Source: Portfolio123, Author Table
Undervalued Performance
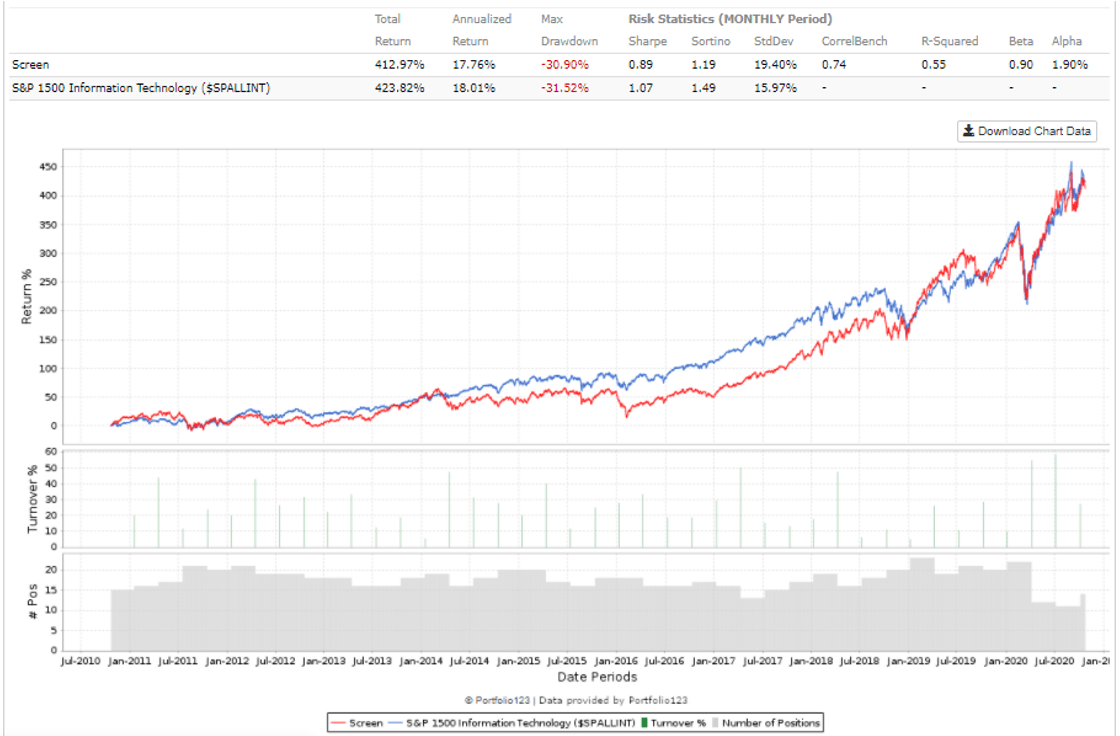
Now let’s take a look at the “undervalued” forward R40 stocks. Below is the 10 year equity curve:
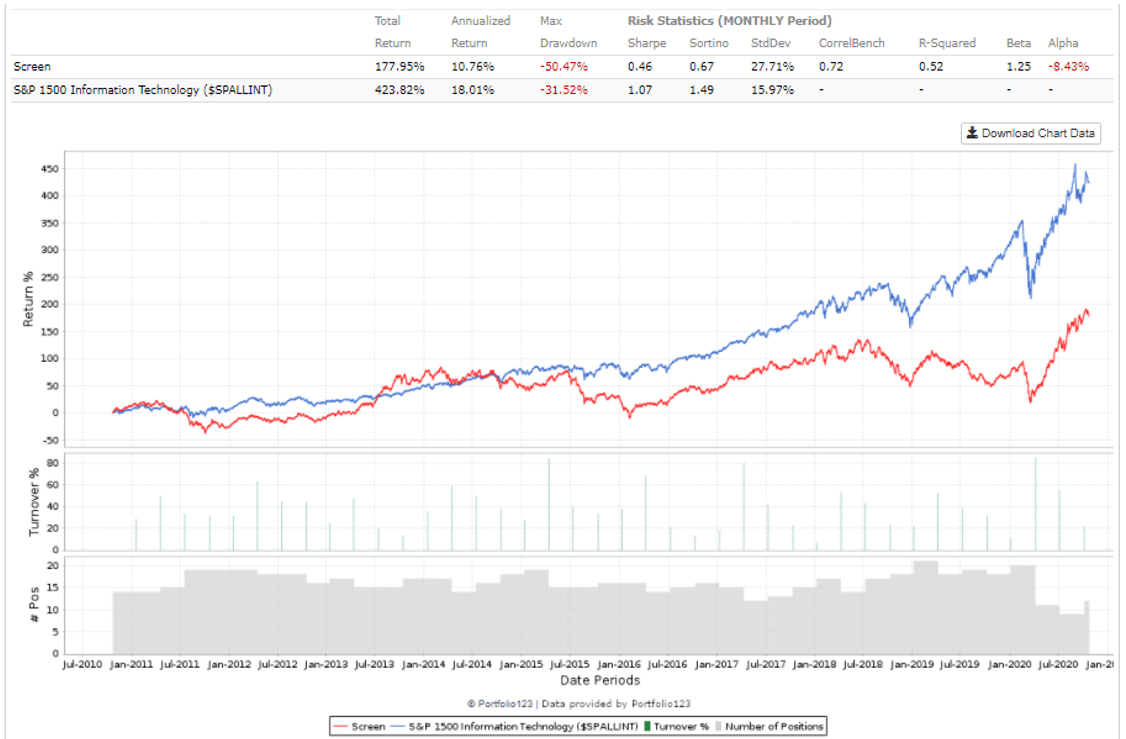
Source: Portfolio123
Similar to the trailing undervalued R40 portfolio, the undervalued forward R40 stocks have underperformed the SP1500-IT index for nearly the entire period, with negative alpha.
Over all periods and metrics, undervalued forward R40 stocks have not fared well:
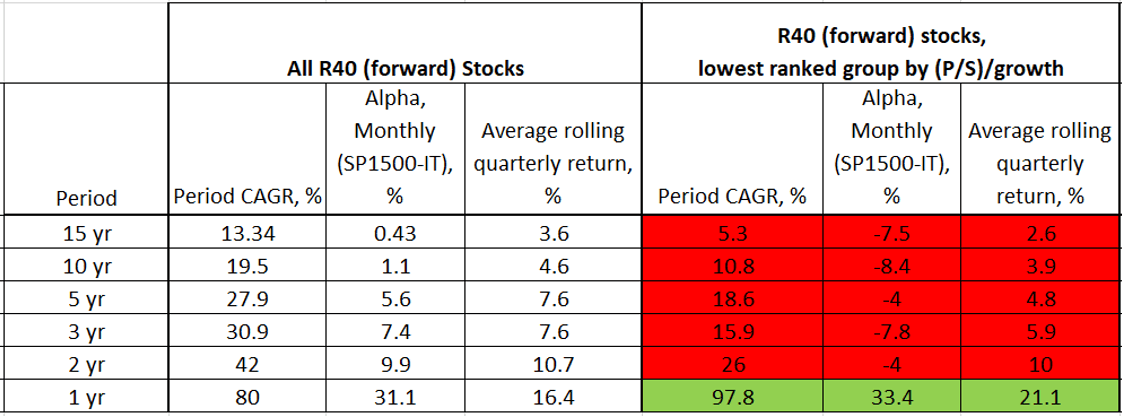
Source: Portfolio123 data, Author Table
Of note however, the last year the undervalued forward R40 stocks outperformed all R40 forward stocks. While COVID has been a catalyst for many SaaS stocks, undervalued software stocks and R40 (trailing) stocks underperformed. Interestingly the undervalued forward R40 stocks have outperformed this past year.
Overvalued Performance
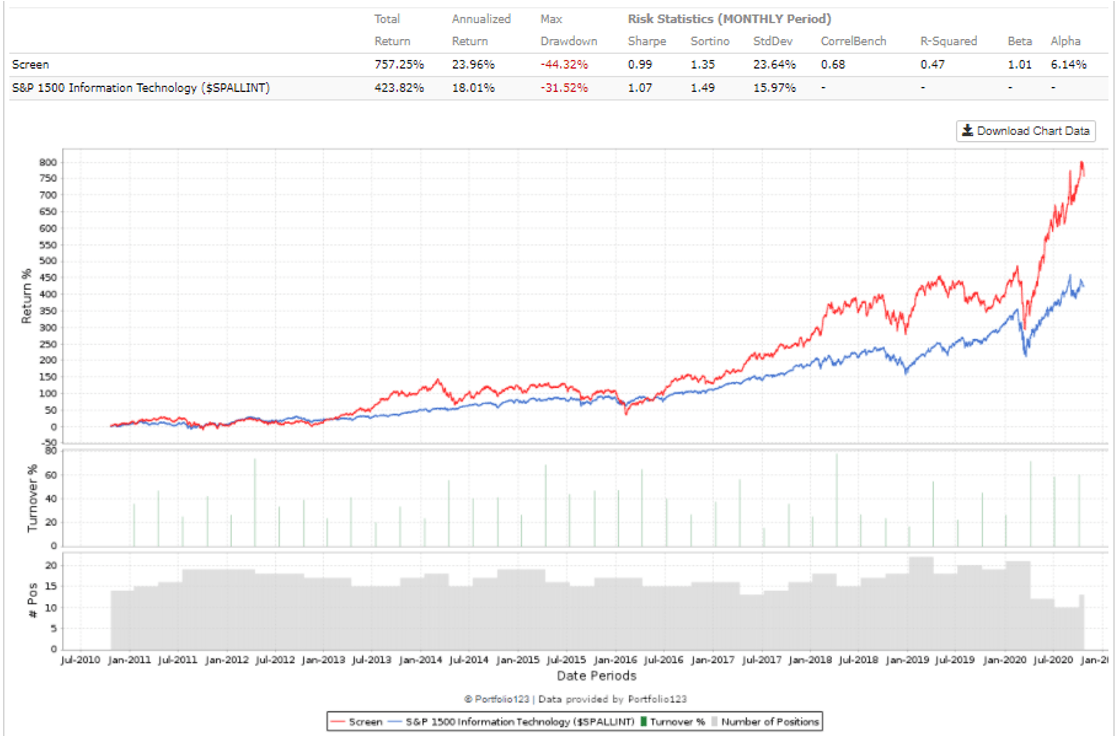
Our final group, the highest ranking of R40 forward stocks based on (P/S)/growth, has trailed the SP1500-IT over the last 10 years:
Source: Portfolio123
Overall, the high ranked group underperformed in terms of single periods and rolling tests, however was able to achieve higher alpha (had less volatility).
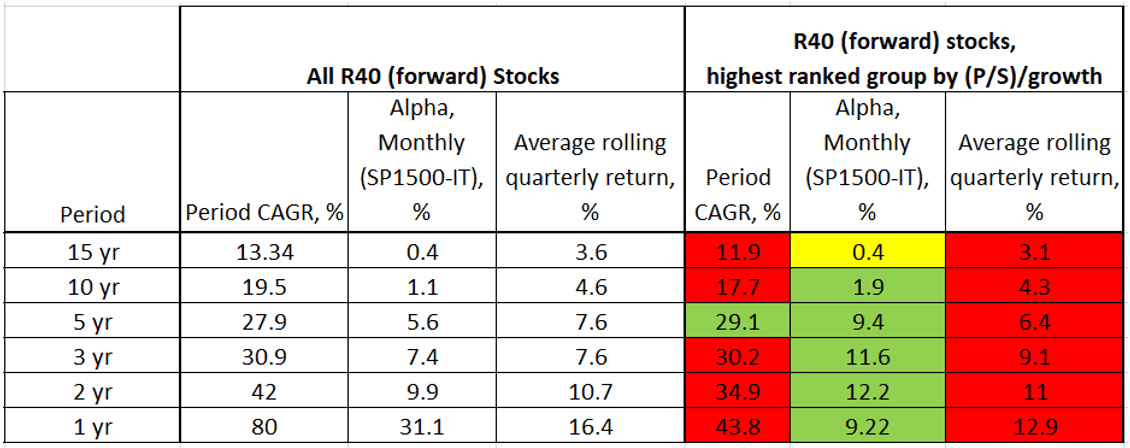
Source: Portfolio123 data, Author Table
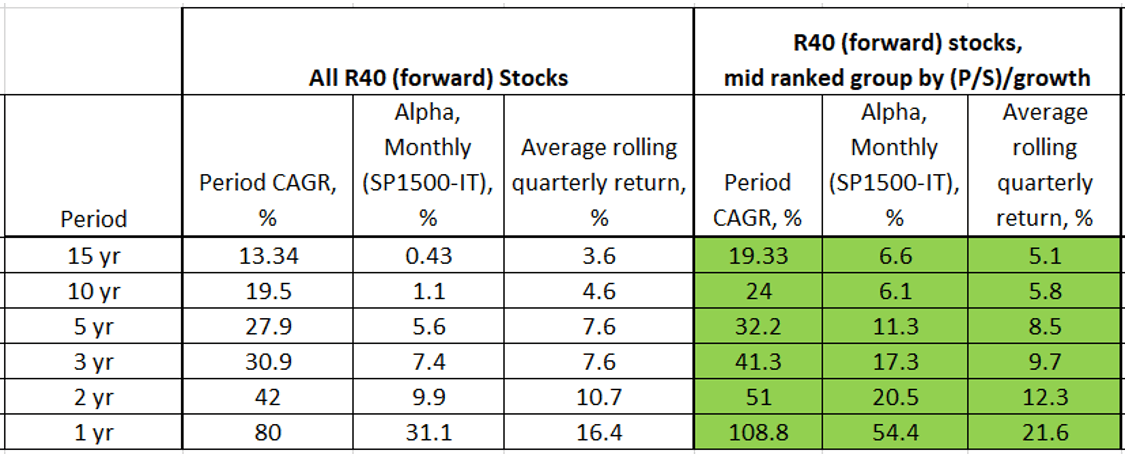
The overall picture of forward R40 stocks based on valuation groups is as follows:
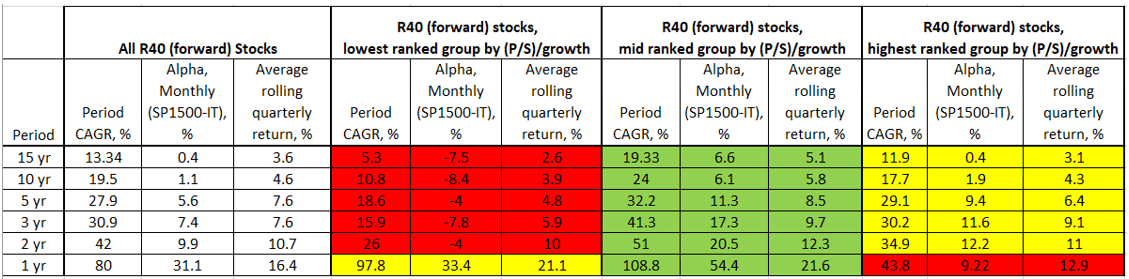
Source: Portfolio123, Author Table
As with our All Software Stocks and trailing R40 stocks, the undervalued group of forward R40 stocks has been the poorest performer. Where software stocks and trailing R40 stocks demonstrated close performance between the fairly and overvalued groups, our fairly valued group of forward R40 stocks has clearly been the winner in this instance.
Rule of 40 Stocks – Common Attributes based on Valuation (forward)
In terms of fundamentals, below are average values of these valuation groups for forward R40 stocks:
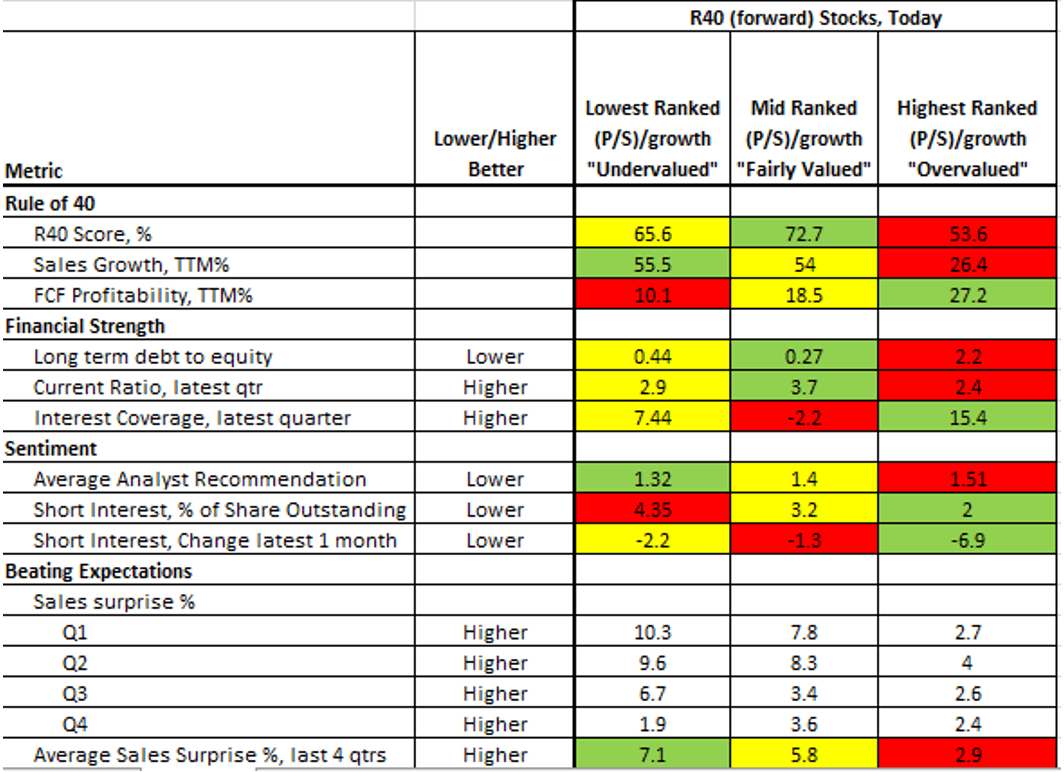
Source: Portfolio123, Author Table
As noted above, these “valued” buckets are relatively small, only 15-20 stocks per group at any given time, so the impact of outliers on averages can be significant. Nevertheless, the stocks under each group do paint some interesting pictures. Our mid-valued stocks had the highest average R40 score, but had middling average sales growth and FCF profitability values.
In terms of financial strength, the mid-valued group is the strongest, other than a very low average interest coverage value (which is likely due to an extreme outlier).
Interestingly, the group who has had middling performance over time, the “overvalued” group, at time of writing also has the lowest short interest per group, and highest decrease over the last month. As we saw with trailing R40 stocks, undervalued stocks have the highest analyst recommendations.
And finally in terms of sales surprises over the last 4 quarters, the undervalued group has posted the highest magnitude of surprises to analyst estimates.
Rule of 40 Stocks and Valuations - Putting it all together
We’ve covered a lot of ground in this piece, but have discovered some interesting trends when it comes to valuation of SaaS and R40 stocks.
Although the popular approach of using scatterplots and linear regressions to find average valuation groups may not be statistically robust, it is a common approach to potentially find those stocks that are undervalued. The key question we were looking to answer was whether R40 SaaS companies considered undervalued by this method offered any opportunity for outperformance or alpha.
For the All Software Stocks and R40 (trailing) stock portfolios, the mid-valued and overvalued stocks have tended to outperform. This may suggest that these stocks receive rich valuations for a reason, as we saw many of these highly valued stocks are very strong financially, and tend to outperform analyst expectations on sales estimates. Undervalued stocks tend to underperform, again perhaps for a reason.
When using forward values for R40 stocks, undervalued stocks continue to underperform, however the stocks with middling valuations have tended to outperform. Again, middling and highly valued R40 stocks tend to have stronger fundamentals than the undervalued as well.
We must now ask the question, are “undervalued” and “overvalued” appropriate terms for these groups of stocks? “Undervalued” usually implies an inefficiency in the market that has not yet recognized the value in a stock(s). In my research, I have found that these “undervalued” stocks have floundered in underperformance over time, and that on several metrics they are in fact inferior to the “mid” and “overvalued” stocks.
Perhaps terms such as “low”, “medium” and “high” valuations would be more appropriate.
How do we use this information? Just buy those R40 stocks with the richest or middling valuations? As much as I love Starbucks coffee, as a value investor deep down I have never subscribed to the “Starbucks effect”, i.e. buying something just because it is expensive. That said, in looking at typical characteristics of these stocks, we can now start refining our criteria in R40 stock selection.
In Part 4 of this series, we will look at developing a ranking system of several factors for R40 stock selection, including valuation, some of the fundamental metrics covered in this piece, and some new factors that are unique to SaaS companies.
Until then, happy investing!
But before we go…
At time of writing, here are the Rule of 40 stocks (trailing) based on the valuation groups covered in this piece:
“Low” valued:
Ticker | Name | Sales Growth, % TTM | FCF Mgn, % TTM | R40 Score | (P/S)/sales growth |
Digital Turbine Inc | 69.72 | 20.58 | 90.3 | 0.19 | |
Casa Systems Inc | 62.55 | 10.07 | 72.62 | 0.01 | |
Clarivate Analytics Plc | 46.45 | 2.88 | 49.33 | 0.22 | |
Cloudera Inc | 29.05 | 18.07 | 47.12 | 0.12 | |
Chicken Soup for the Soul Entertainment Inc | 109.95 | -26.13 | 83.82 | 0.02 | |
Dropbox Inc | 17.94 | 22.68 | 40.62 | 0.23 | |
EverQuote Inc | 58.68 | 4.28 | 62.96 | 0.05 | |
InterDigital Inc | 20.62 | 30.28 | 50.9 | 0.24 | |
Spark Networks SE | 95.53 | 4.36 | 99.89 | 0.01 | |
Proofpoint Inc | 20.76 | 24.09 | 44.85 | 0.26 | |
Ribbon Communications Inc | 33.72 | 6.55 | 40.27 | 0.03 | |
Smith Micro Software Inc | 51.72 | 27.05 | 78.77 | 0.07 | |
Square Inc | 49.04 | 1 | 50.05 | 0.24 | |
Upland Software Inc | 41.7 | -0.04 | 41.66 | 0.1 | |
Zillow Group Inc | 103.35 | 10.04 | 113.39 | 0.05 | |
Zix Corp. | 82.88 | 2.61 | 85.49 | 0.02 | |
Zynga Inc | 52.32 | 15.42 | 67.74 | 0.1 |
Source: Portfolio123, Author Table
“Mid” Valued:
Ticker | Name | Sales Growth, % TTM | FCF Mgn, % TTM | R40 Score | (P/S)/sales growth |
Alteryx Inc | 54.25 | 3.41 | 57.66 | 0.33 | |
salesforce.com Inc | 31.58 | 22.03 | 53.61 | 0.35 | |
CrowdStrike Holdings Inc | 86.39 | 26.6 | 112.99 | 0.47 | |
CyberArk Software Ltd | 15.72 | 27.79 | 43.51 | 0.54 | |
Dynatrace Inc | 28 | 19.29 | 47.29 | 0.58 | |
Electronic Arts Inc | 15.02 | 32.93 | 47.95 | 0.41 | |
Elastic NV | 53.18 | -0.78 | 52.41 | 0.34 | |
Facebook Inc | 18.71 | 27.99 | 46.69 | 0.51 | |
Mitek Systems Inc | 18.71 | 24.17 | 42.88 | 0.3 | |
Svmk Inc | 23.81 | 19.78 | 43.59 | 0.36 | |
Solarwinds Corp | 10.51 | 32.04 | 42.54 | 0.61 | |
Take-Two Interactive Software Inc | 19.81 | 28.71 | 48.52 | 0.27 | |
Twilio Inc | 53.33 | -1.05 | 52.29 | 0.5 | |
VMware Inc | 17.29 | 33.31 | 50.6 | 0.28 | |
Workday Inc | 22.54 | 18.75 | 41.29 | 0.55 | |
Wix.com Ltd | 25.59 | 21.08 | 46.68 | 0.62 | |
Slack Technologies Inc | 51.39 | 2.33 | 53.71 | 0.37 | |
Zoom Video Communications Inc | 190.37 | 52.57 | 242.94 | 0.53 |
Source: Portfolio123, Author Table
“High” valued:
Ticker | Name | Sales Growth, % TTM | FCF Mgn, % TTM | R40 Score | (P/S)/sales growth |
Adobe Inc | 17.27 | 39.59 | 56.86 | 1.01 | |
Autodesk Inc. | 20.62 | 37.36 | 57.98 | 0.72 | |
ANSYS Inc | 9.36 | 32.47 | 41.83 | 1.86 | |
Cadence Design Systems Inc | 9.36 | 33.22 | 42.58 | 1.3 | |
Check Point Software Technologies Ltd | 3.47 | 54.13 | 57.6 | 2.26 | |
Coupa Software Inc | 43.76 | 16.16 | 59.92 | 0.9 | |
CoStar Group Inc | 18.56 | 29.3 | 47.85 | 1.1 | |
Datadog Inc | 80.77 | 9.38 | 90.15 | 0.77 | |
DocuSign Inc. | 40.59 | 12.76 | 53.34 | 0.79 | |
Descartes Systems Group Inc (The) | 11.82 | 33.36 | 45.18 | 1.16 | |
MSCI Inc | 9.61 | 33.11 | 42.72 | 1.85 | |
ServiceNow Inc | 30.92 | 26.44 | 57.36 | 0.77 | |
Okta Inc | 44.56 | 11.53 | 56.1 | 0.85 | |
Qualys Inc | 14.09 | 39.71 | 53.8 | 0.74 | |
Rambus Inc | 2.67 | 64.96 | 67.63 | 2.43 | |
Shopify Inc | 73.4 | 7.55 | 80.95 | 0.64 | |
S&P Global Inc | 12.44 | 37.29 | 49.74 | 0.86 | |
Verisign Inc | 2.18 | 54.39 | 56.57 | 8.01 | |
Zscaler Inc | 42.41 | 8.14 | 50.55 | 0.98 |
Source: Portfolio123, Author Table
Disclosure: I am/we are long COUP, CRWD, OKTA, TWLO, ZM, ZS. I wrote this article myself, and it expresses my own opinions. I am not receiving compensation for it (other than from Seeking Alpha). I have no business relationship with any company whose stock is mentioned in this article.
Additional disclosure: This article is for informational purposes only. I am an individual investor and writer, not an investment adviser. Readers should always engage in his or her own research and consider (as appropriate) consulting a fee-only certified financial planner, licensed discount broker/dealer, flat fee registered investment adviser, certified public accountant, or specialized attorney before making any investment, income tax, or estate planning decisions.
Editor's Note: This article covers one or more microcap stocks. Please be aware of the risks associated with these stocks.
