Why Valuation Matters: A Stryker Case Study

Stryker is a fantastic company with a great earnings history, but investors need to take into account extreme valuations, both low and high.
In this article, I review the performance of my previous Stryker strategies.
I also perform an updated analysis and share why I recently took profits in the Stryker position I bought in March.
Introduction
Humans love narratives. Other than personal experience, narratives might be the primary way we learn, and they are extraordinarily powerful. But when we are investing, narratives can be dangerous. A compelling story can sometimes blind us to what the economic fundamentals are telling us. For long-term investors, economics will eventually win out, so choosing numbers over stories is important for long-term success. The problem is that numbers can be boring, and occasionally the stories and narratives can be right. Layered on top of all this are a variety of psychological bias we all have, which often can be magnified by a good story and cause to think about things in a fundamentally flawed way. Situations where narratives reinforce natural psychological biases we have can be especially dangerous to performance when the narratives turn out to wrong.
As a person who writes about stocks, it can be difficult to share my ideas in a compelling way while also avoiding writing narratives, but I try my best to replace narratives with an explanation of my investing process and then follow up on the results of that process over time. The point of this exercise is to demonstrate the strengths and the weaknesses of process so that readers can see the results over time. So, I'm going to begin this article with a history of my previous Stryker (SYK) analyses on Seeking Alpha in order to share how my process works in practice and the results it has produced.
A little over a year ago, I wrote my first Stryker article titled "Stryker: A 10-Year Full-Cycle Analysis" and, after performing the analysis, I determined that Stryker was a "sell" at that point in time.
...we get an expected 10-year, full-cycle CAGR of +2.13%. This is significantly below the 4% threshold I use for a "Sell" rating, so Stryker is currently a "Sell" for me.
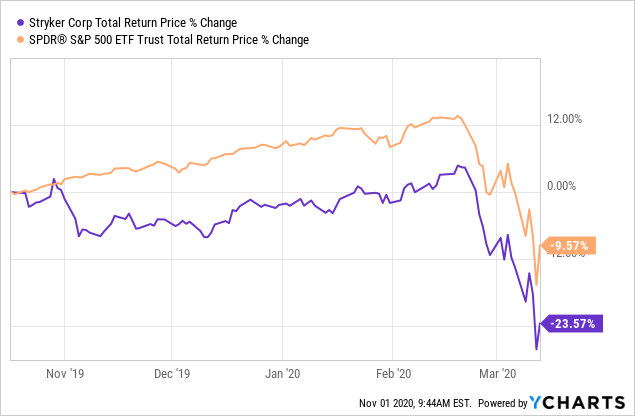
And I went on in the article to suggest some alternative investments and a strategy that I thought could net Stryker owners some "free shares" after the price had fallen to a more reasonable level based on long-term forward return expectations. At the time of the publication of that article, on 10/17/19, Stryker's price was $215.56.
A few months later, Stryker's price had fallen significantly, to below $165.
 Data by YCharts
It's worth noting that during this time, even though the entire market was lower, Stryker stock had significantly underperformed the S&P 500. And on March 16, 2020, I published my second article "Don't Stryker Until The Valuation Is Right". This article served three purposes. The first was as a follow up to the strategy I had suggested to Stryker shareholders in October 2019. The suggested strategy would have netted investors who sold in October a ~25% free share gain by mid-March. (In other words, if a Stryker shareholder had sold 100 shares in October, they could have taken that same money, and for no extra cost, purchased 125 shares in March, increasing their Stryker position by 25% without any additional cost.) That strategy was for Stryker shareholders who really liked the company and simply wanted to buy back in at a fair price when the stock was no longer overvalued.
The second purpose was to share my valuation process with readers again and show where Stryker's valuation stood at that particular point in time. (That's something I'll do in this article as well.) And the third purpose was to share the price at which an investor like myself, who would like a margin of safety with my potential purchase, could get it. Here is what I had to say in the March article:
Even though this part of the demonstration is complete and the goal of gaining 20-25% worth of free shares was a success, I am not actually buying Stryker stock yet because I prefer to have a margin of safety along with high expected future returns. So, personally, I will wait until Stryker has an expected 10-year CAGR over 12% before I consider buying the stock. Currently, I estimate that threshold would be crossed at about $125 per share.
As luck would have it, on March 23rd, Stryker crossed my $125 buy threshold, and I bought the stock. I noted it in the comment section of the article I had published just a week earlier.
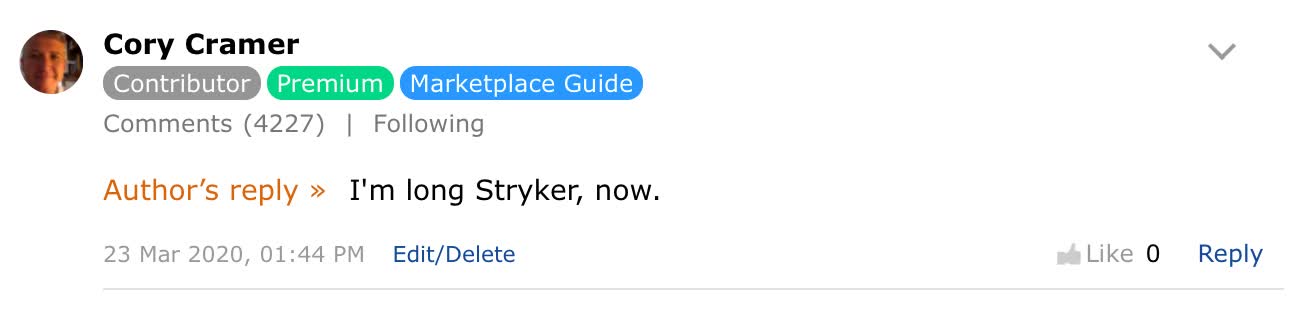 Since March turned out to be a very busy time for me, I wasn't able to write a full article about the purchase until June, when I wrote my third Stryker article "Stocks I Bought On The Dip: Stryker Corporation". Once again, in that article I took readers through my valuation process, and since Stryker's price had risen significantly, I shared at what price I would prepare to sell Stryker if the price kept rising.
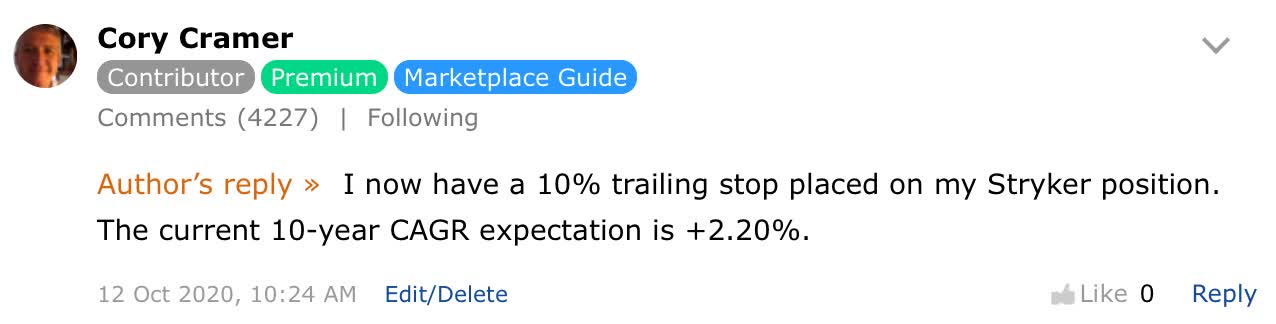
I'm back to Neutral on the stock again, but just as I shared my buy price before it occurred back in March (FYI, my buy price remains at $125 should we have a double-dip), but I've also shared my sell threshold of $215, which is a price the stock has already flirted with a few weeks ago. It's likely I won't sell as soon as it crosses that threshold, but will let it run about 10% above it before putting in a 10-15% trailing stop. This is a way for me to potentially capture upward momentum in the stock price once it goes beyond my Sell threshold.
A few months later, on October 12th of this year, I dropped a comment on that article, letting readers know that I had placed that trailing stop.
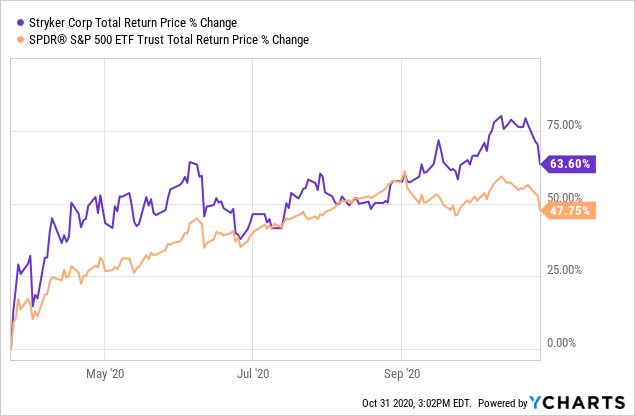
 Stryker's price ran up a little bit beyond my $215 threshold, topping out about $227.39, and I was stopped out this week around $204.65. Here was the total return performance during my holding period from March through October:
 Data by YCharts
While this wasn't the best return of the stocks I bought in March, it was a significant return that outperformed the S&P 500, and if one were to add in the 25% gain in shares an investor could have achieved by selling when I suggested it was overvalued in October of 2019, then they would have had a little over a 100% return in about a year's time, which is a substantial return. (Over the same time period, the S&P 500 is only up about +13%.)
Okay, these are the results my investing process has produced with Stryker so far, and a significant portion of those gains I was able to capture myself in Stryker's move from March through October. Next, I will share my valuation process and where Stryker stock stands at today's price.
(Source)
Examining Historical Earnings Cyclicality
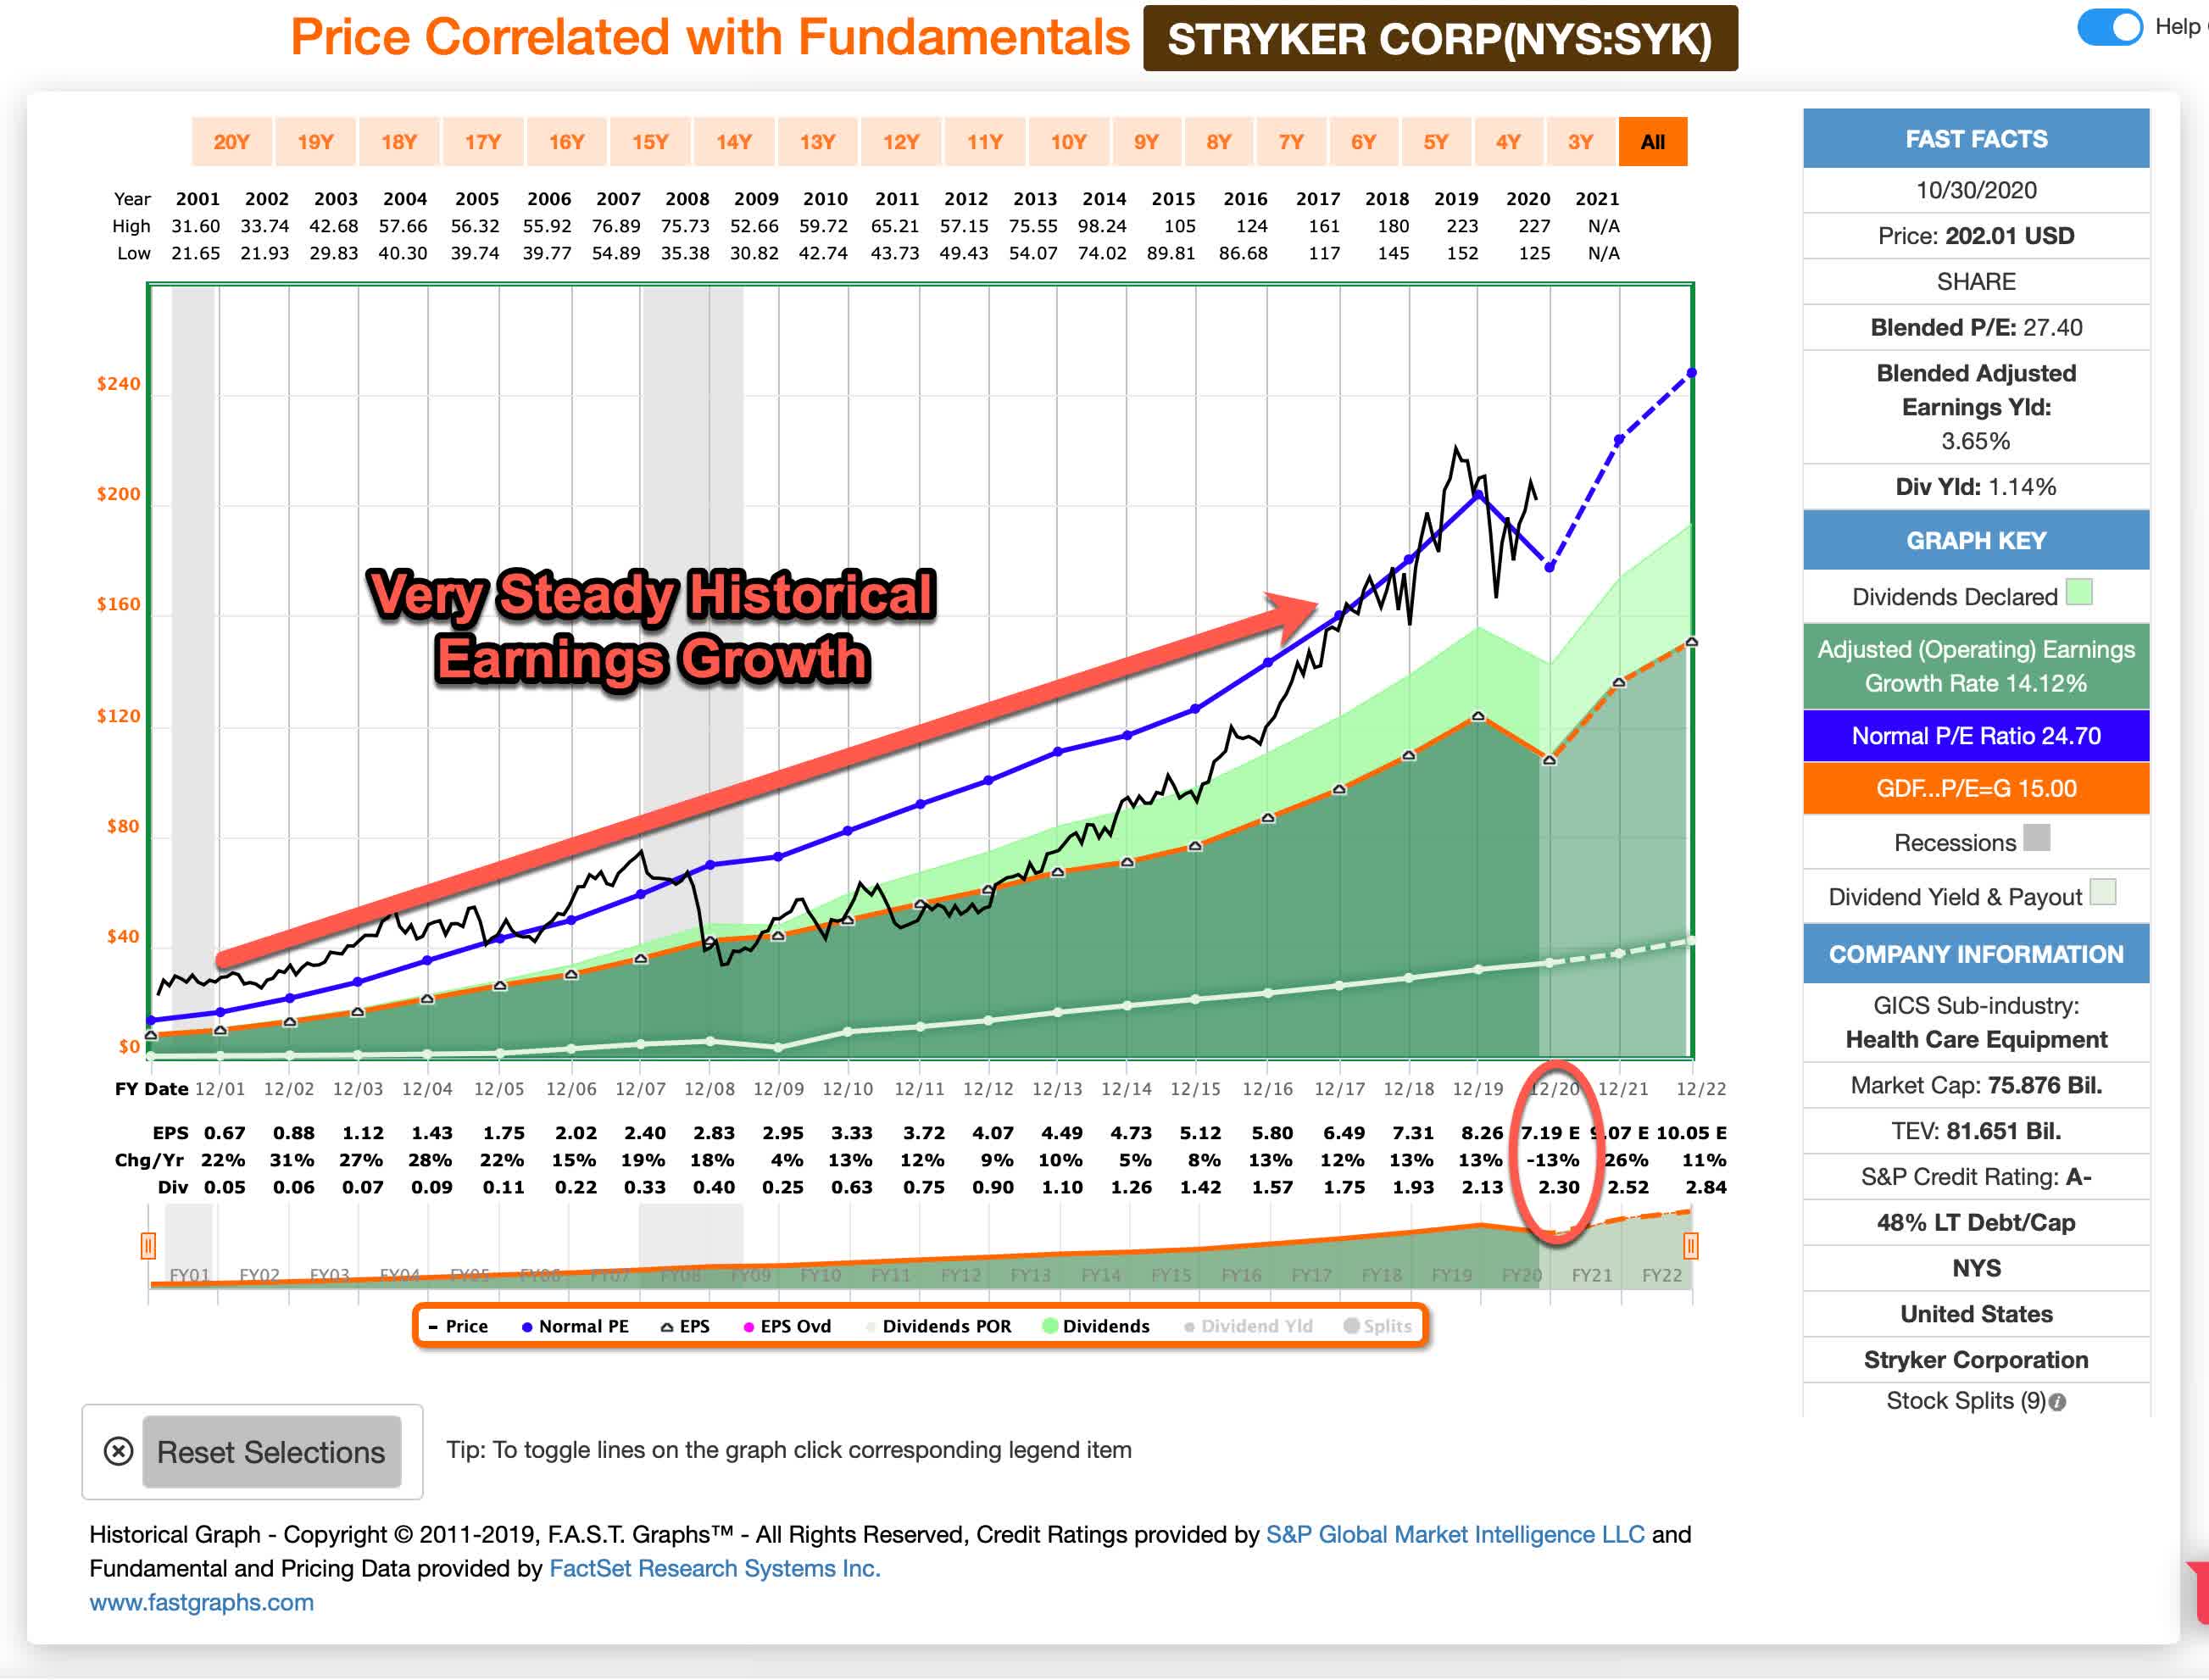 On the F.A.S.T. Graph above, the adjusted operating earnings for Stryker are represented by the shaded dark green area. Over the course of the past 20 years, Stryker has never had a year with negative EPS growth. I term businesses that have achieved this "secular growth" stocks, and they are an elite group. Last year, I sifted through about 5,000 stocks in order to see how many of these secular growth stocks there were that had grown earnings through two recessions, and I found less than 20. So, Stryker has truly been an elite business. This year, EPS is expected to fall -13% by analysts, so the streak may end, but Stryker's success has been undeniable over the past two cycles.
In my last Stryker analysis in June, analysts had expected EPS to fall -23%, so things are turning out to not be quite as negative for the stock right now with the current expectation of a -13% decline. That said, I think the increasing number of COVID cases we are seeing right now in Europe and the US could put pressure on Stryker's 2021 earnings and it's possible they might not recover as quickly as expected right now. In the bigger picture, though, it should be understood that Stryker doesn't have anything fundamentally wrong with their business. COVID-19 should probably be thought of as a once in 50-year event, and it's unlikely something like this will affect Stryker over the next decade once we get beyond 2021. For that reason, I have mostly chosen to disregard this year's earnings and will treat the current EPS decline mainly as an anomaly in my analysis.
With an essentially non-cyclical business like this one, fairly traditional valuation systems using P/E ratios and earnings growth estimates work reasonably well to predict future returns, so the full-cycle approach using traditional methods is what I used for Stryker (if earnings had been more cyclical, I would have used a different method of valuing the stock).
Sentiment Mean Reversion
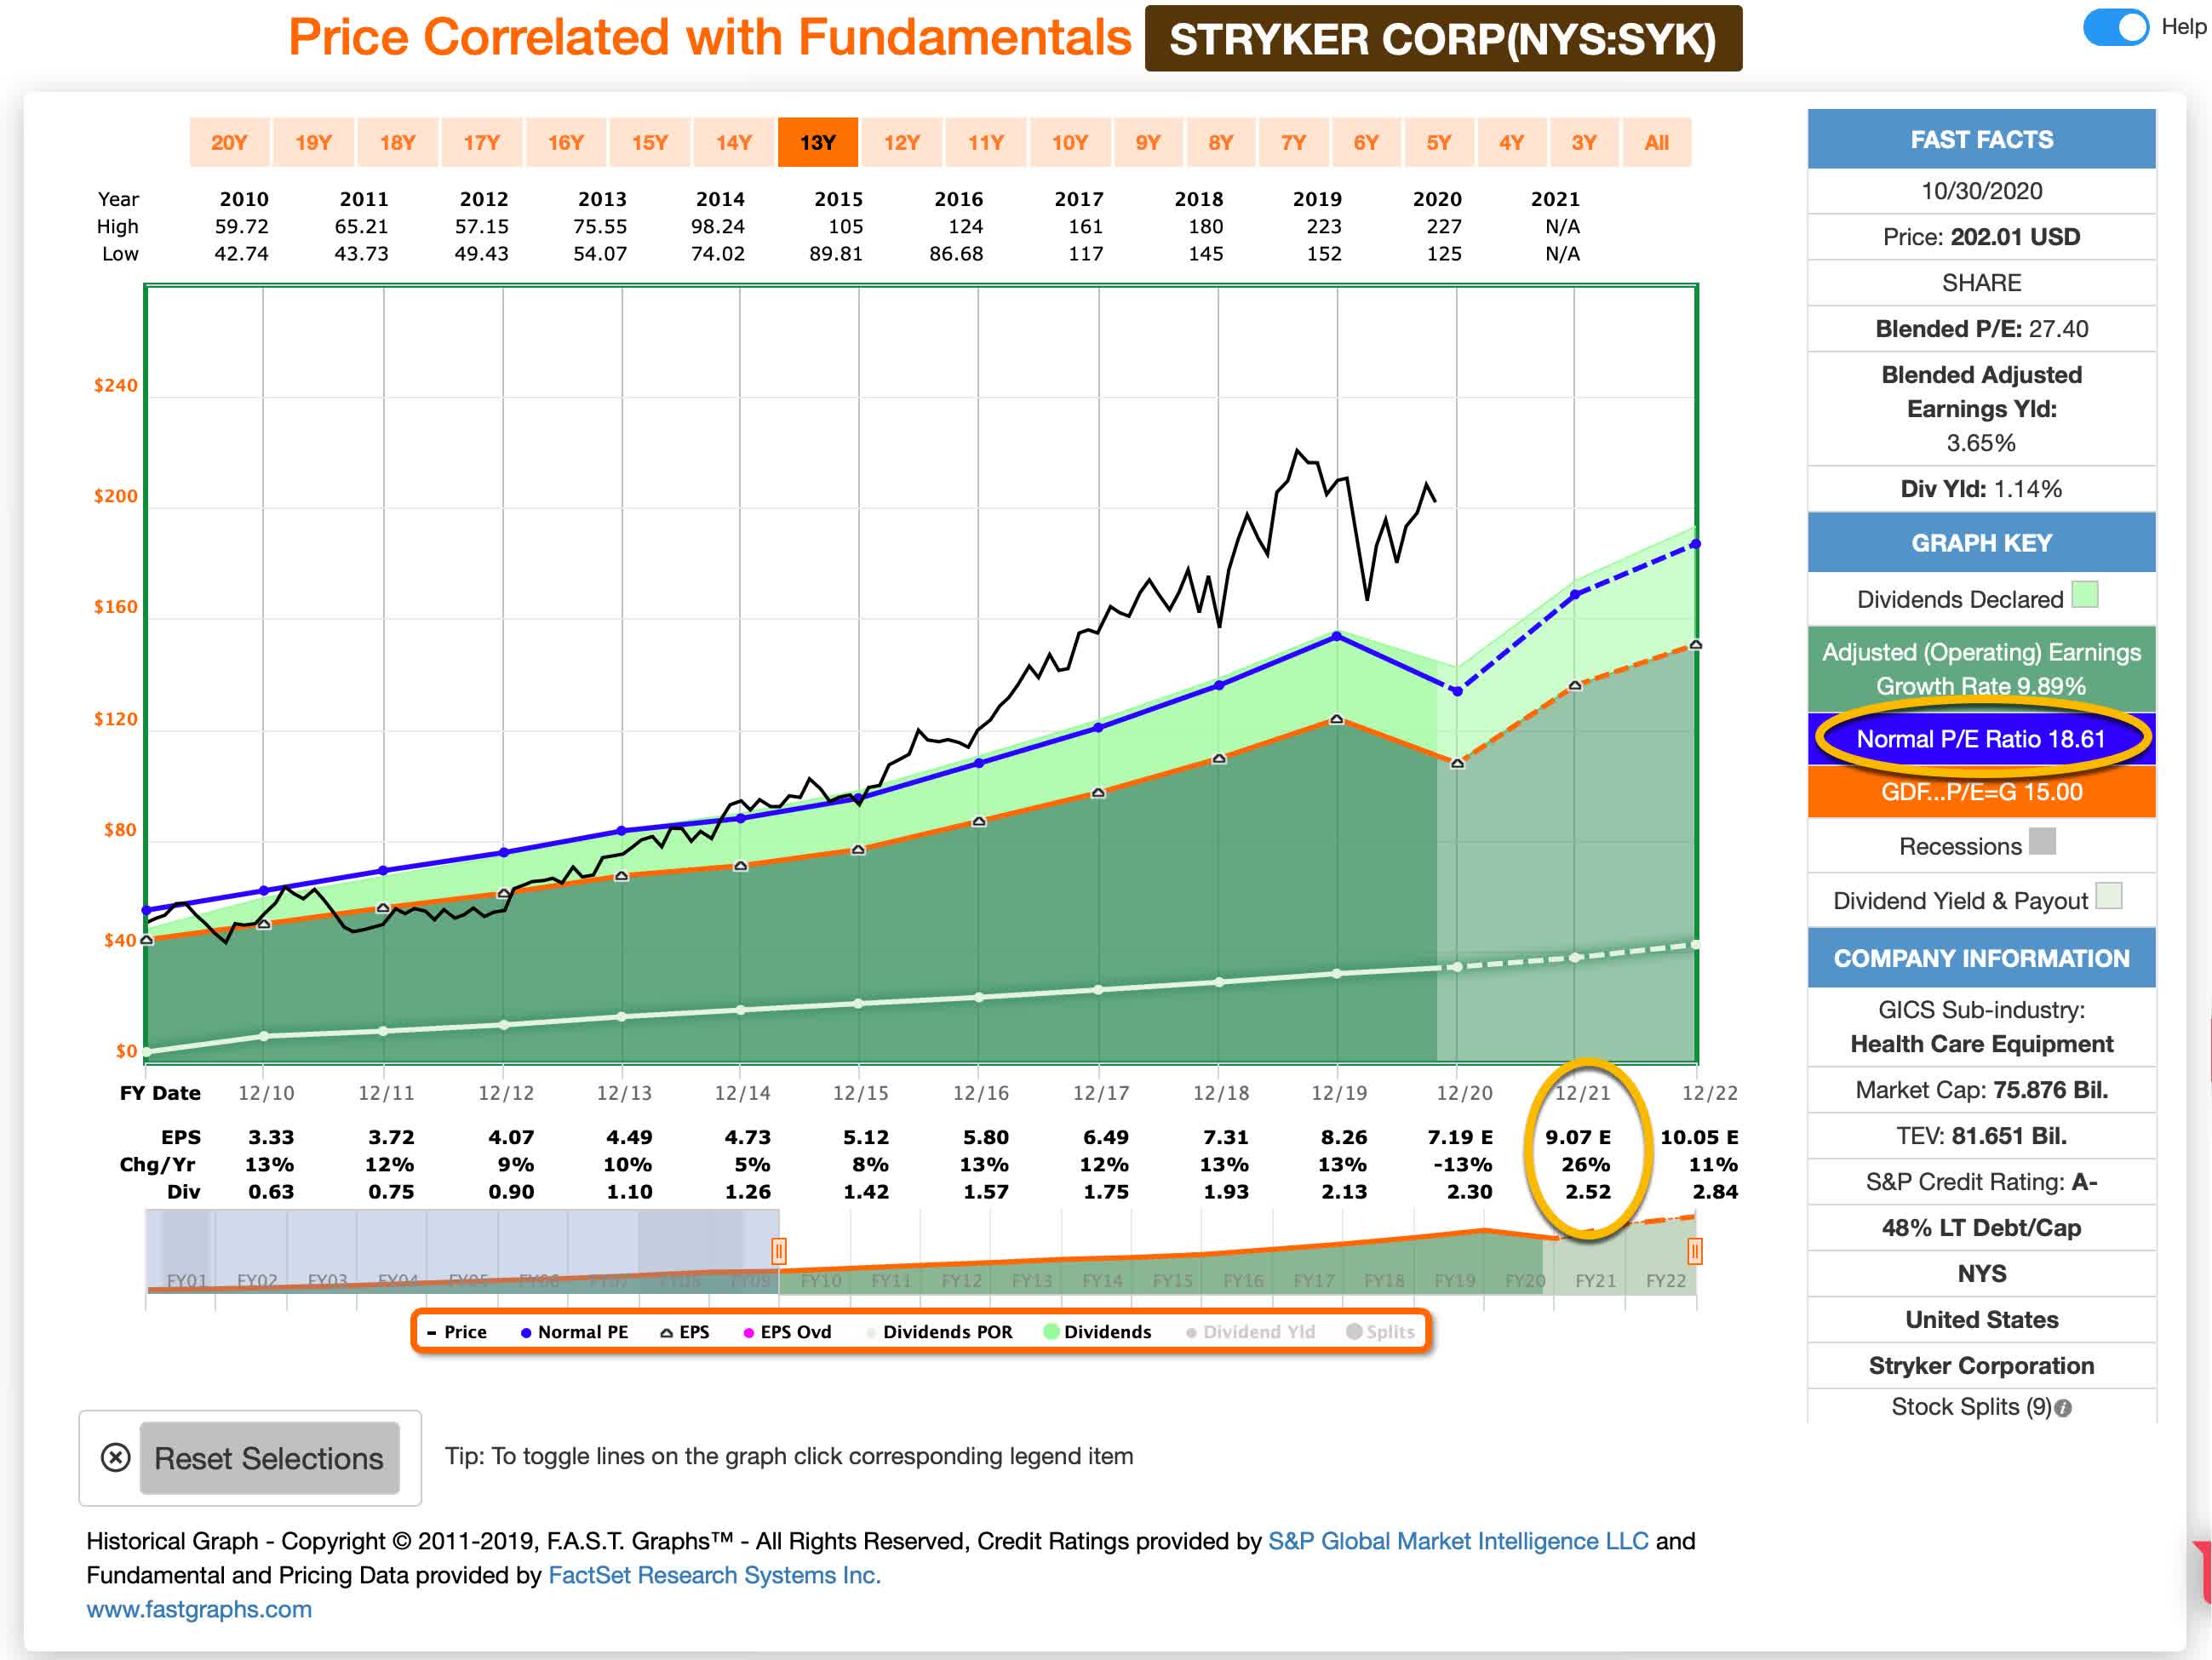 When trying to determine what one might gain or lose from sentiment mean reversion it can be very important what time-frame one takes when calculating the mean. My time-frame has changed in this article from the one I wrote in June because now we are clearly in a recession and we have some actual data from the middle of the recession to work with. My goal when establishing a time-frame is to make it long enough that it contains a full economic cycle. In the case of this analysis I started the cycle just after the last recession ended in 2010 and ran it through the end of 2021 using analysts' estimates for the last quarter of 2020 and for all of 2021. The reason I did this is because while I'm still including this year's -13% earnings decline for my earnings growth estimates later in the article, I fully expect Stryker's earnings to recover in 2021, so those earnings estimates seem more reasonable for me to use for the mean reversion.
As I write this, Stryker's blended P/E on the F.A.S.T. Graph is 27.40, while its normal P/E this past cycle has been 18.61. But for my analysis I've decided to use 2021 earnings estimates of $9.07 because I want to be generous to Stryker here and those earnings seem like a better baseline to use given Stryker's history and the unique nature of the current recession. When I use the $9.07 forward EPS estimate I get a much more reasonable 22.27 P/E ratio for the stock. And if Stryker were to revert from its current 22.27 forward P/E to its long-term average P/E of 18.61 from the previous cycle over the course of 10-years, and everything else was held equal, it would produce a 10-year CAGR of -1.78%.
Earnings Pattern
We previously examined what would happen if market sentiment reverted to the mean. This is entirely determined by the mood of the market and is quite often disconnected, or only loosely connected, to the performance of the actual business over the short term. In this section, we will examine the actual earnings of the business. The goal here is simple: We want to know how much money we would earn (expressed in the form of a CAGR %) over the course of 10 years if we bought the business at today's prices and kept all of the earnings for ourselves.
There are two main components of this: the first is the earnings yield, and the second is the rate at which the earnings can be expected to grow. Let's start with the earnings yield. Using 2021 earnings, the current earnings yield is about +4.49%. The way I like to think about this is, if I bought the company's whole business right now for $100, I would earn $4.49 per year on my investment if earnings remained the same for the next 10 years.
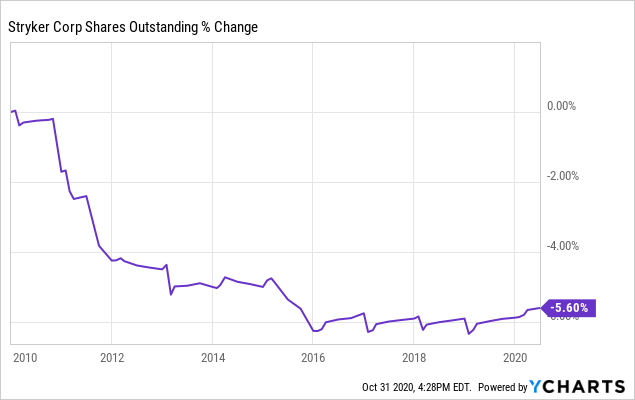
The next step is to estimate the company's earnings growth during this time period. I do that by figuring out at what rate earnings grew during the last cycle and applying that rate to the next 10 years. This involves calculating the EPS growth rate since 2010, taking into account each year's EPS growth or decline, and then backing out any share buybacks that occurred over that time period (because reducing shares will increase the EPS due to fewer shares).
 Data by YCharts
Stryker has bought back some stock this cycle, but not a whole lot, and in more recent years when the price was pretty expensive, the company basically stopped buying. I will back these out when calculating my earnings growth estimate. After doing so, I calculate a cyclically adjusted earnings growth rate of approximately +9.12% over the course of the last cycle.
Next, I'll apply that growth rate to current earnings, looking forward 10 years in order to get a final 10-year CAGR estimate. The way I think about this is, if I bought Stryker's whole business for $100, it would pay me back $4.49 plus +9.12% growth the first year, and that amount would grow at +9.12% per year for 10 years after that. I want to know how much money I would have in total at the end of 10 years on my $100 investment, which I calculate to be about $174.86 (including the original $100). When I plug that growth into a CAGR calculator, it translates to a +5.75% 10-year CAGR estimate for the expected business earnings returns.
10-Year, Full-Cycle CAGR Estimate
Potential future returns can come from two main places: market sentiment returns or earnings returns. If we assume that market sentiment reverts to the mean from the last cycle over the next 10 years for SYK, it will produce a -1.78% CAGR. If the earnings yield and growth are similar to the last cycle, the company should produce somewhere around a +5.75% 10-year CAGR. If we put the two together, we get an expected 10-year, full-cycle CAGR of +3.97% at today's price.
My Buy/Sell/Hold range for this category of stocks: above a 12% CAGR is a Buy, below a 4% expected CAGR is a Sell, and in between 4% and 12% is a Hold. Currently, SYK is just below my 4% sell threshold so it is a "sell" at this price.
About a year ago, I started using trailing stops after stocks had passed my sell threshold a bit in an effort to capitalize on any upward momentum in the stock price. In Stryker's case it didn't end up making much of a difference and I ended up selling at a similar price I would have without using the trailing stop. But I have had a few stocks, like Texas Roadhouse (TXRH), which I bought at about the same time as Stryker back in March and also got stopped out of last week, for which I was able to add an additional +30% to my earnings using the trailing stop method. So, every now and then, the trailing stop method can add a nice bonus to one's return.
Conclusion
Stryker is a great company with a bright long-term future, but the price relative to the expected earnings growth is on the high side even when we assume a full earnings recovery in 2021 (which with current COVID cases exploding isn't a certainty). If an investor wanted to trade out of the stock and try to buy back in at fair value and a lower price (a lower price which I think has a fairly high probability of occurring over the next few months) then I would take profits here and aim to buy the stock back around a price of $154 per share. For investors like myself who are looking for a substantial margin of safety, my new value buy price is $117.50.
If you have found my strategies interesting, useful, or profitable, consider supporting my continued research by joining the Cyclical Investor's Club. It's only $29/month, and it's where I share my latest research and exclusive small-and-midcap ideas. Two-week trials are free.
Disclosure: I/we have no positions in any stocks mentioned, and no plans to initiate any positions within the next 72 hours. I wrote this article myself, and it expresses my own opinions. I am not receiving compensation for it (other than from Seeking Alpha). I have no business relationship with any company whose stock is mentioned in this article.
