Editor's note: Yesterday, India's #1 trader Vijay Bhambwani, recorded a video on the most profitable segment of the market today - PSU stocks. That's right. PSUs are the hottest stocks in the market today...and you read about it first right here in Profit Hunter. We published this piece on PSU Banks by Apurva Sheth about 3 weeks ago. It makes sense to revisit it now that PSU stocks have started to run up.

Have you ever felt that you have lived the present situation before?
It's called Deja vu.
Right now, I'm experiencing a deja vu moment in the markets.
Banks were going through tough times even before the pandemic struck. Covid-19 amplified the effects.
But banks going through tough times isn't new.
They were in a similar situation back in 2016. Private sector banks were relatively better compared to PSU banks.
PSU banks were dealing with Non-Performing Assets (NPA) and big losses in March 2016. Here's how the headlines read back then.

If you have been following the news recently then you would know their situation is the same. The Covid-19 outbreak and the moratorium which followed has simply broken their back.
Common investors would run away from PSU banks at such times.
But you must not!
NEW: 5 Pandemic-Proof Smallcaps You Should Know About...
I believe there is no better time than right now for making an investment in PSU banks.
And I am not saying this based on a hunch or gut feeling.
I have lived through a similar moment back in 2016 and even guided my subscribers to solid profits in PSU banks back then.
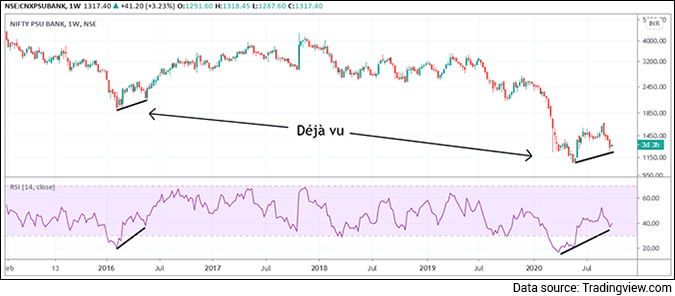
I believe the worst seems to be over for PSU banks. Here's a weekly chart of Nifty PSU Bank index.

PSU Banks are forming bullish divergence in Relative Strength Index (RSI) on weekly charts. RSI is a momentum indicator which shows the strength of the trend.
--- Advertisement ---
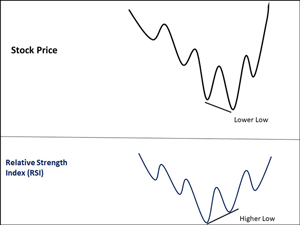
A bullish divergence in RSI indicates that the ongoing downtrend is losing steam. This doesn't guarantee a reversal but increases the chances.
The adjacent illustration will help you identify a bullish divergence in RSI.

You will notice that the price is in a downtrend and RSI is also falling along with it initially.
However, the RSI starts forming higher lows when price is still forming lower lows. This acts a signal that the ongoing trend may reverse.
If you want to know how to trade the RSI divergences then you can read my detailed article on Contrarian Trading with the RSI I wrote back in 2016.
Now here's the fun part.
It's not just the PSU bank index which is forming a bullish divergence with RSI. Several PSU banking stocks are also forming similar pattern on the weekly chart like they did back in 2016. I'm sharing some of them here.
Now you can see from the charts how PSU Banks fared after forming the bullish divergences in 2016. All these stocks generated phenomenal returns.
They did well for my subscribers back in 2016.
Here's a piece I wrote on My Contrarian Trades in the PSU Banking Space back in July 2016.
Now just because something has worked in the past doesn't guarantee that it will work in the present as well. However, it does increase the probability of the investment going in your favour.
Nevertheless, you should be disciplined and manage your risk well so that you doesn't lose much even if the investment doesn't work as expected.
Warm regards,

Apurva Sheth
Senior Research Analyst, Fast Profits Report
Equitymaster Agora Research Private Limited (Research Analyst)
PS: To get the details of the top 3 stocks in the market today... please click here...