Yields, Economic Growth, And Stock Prices - A New World For Investors

Interest rates are the fever chart of an economy.
They reflect short-term and long-term economic activity.
Their message suggests important changes have been taking places for investors.
Sydney Homer, described by Forbes as “the grand old man of the bond business”, wrote three important books for students of the bond market: “A history of interest rates”. “The price of money”, and “The great American bond market”. He coauthored with Dr. Martin L. Leibovitz “Inside the yield book”.
Although Homer spanned the breathtaking history of interest rates from Babylonia to recent times, one sentence has constantly resonated: “Interest rates are the fever chart of an economy.” It is through this lens that the behavior of 10-year Treasury bond yields provides fascinating information on where we have been and where we are going.
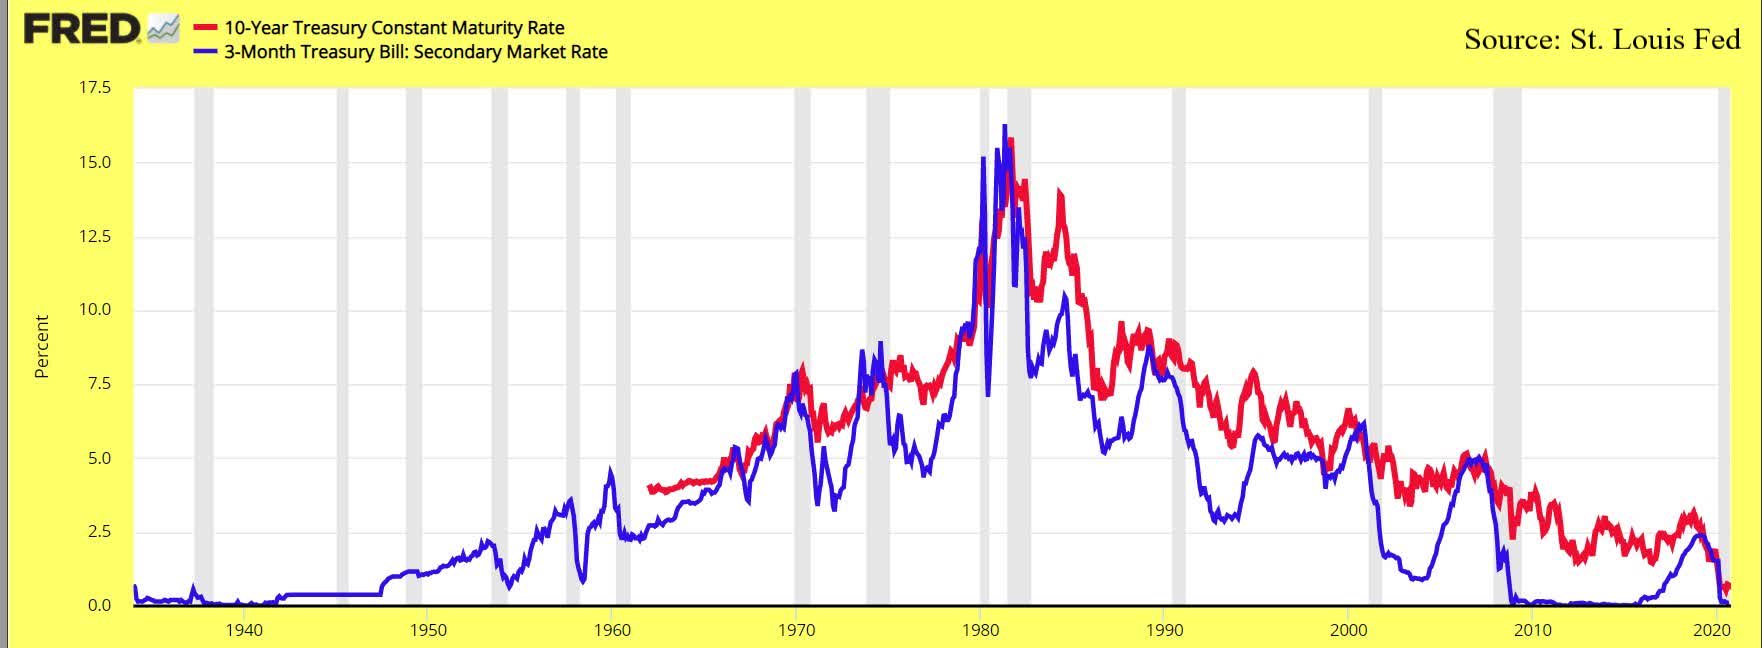 The above chart shows the vicissitudes of our economy. Zero percent interest rates in the 1930s reflected dismal and volatile economic performance as they did after 2000. They reflected well below average economic growth and a disinflationary environment – then as now.
The 1970s experienced interest rates at the other extreme of the range, rising to 16%. They signaled soaring inflation, volatile business cycles characterized by sharp recessions, and little or no growth in equity markets.
In this century the average interest rates have been about 5%. Deviations from this average reflect inflationary or disinflationary times.
Beginning in 2004 the Fed tried to force interest rates to 5% from less than 1%. The system could not absorb such abrupt and ill-advised change – and the great recession was soon under way.
The point is interest rates can be manipulated up to a point. Beyond that point, they create major imbalances and disruptions in the financial and economic system.
The current US and overall global environment have been created by an excessive level of debt syphoned by central banks. C. M. Reinhart, V. R. Reinhart, and K. S. Rogoff studied extensively the historical implications of high debt on economic growth in many countries over long periods of time. Their work applies perfectly to what is happening now.
The trend of 10-year Treasury bond yields provides considerable information about the outlook for economic growth and market expectations because it follows closely the growth of the nominal GDP of a country. Three major developed economies such as the US, Japan, and Germany are interesting case studies.
 The trend of 10-year Treasury bonds has been declining since the 1980s as the level of debt in the US soared to about 1.5 times GDP. This persistent increase in debt has been accompanied by slower GDP growth and higher income differentials. At the same time manufacturing employment as percent of total employment shrank from about 40% to less than 20% of total employment, reflecting our search for cheap sourcing of goods.
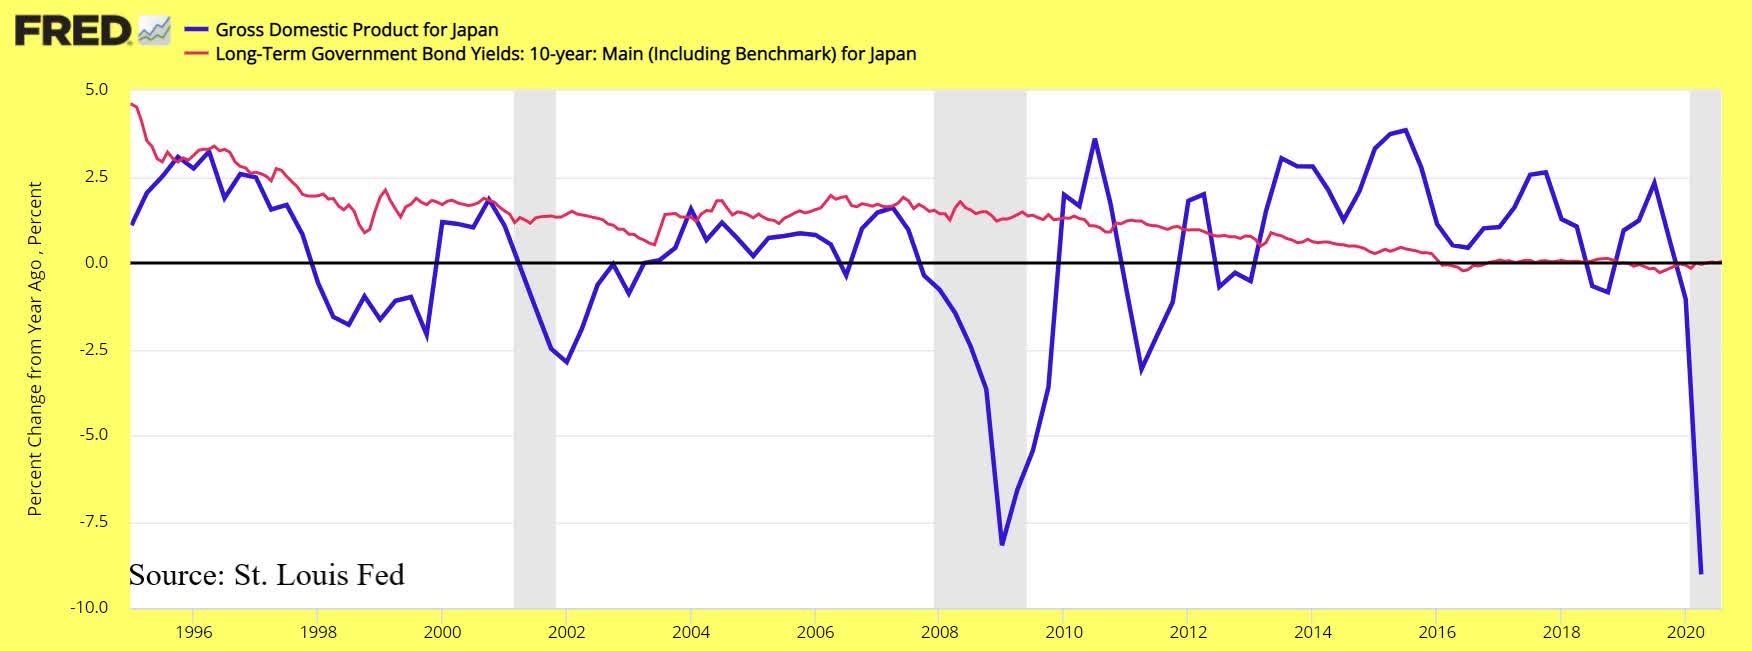 The Japanese experience is not much different from that of the US (see chart). Yields declined as the economy slowed down with volatile jolts as debt increased.
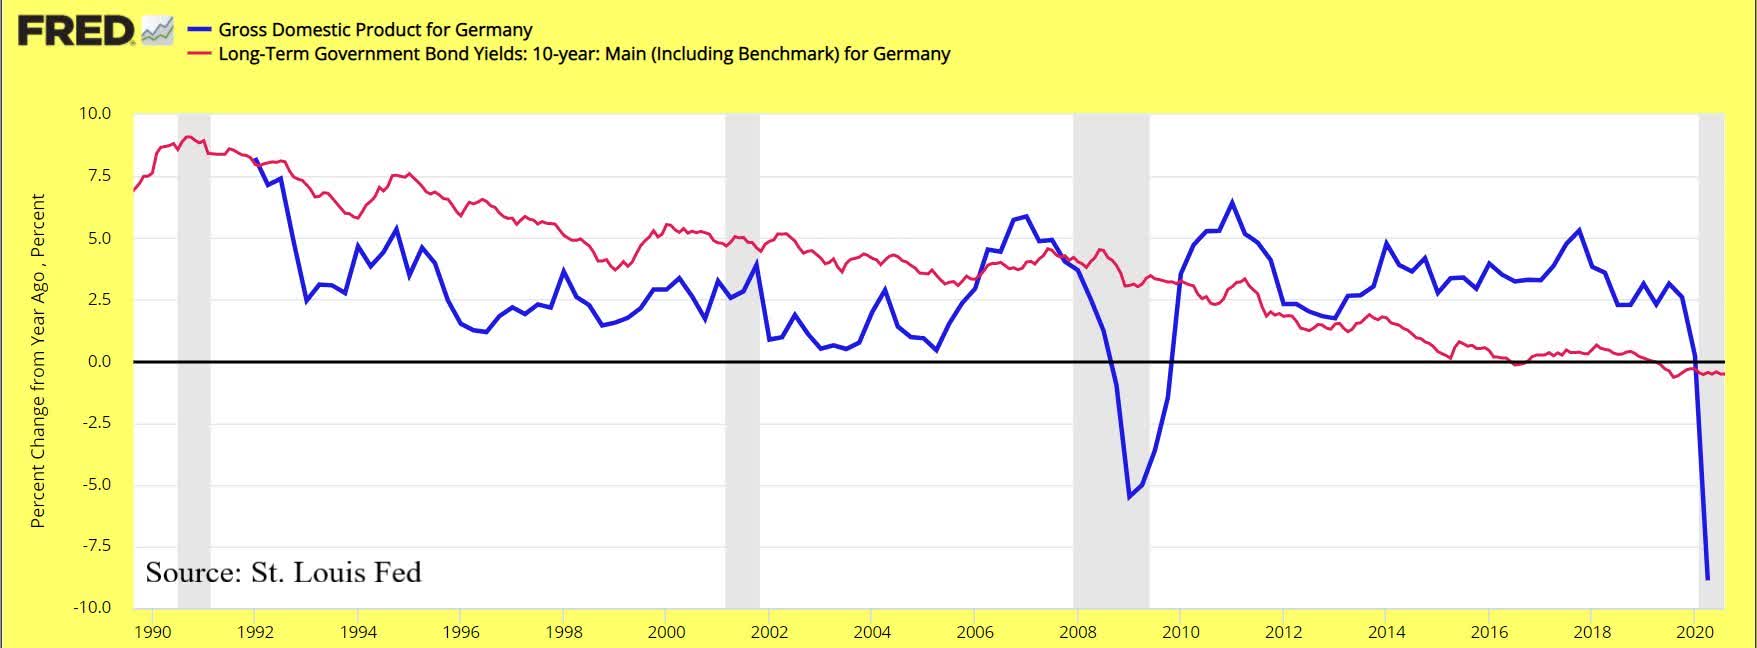
The German trends are like those of the US and Japan. Despite aggressive money printing by the ECB, their economic growth declined steadily from 7.5%. Germany’s graphs mirror closely the trends experienced by the US and Japan as yields declined to reflect the poor economic fortunes of Germany and Europe.
Global bond yields confirm the momentum of slower growth is pronounced and unlikely to turn around any time soon and point to a secular slowdown of economic growth driven by soaring debt. These countries have tried to free themselves from slow growth and huge debt loads with more debt. The fact that yields keep going lower has confused major financial analysts. But the relation between ever rising debt levels, slower economic growth, lower yields, and increasing income differentials is difficult to refute.
The conclusions of Rinhart, Rinhart and Rogoff relating high debt levels and slower growth remains an economic constant. Large amounts of debt are conducive to low growth rates.
The persistent downtrend and current levels of bond yields suggest the debt of the US has reached the critical stage causing the economy to grow at a well-below average pace. The experience of the past 20 years of Japan and Europe is too telling to be ignored. It is no coincidence, as Sydney Homer suggested long time ago, their levels of bond yields is at historically low levels and reflects their economic difficulties.
The experience of these countries shows it is difficult to escape stagnation with higher money printing. The level of bond yields confirms a country has reached this unfortunate time of its economic history.
The research mentioned above, the experiences of Japan and Europe, the levels of yields in the US suggest we are now as Japan and Europe were 20 years ago.
The US seems to be ignoring these global and diverse experiences and repeating the same historic strategic missteps. Trying to produce growth with more debt is a tragic fallacy if one looks at what has been happening in the Eurozone and Japan in the last 20 years.
The bottom line is the decline of bond-yields toward zero percent provides little help to small business or consumers in a no-growth economy and gives an enormous advantage to owners of large capital. They can borrow massive sums of money to invest and accumulate global assets creating huge oligopolies. The process, of course, further enhances income inequality and discontent. It concentrates assets in the hands of fewer economic players. The only outcome out of this process is slower economic growth.
 The implications are investors must be ready to face the fact that large debt levels will continue to depress economic growth and earnings. Equity prices will reflect the slow growth economic environment. Yields, meanwhile, will keep trading around current levels as they have been doing in Europe and Japan since 2016.
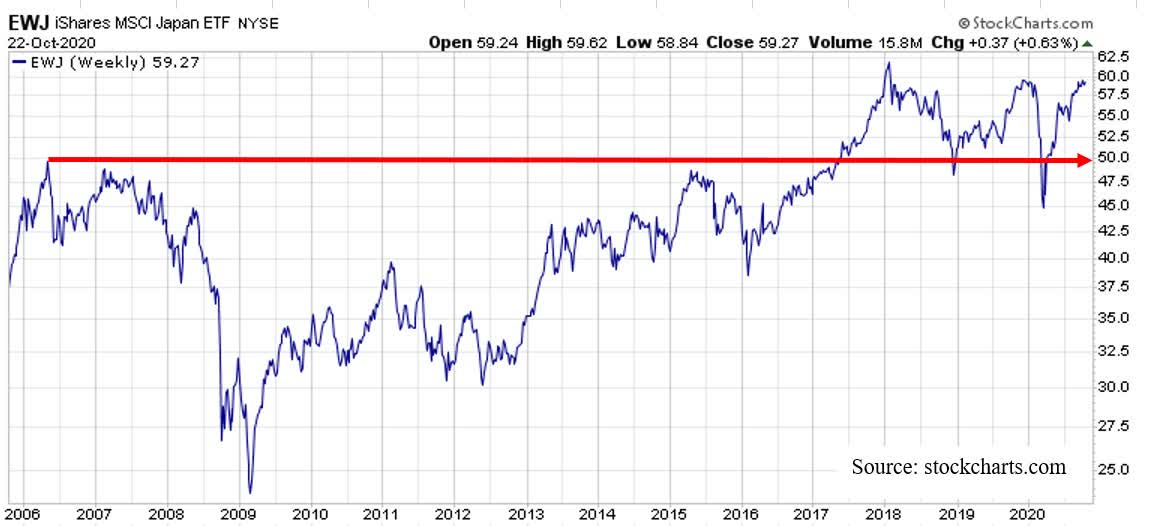
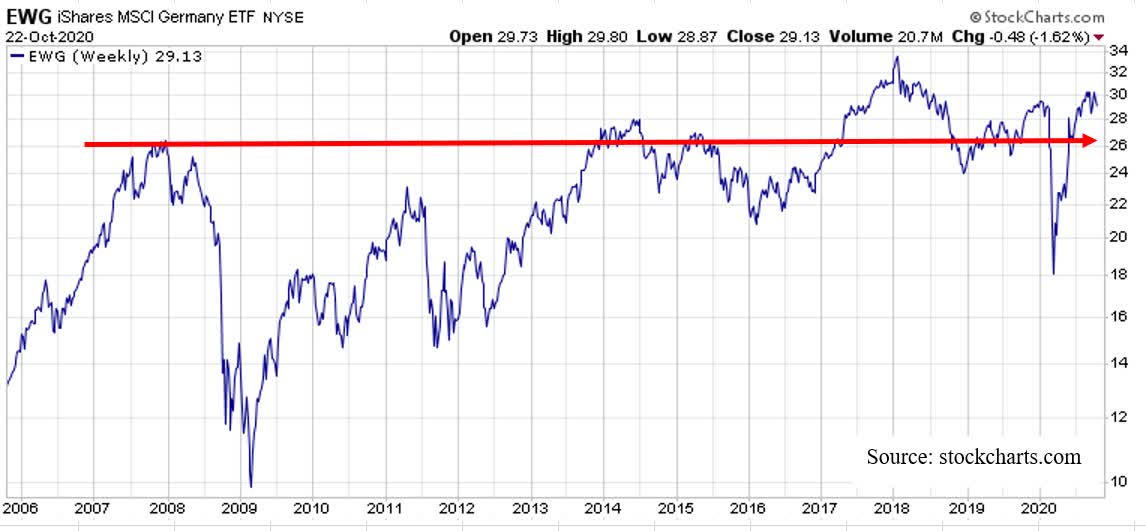
What happened to the equity markets of Germany and Japan since 2006 is a warning for US investors. Investing in this environment will make it even more critical to take advantage of the short-term trends of the business cycle (1-2 years).
Selecting the right market sectors depending on the phase of the business cycle will continue to be an important discipline. Investment decisions and portfolio strategy greatly depend on the direction of the business cycle. In a slowdown period of the business cycle, for instance, long-term bonds (TLT) remain a solid investment choice to improve the returns as they did from 2018 to recently.
Disclosure. I am long TLT to reduce the volatility of my portfolio.
Disclosure: I am/we are long TLT. I wrote this article myself, and it expresses my own opinions. I am not receiving compensation for it. I have no business relationship with any company whose stock is mentioned in this article.
Additional disclosure: I have a position in TLT only to reduce the volatility of the portfolio in a down market.
