149 Years Of Higher Returns For Lower Risk

Historical data on average one-year, five-year and fifteen-year returns for the S&P 500 since 1871, with all dividends continuously reinvested.
Historical data on the range of returns for one-year, five-year and fifteen-year holding periods.
History’s shocking surprise about risk and returns.
Historical Returns For Dividend Compounders
Using historical market data from Professor Robert Shiller's homepage, I calculated the returns that investors would have earned if they bought shares of the S&P 500, held those shares for one year and reinvested dividends each month back into the index at whatever price was then available. I calculated those returns for every single month since January 1871.
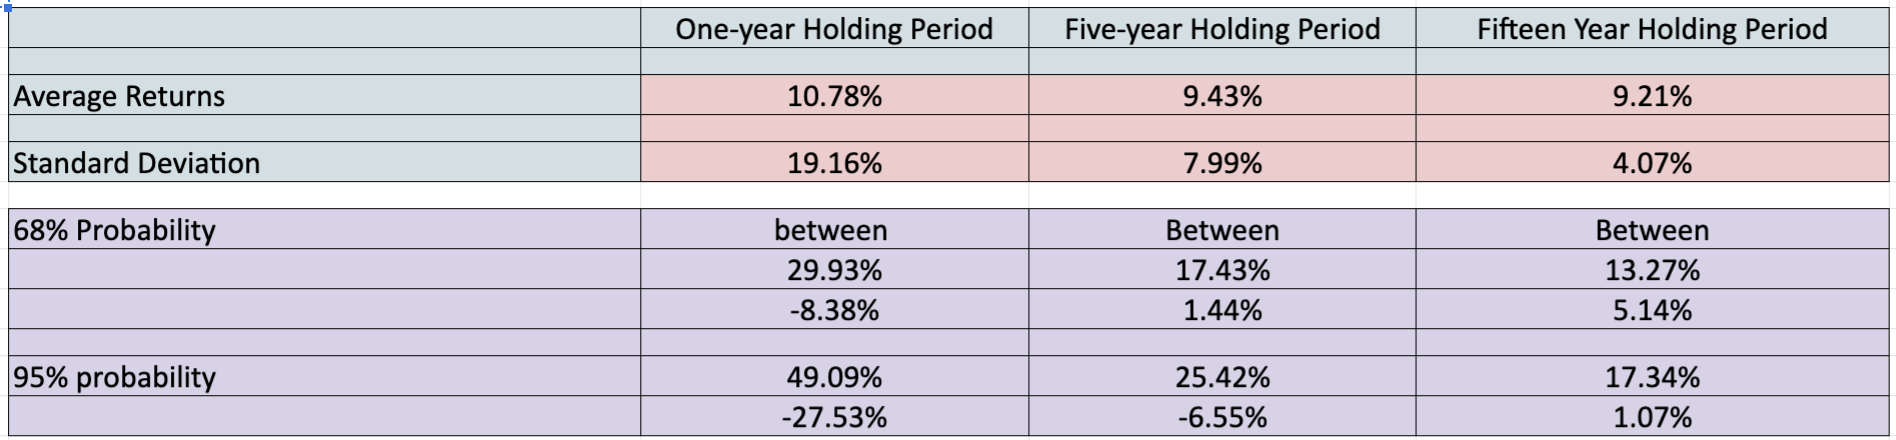
What I found is that throughout market history, investors earn an average return of 10.78% over a one-year investment period. I also did the exact same calculation for five-year and fifteen-year holding periods, and learned that on average, these investors earn annual returns of 9.43% and 9.21%, respectively.
(Source: Author-generated chart based on market data by Robert Shiller)
But average returns tell us little about real-world experience. What are the odds of the investor actually earning something in the range of 10.78% over any given one-year investment horizon? In fact, short-term investors earned between 10.5% and 11% returns exactly 23 times since 1871 - which is only 1.29% of the time.
Rather slim odds, wouldn't you say?
So, what I did next was to calculate the standard deviation for all returns on one-year, five-year and fifteen-year long investments in the S&P 500 for each month since January 1871. For example, I found that the standard deviation for all one-year returns on the S&P 500 comes to 19.16%. What that means is that 68% of the time throughout market history, investors with a one-year holding period (and who reinvest dividends) can expect to earn returns between 29.93% and negative 8.38% per year. 95% of the time, the returns are somewhere between 49% and negative 27.53%.
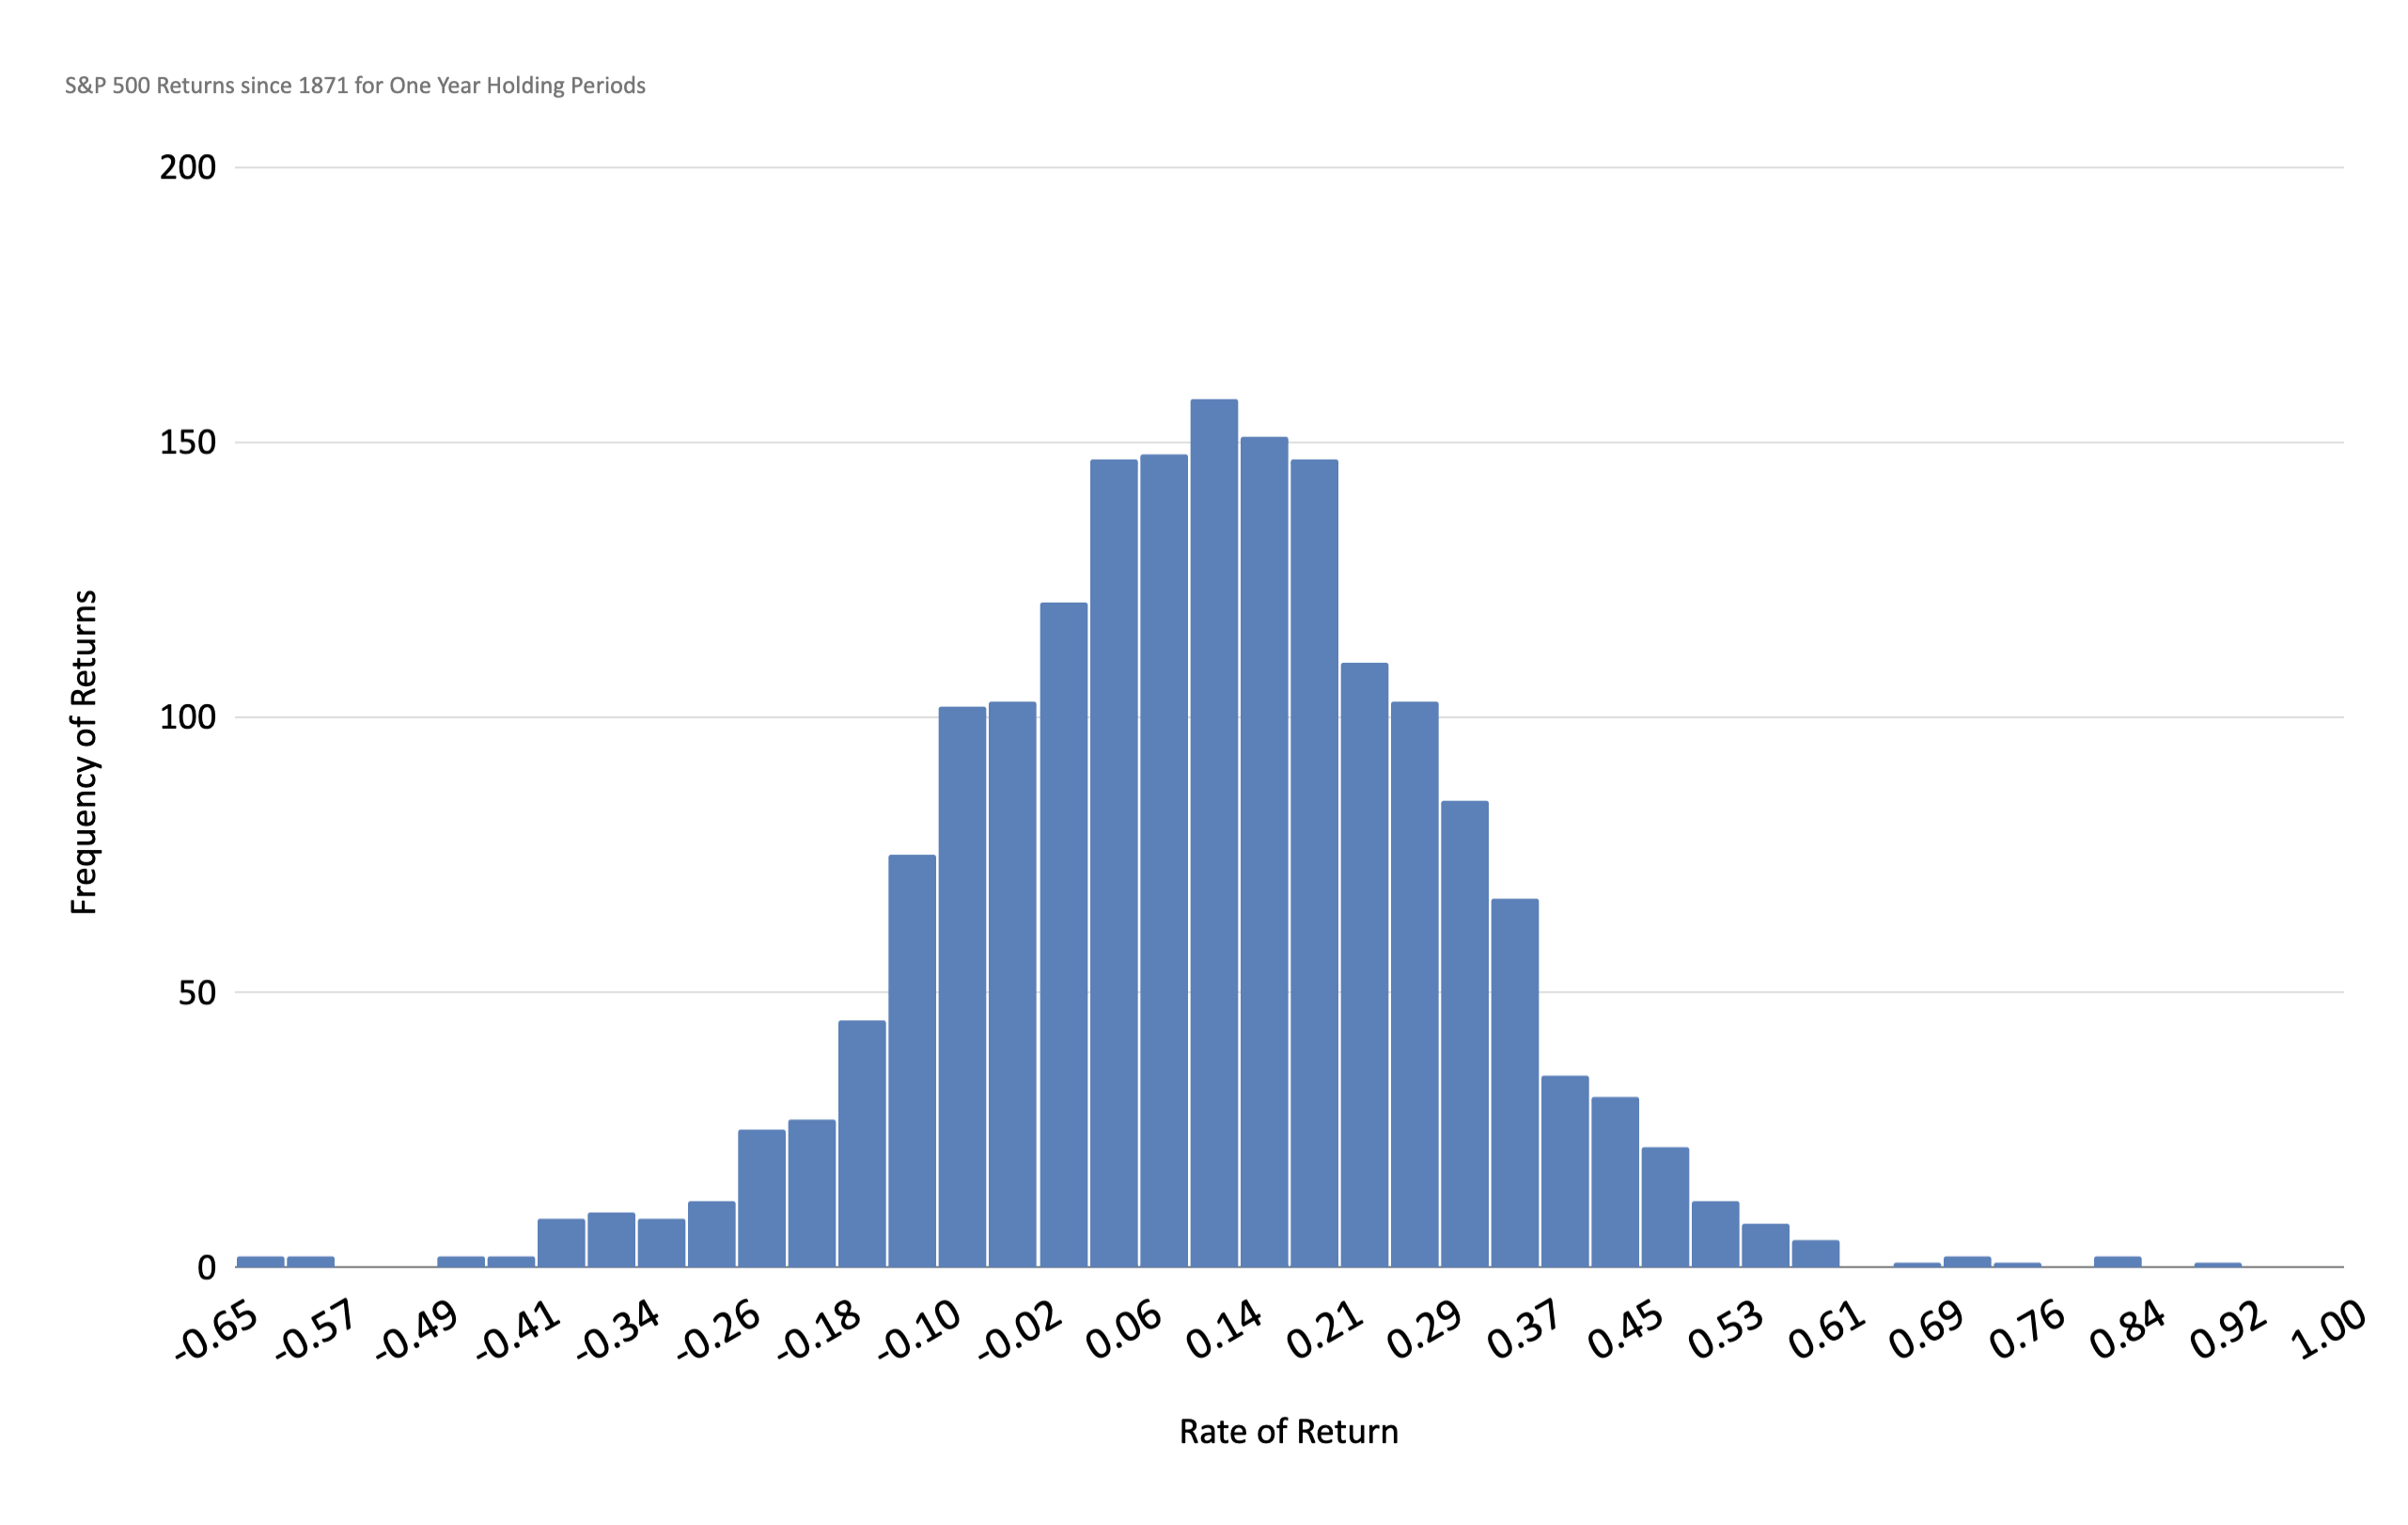
It’s a wide range. Just look at this chart that shows the actual one-year investment returns on the S&P 500 since 1871:
(Source: Author-generated chart based on market data by Robert Shiller)
Not surprisingly, we can see that annual returns on the stock market have fluctuated widely since 1871. S&P 500 investors tend to earn positive returns more often than negative returns after one year, but the range of outcomes is huge.
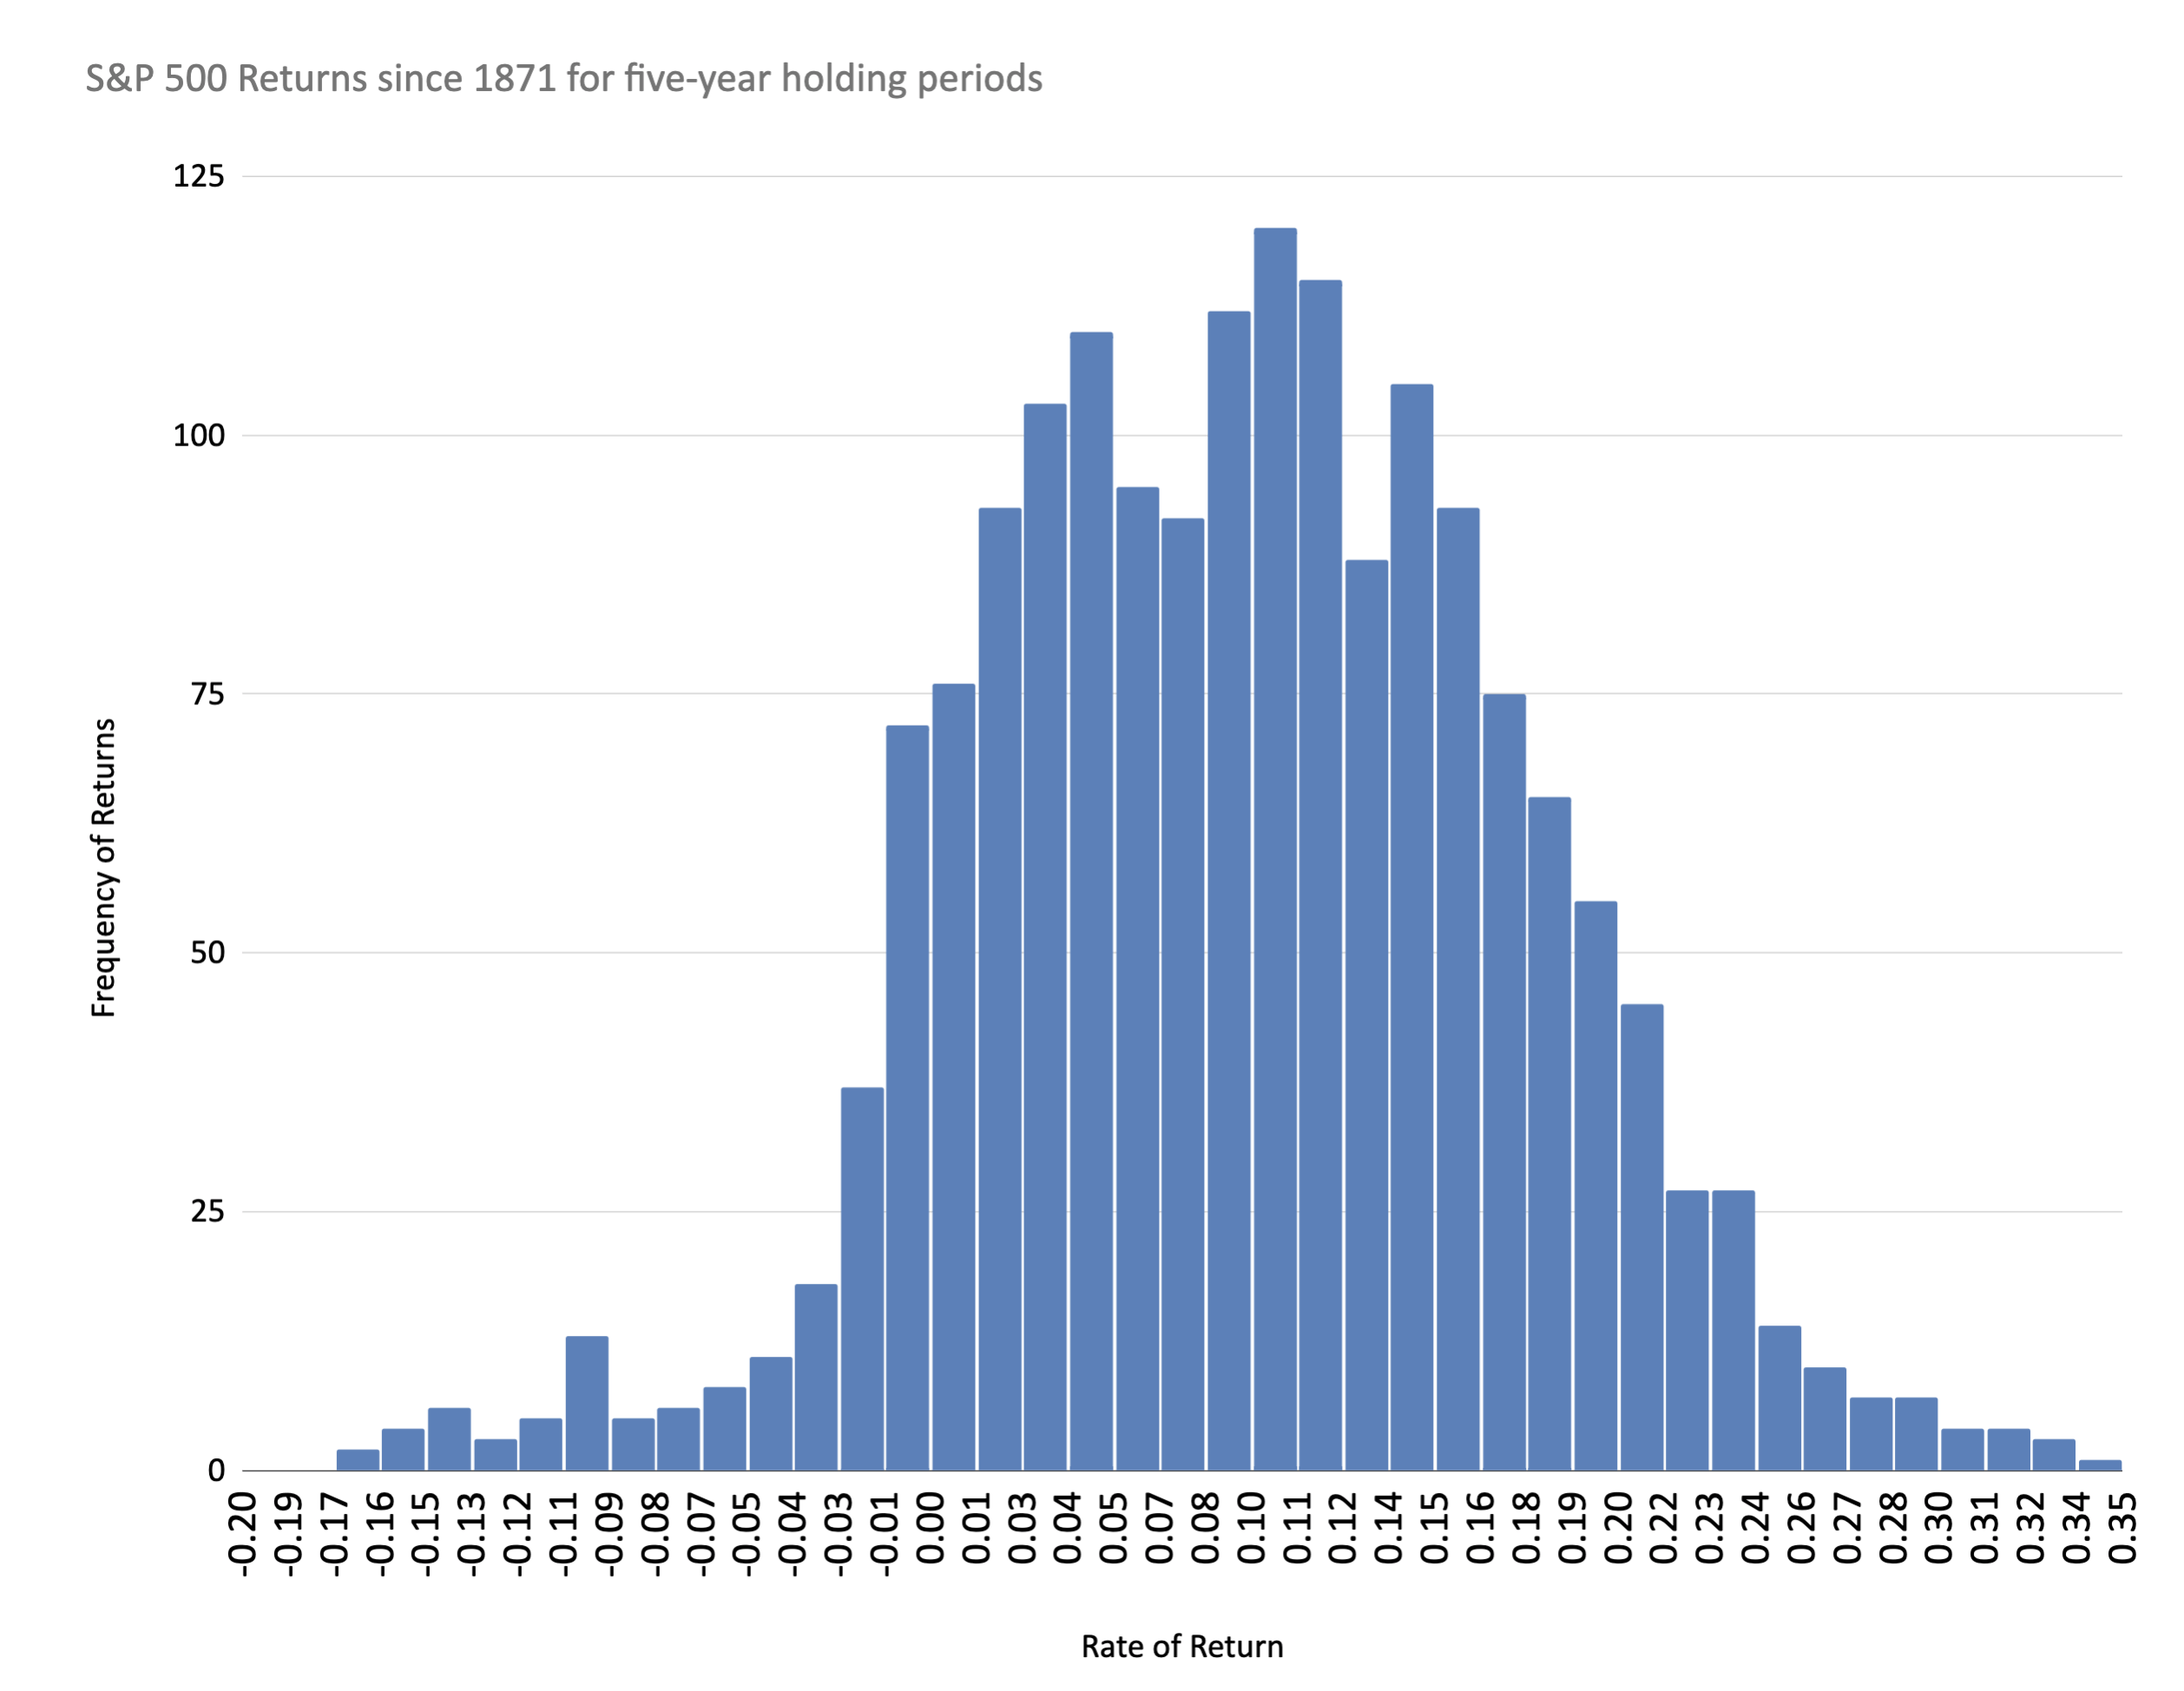
Also not surprisingly, the longer the investment horizon, the narrower the range of observed investment returns. Since 1871, 95% of the time investors who bought and held the S&P 500 for 5 years (reinvesting dividends religiously each month) earned annual returns between 25.42% and negative 6.55%. A picture says a thousand words:
(Source: Author-generated chart using data by Robert Shiller)
You can see that the majority of the time, investors with 5-year holding periods tend to earn positive returns. The highest rate of return might be lower, but the odds of losing money drop meaningfully if the investor bought and held the shares for five years and reinvested dividends with zealous fervor.
How Long A Holding Period For Consistently Positive Returns?
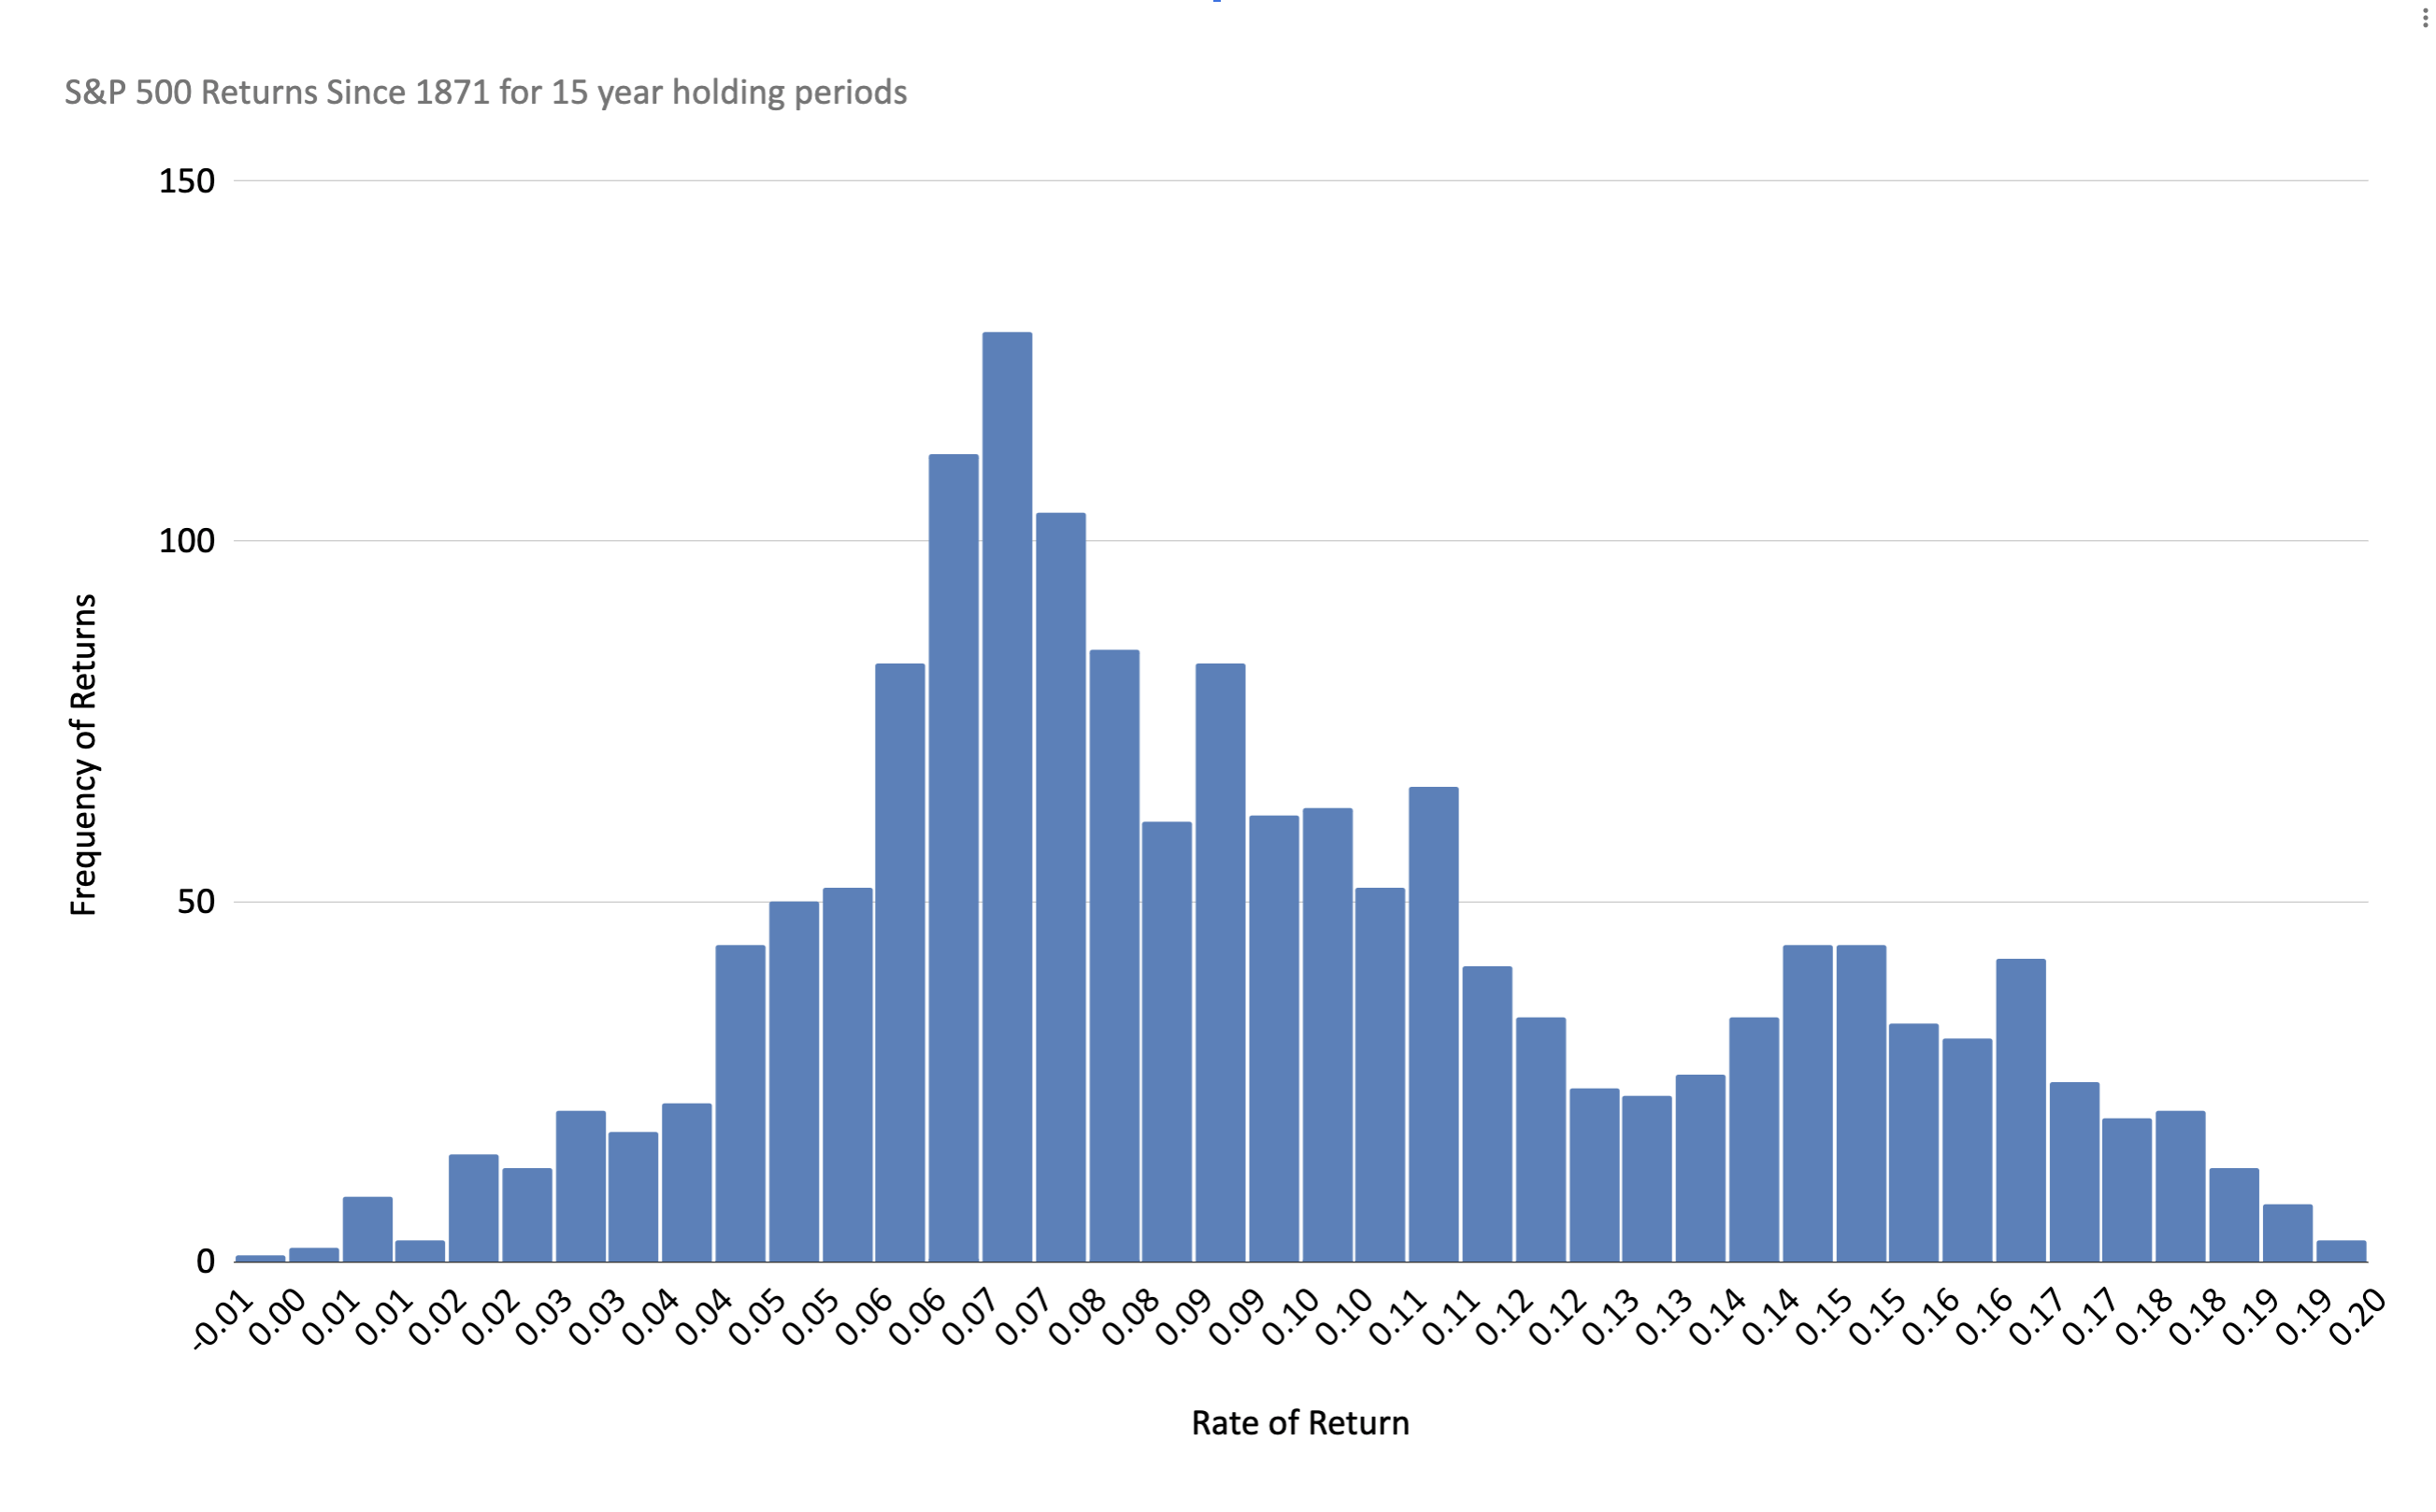
Since 1871, investors with a 15-year investment horizon earned a much tighter range of annual returns that fall somewhere between 17.34% and 1.07%. This leads to an interesting question: how many times in history have investors bought the S&P 500, held for fifteen years, reinvested all dividends each month and *lost* money?
Astonishingly (at least in my view), the answer is this: only once in history! Investors who bought the S&P 500 in September 1929, held for 15 years and reinvested all dividends would have earned a return of negative .34% per year for their trouble. Every single other time, for every single month since January 1871 to January 2005, investors who bought the S&P 500, held for 15 years and reinvested dividends each month invariably would have earned money on their investments.
(Source: Author-generated chart based on market data by Robert Shiller)
A certain well-known investor once said that the number one rule in investing is "don't lose money" (and he then went on to say that the number two rule is to never forget rule number one). In historical terms, those two rules translate into specific, actionable investment advice: "Buy the S&P 500, hold for 15 years and reinvest all dividends each month."
And what about that unlucky investor who bought the S&P 500 in September 1929? She would have earned a positive return if she held her investment for just one more year (a total investment horizon of 16 years) and kept reinvesting dividends each month.
Reward Is A Function Of Risk... Or Is It?
So, in a nutshell, 149 years' worth of data show that 95% of the time, investors stand to earn a higher return (up to 49%) over a one-year investment holding period in exchange for assuming higher risk (they face the threat of losses of up to 27.53%) and investors with a fifteen-year investment holding period stand to earn a lower return (up to 17.34% per year) in exchange for assuming lower risk (a worst-case 1.07% annual gain). History seems to show us that reward potential depends on the investor's willingness to take risk.
This result should not be surprising.
But what if we ask the question in a slightly different way. Let's ask "for every month since January 1871 and until January 2005, how much actual money would short-term investors earn as a group if they bought shares of the S&P 500, reinvested all dividends each month and then sold their entire position after one year to another short-term investor?" This is precisely like asking "do I make more money this year by earning an annual return of 49%, or by earning a 17% return over 15 years and averaging out the results?" Only, I am not asking a math question. I'm asking an empirical question.
I calculated the investment returns for one-year holding periods for each month starting in January 1871, and then I totaled all those gains and losses together to reveal how much money short-term investors as a group earned over a 134-year period. The answer is $711,332,992.23. (Note that the answer does not take inflation into account, since inflation isn't a major concern over a one-year investment horizon.)
Next, I asked a slightly different question for long-term investors. For every month since January 1871 until January 2005, I wanted to see how much money long-term investors earned on a per year basis if they bought the exact same number of shares of the S&P 500 as the short-term investor, reinvested all dividends each month and then sold their entire position after fifteen years to another long-term investor. Since inflation would be more of an issue for long-term investors, I calculated the result as an annual payment using the starting present value of the investment, the future value of the investment in 15 years, discounted by a 2% rate of inflation. How much did the long-term investors as a group earn from January 1871 to January 2005? The answer is $897,709,921.30 - roughly 26% more than short-term investors. Take inflation out of the picture and the total return that long-term investors earned as a group blooms to $1,211,671,781.02, which is over 70% higher than what the short-term investor group earned.
What this result means is that long-term investors as a group have earned higher returns, while taking substantially lower risk than short-term investors. Not only that, but at an individual level, for any given month since January 1871 until January 2005, there are 496 instances where a short-term investor would have made more money per year than the corresponding long-term investor would have made per year. But how many times would the long-term investor make more money per year than the short-term investor? The answer is that the long-term investor beat the corresponding short-term investor 1487 times. In other words, each long-term investor is almost three times as likely to win out over the short-term investor who bought the S&P 500 in the same month. That's a far higher chance of earning far higher returns with far lower risk of loss.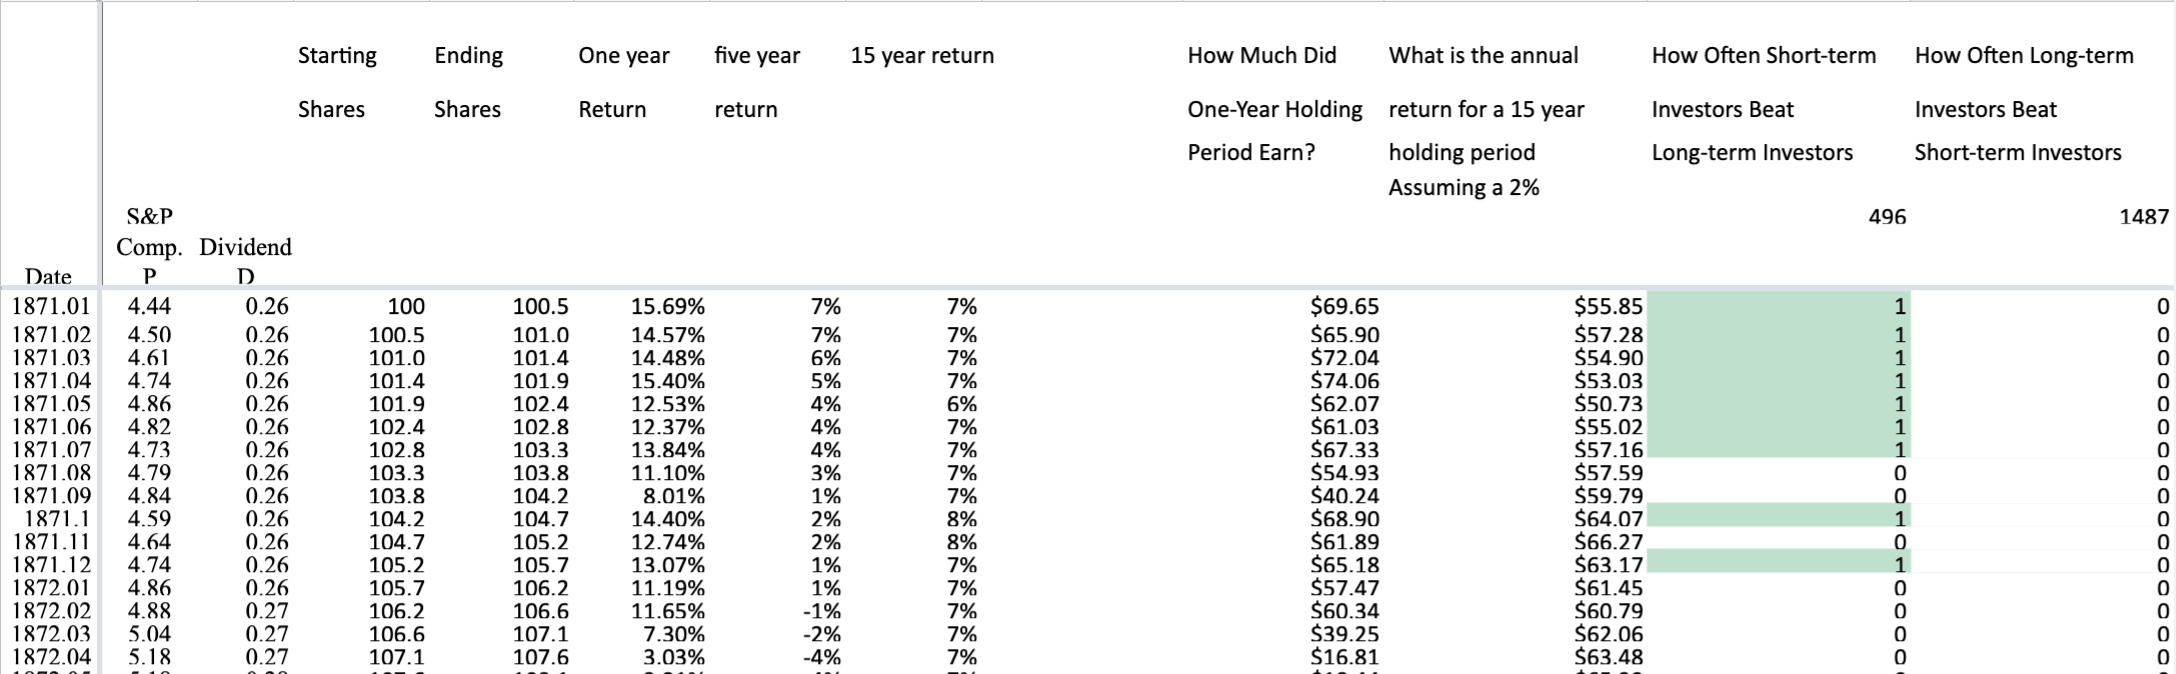
(Source: Author's calculations based on market data by Robert Shiller)
I Have A Theory About What's Going On...
I think the explanation for these results boils down to volatility. Volatility has been the bitter enemy of the short-term investor for the past 149 years. To make money, the short-term investor must buy low and sell high, and if the market doesn't cooperate, the short-term investor loses.
On the other hand, volatility has been the staunch ally of the long-term investor over the past 149 years. Whenever stock prices crashed, lower stock prices enabled investors to buy more shares whenever they reinvested dividends. Those bargain stock prices resulted in a higher share count and higher subsequent portfolio income, which led to higher subsequent reinvestments and so on and so forth. The benefits of buying stocks when prices are falling reverberated at an exponential rate throughout the entire investment horizon, so the longer the holding period, the better off the investor would be.
In a nutshell, the short-term investor and long-term investor have completely different risk/ reward outcomes because they're making completely distinct bets. The short-term investor bets on the fickle mistress known as "stock prices," whereas the long-term investor bet on the steadfast, inevitable power of compounding. One of those bets offers a high risk/reward ratio, the other does not. And history shows us with zero ambiguity which bet is which.
Disclosure: I am/we are long VIAFX. I wrote this article myself, and it expresses my own opinions. I am not receiving compensation for it (other than from Seeking Alpha). I have no business relationship with any company whose stock is mentioned in this article.
Additional disclosure: Nobody can rely on anything contained in this article for any reason other than entertainment value. I am not an investment advisor and this is not investment advice. I cannot guarantee the accuracy of any of the data used in this article or the calculations and conclusions drawn from such calculations.
