This Is Why I'm Still Short UVXY
The VIX is likely going to correct to the upside over the coming weeks as the market contracts and seasonal tendencies come into play.
UVXY is following a methodology which is only loosely correlated to changes in the VIX over lengthy periods of time.
Since UVXY is heavily exposed to roll yield on a leveraged basis, long-dated puts can make for a winning strategy in the ETF.
As you can see in the following chart, the ProShares Ultra VIX Short-Term Futures ETF (UVXY) has continued to dip following the strong run-up in volatility earlier this year.
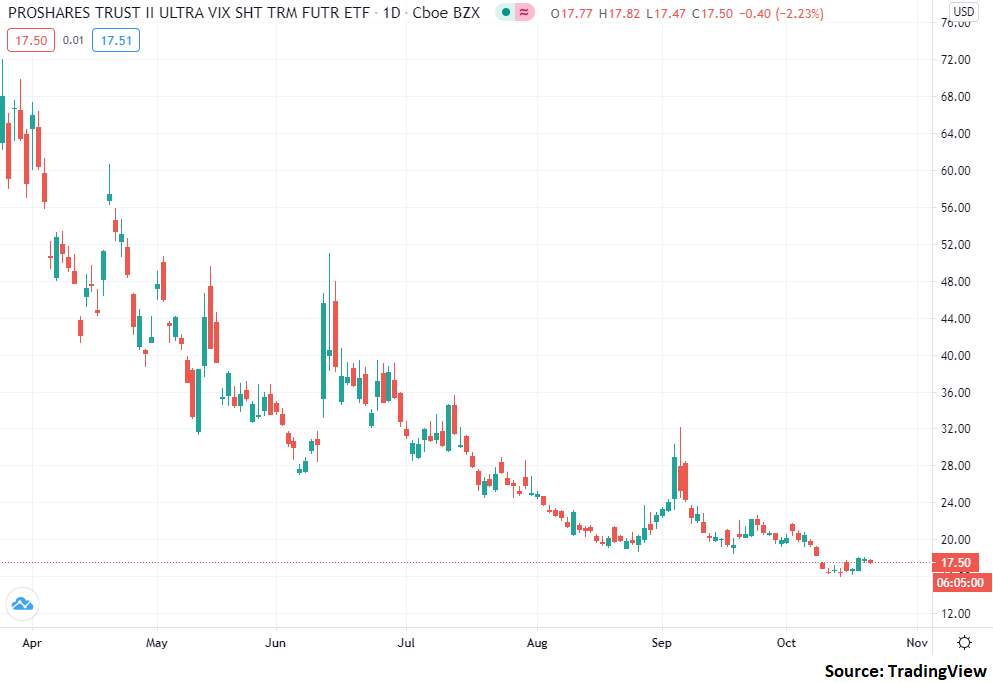
With shares down around 75% from the highs established earlier this year, investors may be questioning when the bottom will be reached. At present, I believe that while we are nearing a short-term bottom, in the long term, UVXY is likely headed much lower.
Volatility Markets
At present, the volatility markets are currently at a very interesting junction in that the VIX has managed to hold its ground above 20 over the past few months.
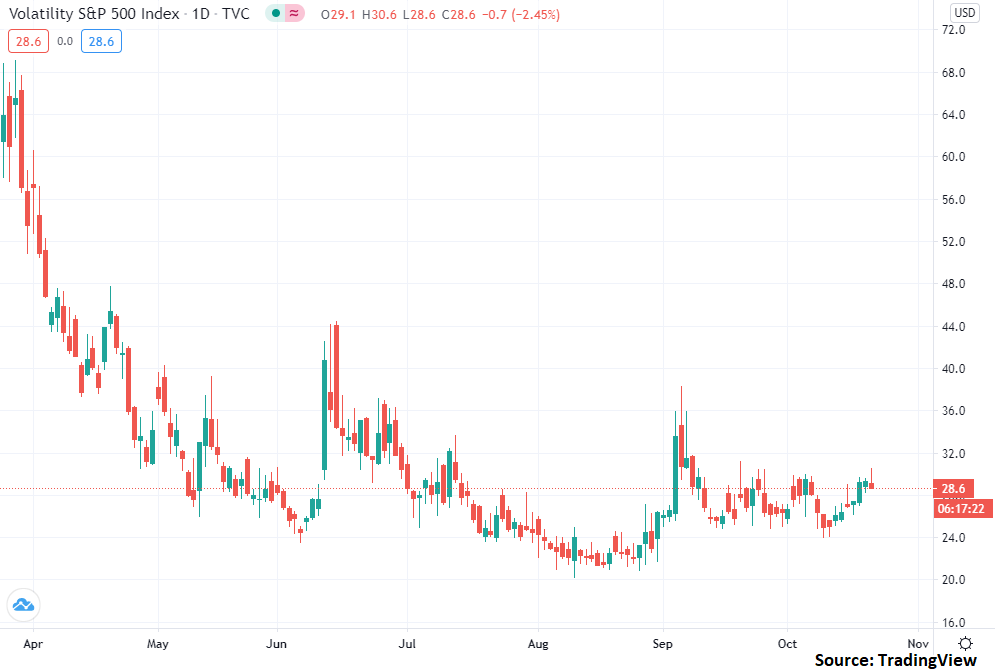
The reason why this is particularly noteworthy is that historically speaking, this level of the VIX is fairly elevated with most of the typical history of the index occurring beneath this point.
This said, while the VIX has remained unusually strong (despite the market recovery), we are still able to look to historic data for guidance for where the VIX may travel in the future.
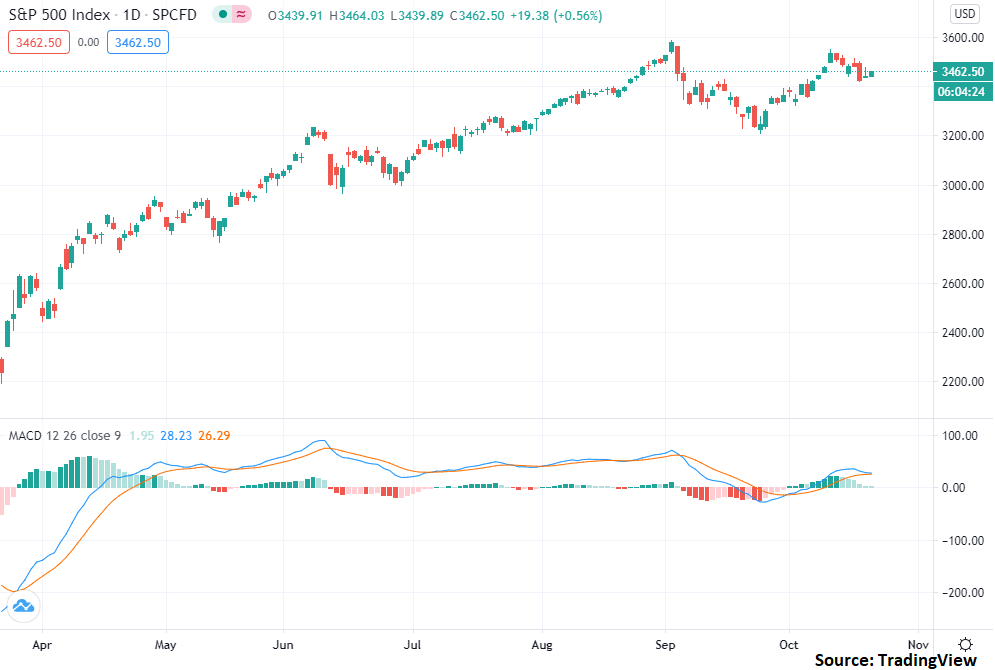
From a technical standpoint, I am moderately bearish the S&P 500. As can be seen in the chart above, the market rally has stalled as of last week and momentum is poised to turn bearish. Historically speaking, when momentum turns bearish (as measured by the MACD indicator), we generally do see a degree of correction and pause in the trend. Given that momentum is likely going to turn bearish soon, it seems that a continued pause and moderate contraction in the S&P 500 is likely in the cards for the next few trading days.
The tie-in for UVXY traders is that if the market pauses and contracts somewhat, the VIX is likely going to rally, as seen in the following chart.
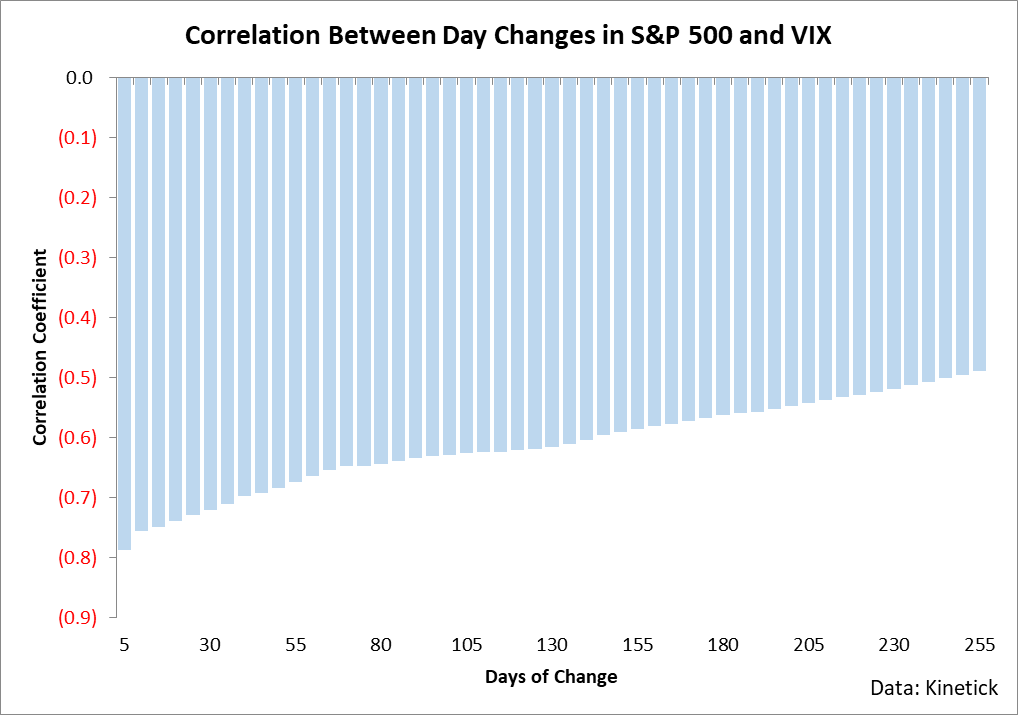
What is important to note about this chart is the clear relationship between changes in the market and changes in the VIX. If the market falls, then the VIX will likely rise. However, this relationship diminishes through time. In other words, the VIX is most influenced by market changes over shorter time periods. What this data essentially means is that if we do see the market pullback over the next few days (which I view as an above-average probability), then we'll see the VIX rally to a degree.
From the technical chart above, I believe it's entirely possible for the S&P 500 to fall back to around 3,300 in the next bearish downswing. This would represent a loss of around 3% to equity investors and historically is correlated to gains in the VIX of around 12% or so.

While I believe the technical picture is supportive of higher levels in the VIX, I also believe that we are in the midst of a seasonal adjustment to the index which will likely last throughout the fourth quarter.
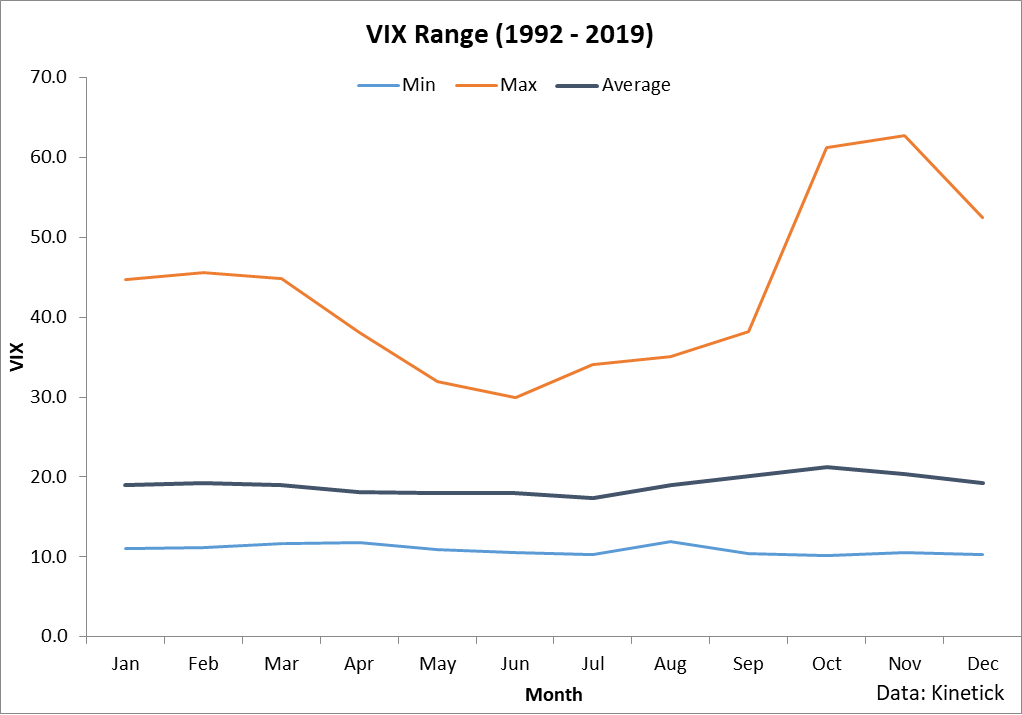
What this chart shows is the average and range of the VIX by month over the past 27 years. This data shows a very clear trend in that on average the VIX tends to increase in the fourth quarter with October and November historically seeing the largest average movements to the upside.
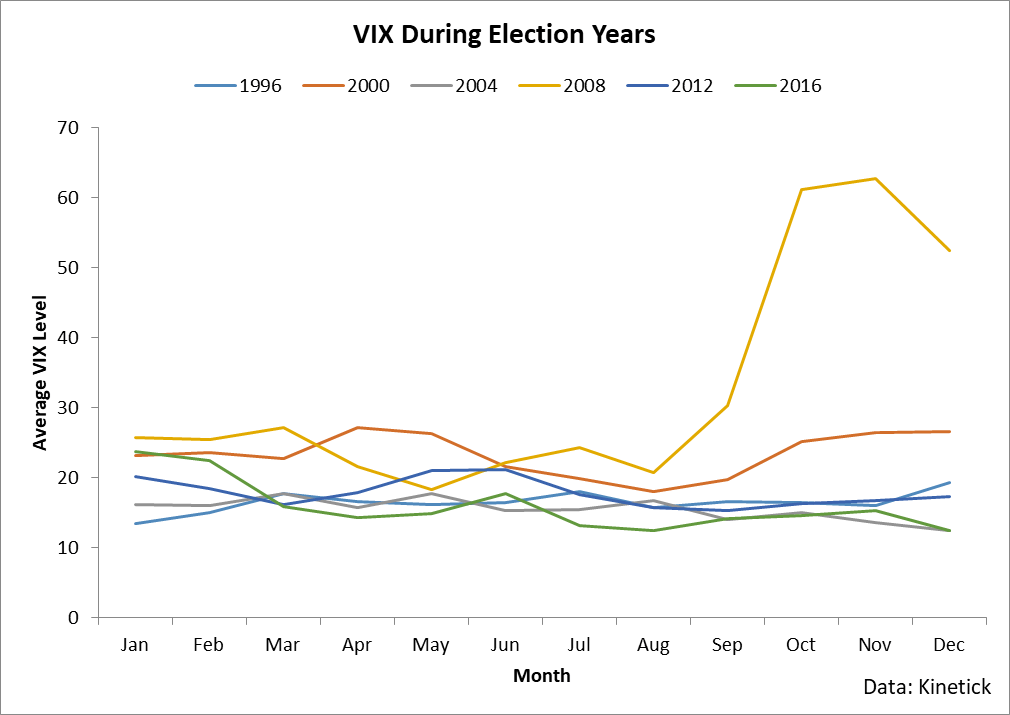
When it comes to trading seasonality, it's important to understand that seasonal tendencies are just that: tendencies. This doesn't mean that the VIX will certainly rally; however, it implies that investors should be aware that nearly 30 years of data shows that we're in the midst of a time of the year in which the VIX has historically made very sizable moves to the upside and investors should therefore be on guard. Additionally, election years tend to see heightened volatility as well, with most years seeing the VIX increase between the summer and end-of-year figures.
Put simply, I believe that investors should remain moderately bullish the VIX for the next few months. I believe that in the short-run, we have a technical picture that is supportive of higher VIX levels and in the medium term, the VIX is likely going to stay elevated due to seasonal factors.
About UVXY
Despite my bullish view on the VIX, I am actually short UVXY. The reason for this is quite simple: there's a strong difference in performance between UVXY's underlying methodology and the VIX itself.
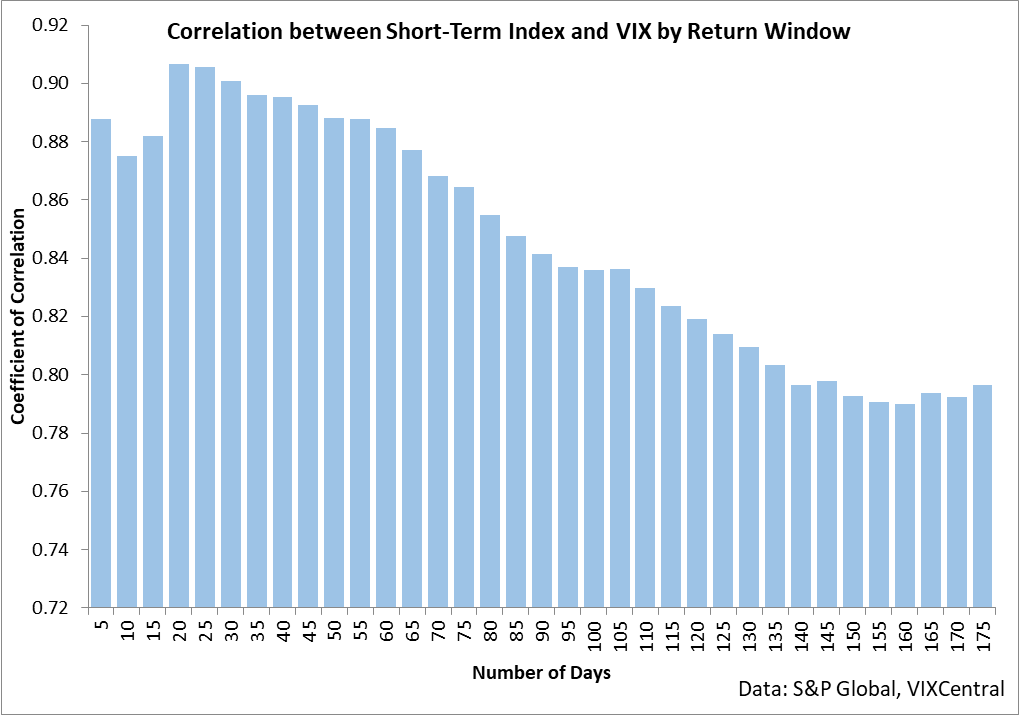
This chart shows the correlation between changes in the VIX and changes in UVXY's unlevered index. As you can see, the longer you hold UVXY, the less of a degree that your returns are going to reflect changes in the VIX. Furthermore, this decoupling of performance is largely driven by lagging performance to the downside.
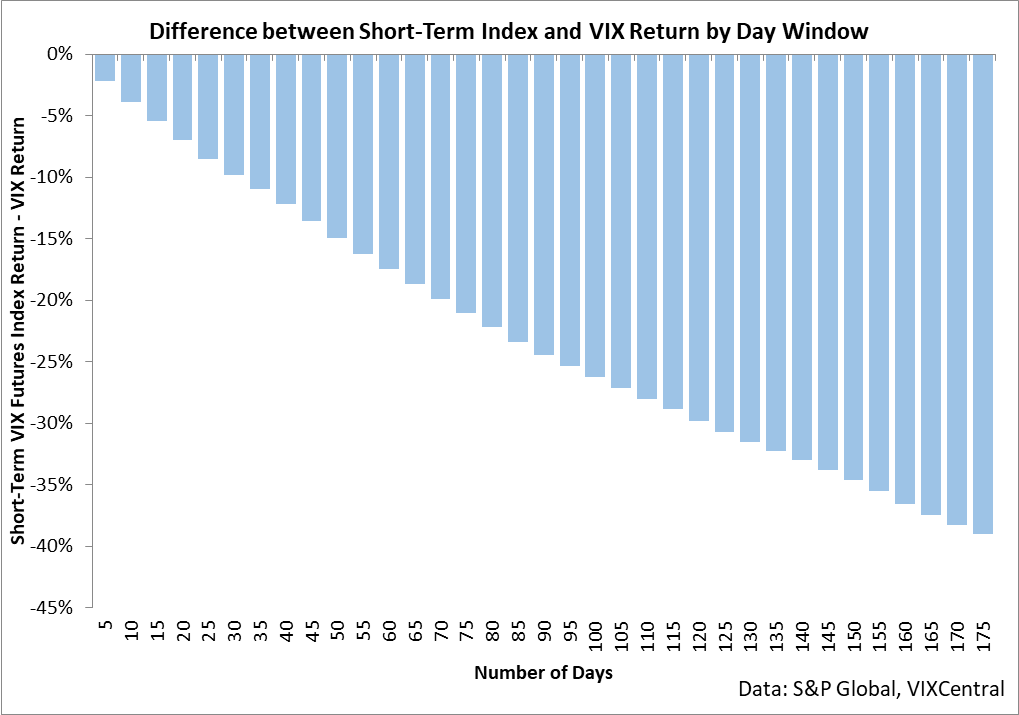
What this chart shows is the difference in performance between UVXY's methodology and the VIX itself grouped by the holding period. There's a very clear and unmistakable trend: the longer you hold UVXY, the greater that you will underperform the changes in the VIX. The nuance here to note is that UVXY is giving a 1.5 times leveraged return of this index, so the losses are amplified.
So, what's going on here? How can something which is purportedly following the VIX actually end up dramatically lagging it as time goes on? The answer is roll yield.
Roll yield is what you get when you're holding a futures contract and that futures contract converges to the spot price of the instrument you're trading. Here's a chart that shows this point.
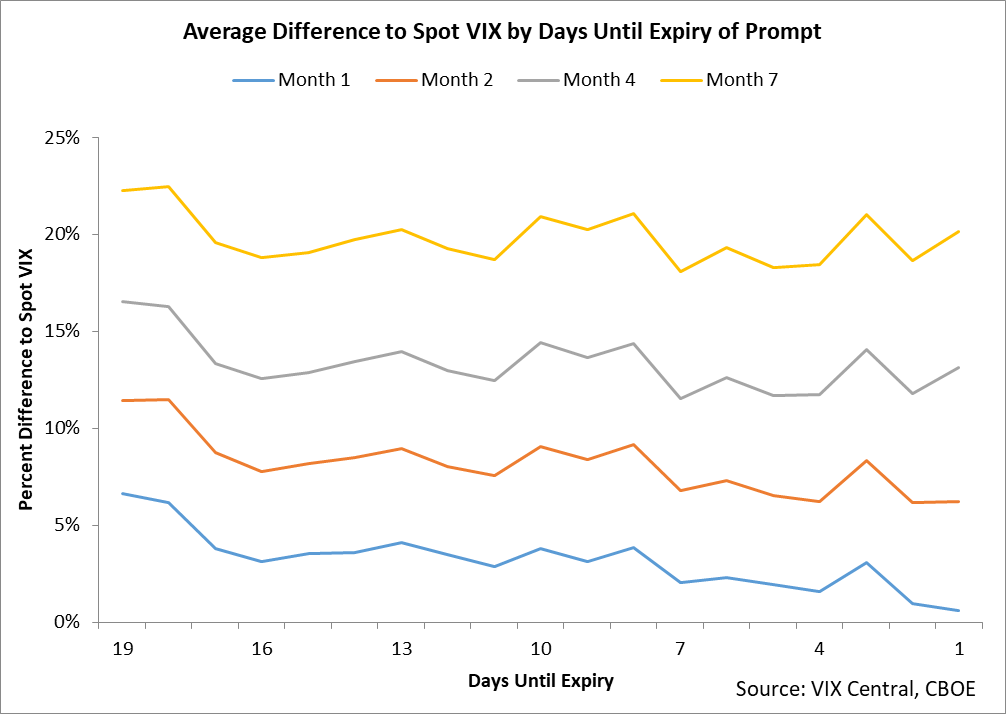
The chart above is a little complicated, but it pays dividends to take some time to understand it. This chart shows the average difference between the spot level of the VIX and a handful of futures contracts which settle against the spot VIX. The data is grouped by the number of days until the expiry of the front month VIX futures contract and it shows a very clear trend:
- On average, VIX futures contracts are priced above the spot level of the VIX with the longer duration futures contracts seeing greater differences to the spot price
- On average, VIX futures contracts move down towards the spot level of the VIX in a typical month with the months at the front of the curve seeing the greatest convergence
If you grasped this concept, then you fully understand roll yield. Many outlets have given erroneous explanations of this concept, but it really is this simple: futures converge to spot prices through time which means that if you're holding futures contract, your return is going to be subject to both the changes in the price of the commodity and the convergence priced into your contracts during the time period of your holdings.
The implications here for UVXY are actually pretty bad. If you look at the history of its index, on an unleveraged basis, this index has fallen at a pace of nearly 50% per year for the last decade. Compound math can be difficult to implicitly grasp, but this essentially means that if you were to hold this index on an unleveraged basis for longer than 18 months or so, you would need one of the largest VIX rallies in history to even be breakeven. If you've held a volatility product giving long exposure to this index for longer than 2 years or so, you likely will never see a return on your investment.
UVXY dramatizes the point by giving a 1.5x multiple upon this figure. Rough back of the envelope math shows that this would equate to average annualized losses in the territory of 70-80% per year for the past decade.
This is why I am short UVXY. It is following a methodology that is holding and rolling exposure in the first two months of the VIX futures curve. Our previous chart shows that these contracts start a month priced 5-10% above the spot VIX (on average) and end the month lower (with the front contract reaching parity at expiry). The math works out to long-term losses for UVXY which give a clear shorting opportunity at this time.
To capture this tendency, my preferred strategy is to buy deep out of the money puts around 2 years out until expiry. The math suggests that the longer you are able to maintain a short position in UVXY, the greater the odds that you will be in the money at expiry. I would not recommend that investors outright short UVXY due to the potential for sizable upside movements, however, I believe that long-dated puts make for a good trade at this time.
Conclusion
The VIX is likely going to correct to the upside over the coming weeks as the market contracts and seasonal tendencies come into play. UVXY is following a methodology which is only loosely correlated to changes in the VIX over lengthy periods of time. Since UVXY is heavily exposed to roll yield on a leveraged basis, long-dated puts can make for a winning strategy in the ETF.
Disclosure: I am/we are short UVXY. I wrote this article myself, and it expresses my own opinions. I am not receiving compensation for it (other than from Seeking Alpha). I have no business relationship with any company whose stock is mentioned in this article.
