Southwest Gas Holdings: Review Of Potential Returns

Despite a high dividend yield, total returns for investors have been poor.
Poor returns have been contributed to by increasingly negative sentiment, reflecting as a declining P/E multiple, causing share price falls.
Analysts' current EPS estimates indicate an expectation for future EPS growth that could result in share price growth, leading to solid returns, particularly if accompanied by P/E ratio improvement.
Investment Review: Southwest Gas Holdings
Southwest Gas Holdings, Inc. (NYSE:SWX) has an unbroken stream of dividend payments since 1989 and has grown dividends for the past 14 years. With a longer-term dividend payout ratio ~58%, and a current dividend yield of 3.4%, the company appears to be a good investment prospect. Nevertheless, during the last four years, shareholders have generally suffered negative total returns due to share price decreases more than offsetting dividend receipts. While earnings have been growing, there has been considerable P/E multiple contraction impacting adversely on the share price. SA analysts' EPS estimates indicate Southwest Gas is expected to grow EPS during the next few years, albeit at a lower growth rate than the last 3 years. If this EPS growth eventuates, it will likely lead to increases in share price, unless P/E multiples continue to decline. If the declines in P/E multiple expansion reverse, a combination of P/E multiple expansion and EPS growth should result in solid increases in share price. However, if analysts' expectations for EPS growth are not met, this could contribute to further decline in P/E ratios and continuing poor returns for share investors.
Looking for share market mispricing of stocks
What I'm primarily looking for here are instances of share market mispricing of stocks due to distortions to many of the usual statistics used for screening stocks for buy/hold/sell decisions. The usual metrics do not work when the "E" in P/E is distorted by the impact of COVID-19. And, if the P/E ratio is suspect, so too then is the PEG ratio similarly affected. The COVID-19 pandemic is affecting the operations of businesses, and consequently their revenues and earnings, and also sentiment toward individual businesses. The COVID-19 impact has been good for some businesses and bad for others. But, as King Solomon once observed, in respect of both good times and bad, "this too shall pass."
How does a share investor make a decision on these statistics, distorted as they are by the impact of COVID-19?
In thinking how to get from this time of disruption to better times, I'm reminded of an old Irish joke about a tourist on a back road in Ireland asking a farmer how to get to Dublin, to which the farmer replied, "If I was going to Dublin, I wouldn't start from here." I feel a bit like that with P/E ratios at present, due to the disruption to earnings caused by the COVID-19 pandemic. I believe the answer is to start with data at the end of 2019, early 2020, pre COVID-19 and compare to projections out to end of 2022, when hopefully the impacts of COVID-19 will have largely dissipated. Summarized in Tables 1, 2 and 3 below are the results of compiling and analyzing the data on this basis.
Table 1 Detailed Financial History And Projections
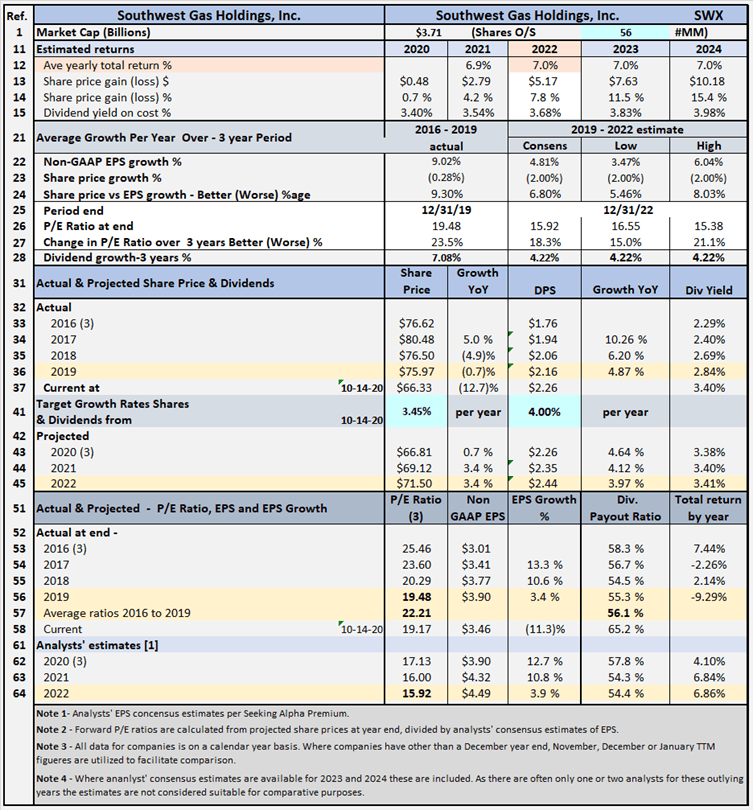
Table 1 documents historical data from 2016 to 2019, including share prices, P/E ratios, EPS and DPS, and EPS and DPS growth rates. The table also includes estimates out to 2022 for share prices, P/E ratios, EPS and DPS and EPS and DPS growth rates (note estimates are shown for analysts EPS estimates out to 2024 where available but these are considered not as reliable). Table 1 allows modeling for target total rates of return. In the case shown above, the target set for total rate of return is 7% per year, based on buying at Oct. 14 closing share price level. The table shows, to achieve the 7% return, the required average yearly share price growth rate from Oct. 14, 2020, through Dec. 31, 2022, is 3.45%. This growth rate is lower than the target 7% return due to estimated dividends receivable. Southwest Gas has a current dividend yield of 3.40%. Table 2 below summarizes relevant data flowing from the assumption of a target 7% total return.
Targeting a 7% Return
Table 2 - Targeting a 7% return
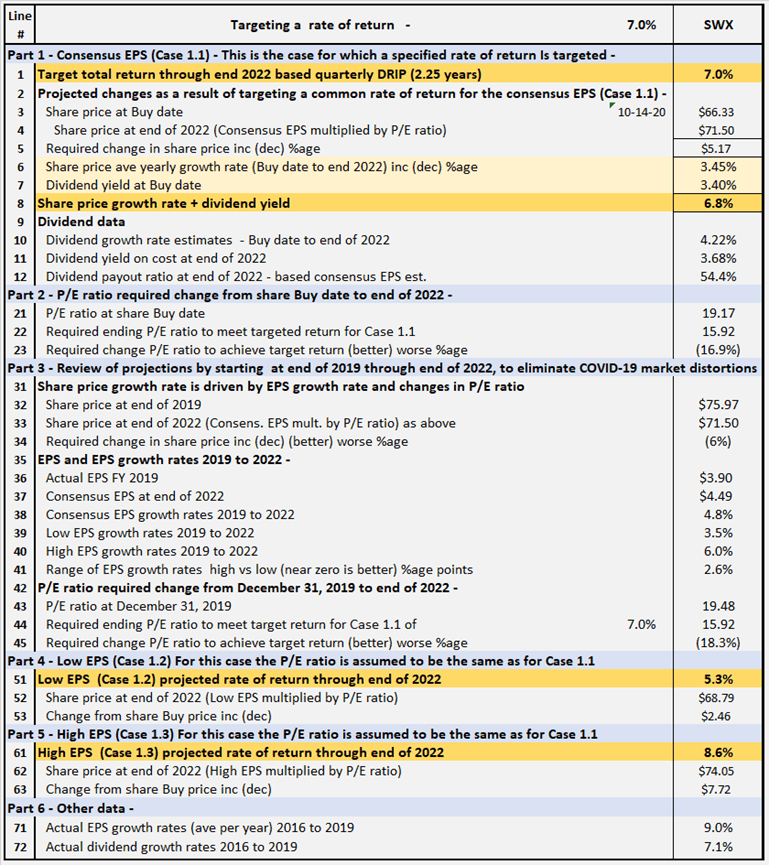
Table 2 provides comparative data for Southwest Gas, assuming share price grows at rates sufficient to provide total rate of return of 7%, for buying at closing share price on Oct. 14, 2020, and holding through end of 2022. All EPS estimates are based on analysts' consensus and low estimates per SA Premium.
Comments on Table 2 are as follows:
Part 1 - Consensus EPS (Case 1.1) (lines 1 to 12)
Part 1 shows the amounts the share price would need to increase to achieve a 7% rate of return through end of 2022. From Part 1, it can be seen that adding projected EPS growth rate to a dividend yield can give an approximation of potential total return, subject to changes in P/E ratio and growth in the dividend yield on cost.
Part 2 - Required change in P/E ratio to achieve Target 7% return (lines 21 to 23)
Part 2 shows the amount the P/E ratio would need to increase or decrease by, from buy date to end of 2022, to achieve the share price level at end of 2022 necessary to achieve the targeted 7% return. For Southwest Gas, the P/E ratio at buy date can decrease through end of 2022, and the 7% return will still be achieved. Being able to achieve a targeted return despite a reduction in the P/E ratio would normally be regarded as a positive. However, due to the distortions of earnings and sentiment, due to the COVID-19 pandemic, it's difficult to judge whether the change in P/E ratio is a positive or the result of a distorted starting point. To overcome this difficulty, in Part 3, I review the necessary change in P/E ratio from a different, pre COVID-19 starting point.
Part 3 - Projected change in P/E ratios from 2019 to 2022 (lines 31 to 45)
In part 3, I start with the share price at Dec. 31, 2019, before the impact of the COVID-19 pandemic on earnings and market sentiment. The end point is projected share prices at end of 2022, when it is assumed the market and earnings are no longer materially impacted by the COVID-19 pandemic. For Southwest Gas, the share price can decrease by $4.47 from $75.97 at Dec. 31, 2019, to $71.50 at end of 2022, and, as detailed in Part 1, at $71.50, the targeted 7% rate of return would be achieved. For Southwest Gas, there are a number of givens in our assumptions. We know the EPS for FY 2019 was $3.90, and SA analysts' consensus EPS estimate for 2022 is $4.49, which gives an average yearly growth rate of 4.8%. We know the share price at end of 2019 $75.97 and EPS $3.90, which gives a P/E ratio of 19.48. We know the share price at end of 2022, to achieve a 7% return is $71.50, and consensus EPS estimate $4.49, which gives a required P/E ratio of 15.92 at end of 2022. The indicated P/E ratio of 15.92 at end of 2022 is 18.3% lower than the P/E ratio of 19.48 at end of 2019. All of these figures can be seen in Part 3 of Table 2 above. The change in the share price for Southwest Gas can be expressed as mathematical formulae as follows:
(A) Change in share price due effect of EPS growth rate equals share price at beginning multiplied by (1 plus average yearly EPS growth rate) to the power of number of years invested
= $75.97*(1+4.8%)^3 = $87.46
(B) Change in share price due change in P/E ratio equals share price adjusted for EPS growth rate multiplied by (1 plus/minus percentage change in P/E ratio)
= $87.46*(1-18.3%) = $71.50
Note especially, the $11.49 increase ($87.46 minus $75.97) due to the average yearly EPS growth rate is cumulative, and share price will continue to increase the longer the shares are held and the growth rate continues. The offsetting reduction of $15.96 due change in P/E ratio ($87.46 minus $71.50) has a one-off effect. A continuing high or low P/E ratio has no impact on future share price growth, only a change in P/E ratio affects share price, not the level of P/E ratio.
Part 4 - Low EPS (Case 1.2) (lines 51 to 53)
Part 4 shows the indicative returns if the P/E ratio were the same as for the consensus EPS Case 1.1, but EPS results were in line with analysts' low EPS estimates. For Southwest Gas, the result for the low EPS case is a return of 5.3% compared to the 7% for the consensus EPS case.
Part 5 - High EPS (Case 1.3) (lines 61 to 63)
Part 5 shows the indicative return if the P/E ratio were the same as for the consensus EPS Case 1.1, but EPS results were in line with analysts' high EPS estimates. For Southwest Gas, the result for the high EPS case is a return of 8.6%, compared to the 7% for the consensus EPS case.
Next, rather than targeting a specific rate of return, I look at historical P/E ratios to see the potential impact on returns of a reversion to these levels of P/E ratio. First of all, I should explain a little about the Dividend Growth Income+ Club approach to financial analysis of stocks.
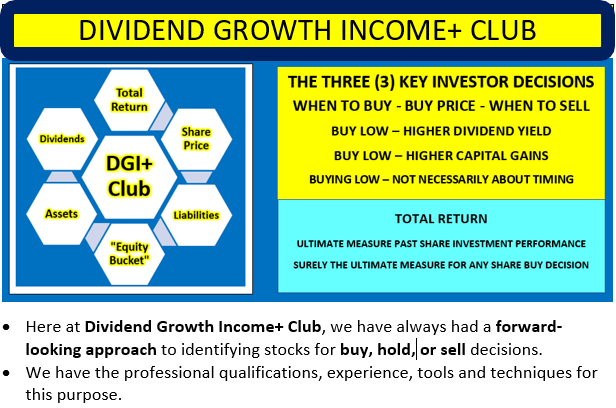
Understanding The Dividend Growth Income+ Club Approach
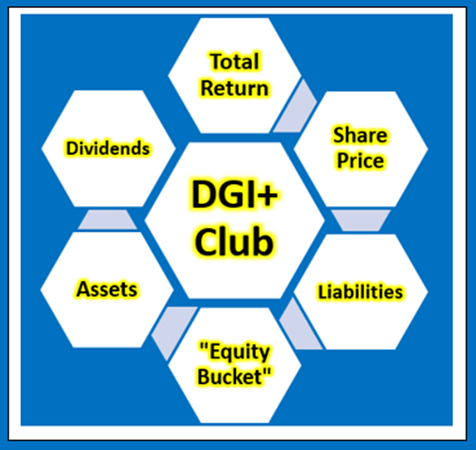
Total Return, Dividends, Share Price
Undertaking exercises to determine the current value of a stock is a waste of time when the market continually provides the only current value that matters when it comes to buy a stock. The only way an investor can achieve a positive return on an investment in shares is through receipt of dividends and/or an increase in the share price above the buy price - the only way. It follows what really matters in share value assessment is the expected price at which a buyer will be able to exit shares, and expected cash flow from dividends.
Changes in Share Prices
Changes in share price are driven by increases or decreases in EPS, and changes in P/E ratio. Changes in P/E ratio are driven by investor sentiment toward the stock. Investor sentiment can be influenced by many factors, not necessarily stock-specific. Such factors include perceived quality of a stock, Warren Buffett or another well-known investor acquiring or disposing of a position, an event such as Brexit or the COVID-19 pandemic, expected future earnings growth for the stock, and the state of the economy, now and in the future.
"Equity Bucket"
Earnings are tipped into the "Equity Bucket" for the benefit of shareholders. It is prudent to check whether distributions out of, and other reductions in the "Equity Bucket" balance are benefiting shareholders.
Southwest Gas's Returns Based On Selected Historical P/E Ratios Through End Of 2022
Table 3 below provides additional scenarios projecting potential returns based on selected historical P/E ratios and analysts' consensus and low EPS estimates per Seeking Alpha Premium through end of 2022.
Table 3 Summary of relevant projections Southwest Gas
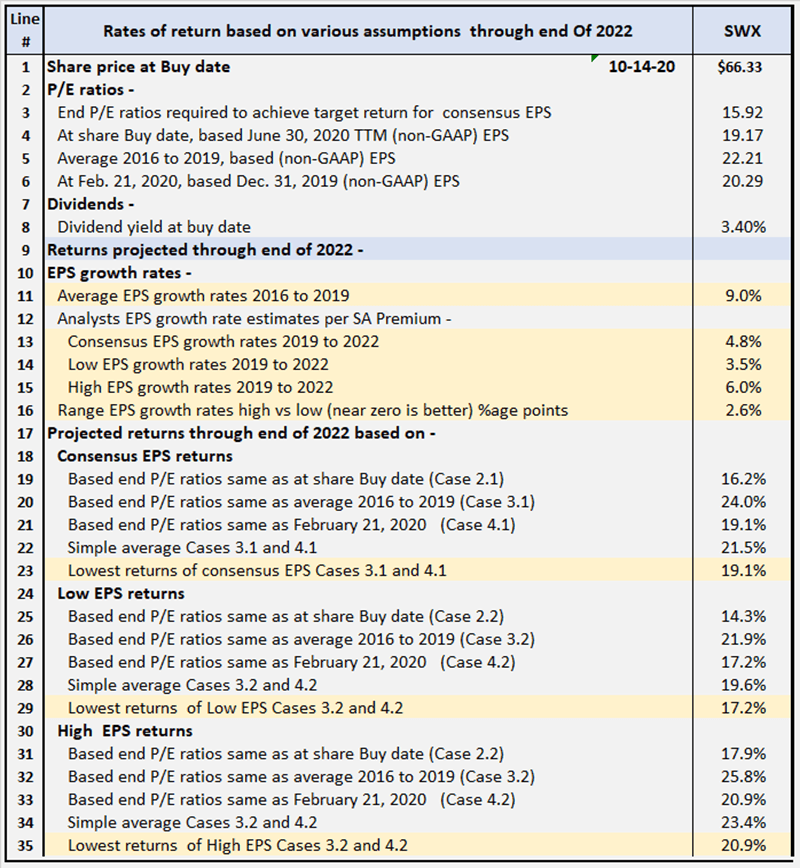
Table 3 provides comparative data for buying at closing share price on Oct.14, 2020, and holding through the end of 2022. There are a total of nine valuation scenarios, comprised of three EPS estimates (consensus, low and high) across three different P/E ratio estimates. Comments on contents of Table 3 follow.
Consensus, low and high EPS estimates
All EPS estimates are based on analysts' consensus, low and high estimates per SA Premium. This is designed to provide a range of valuation estimates ranging from low to most likely, to high based on analysts' assessments. I could generate my own estimates, but these would likely fall within the same range and would not add to the value of the exercise. This is particularly so in respect of well-established businesses such as utilities. I believe the "low" estimates should be considered important, in case analysts, overall, have not sufficiently taken account of potential ongoing impact of COVID-19 in their 2022 EPS estimates.
Alternative P/E ratios utilized in scenarios
- The actual P/E ratios at share buy date based on actual non-GAAP EPS for June 30, 2020 TTM.
- The actual P/E ratios at Dec. 31, 2019, based on FY 2019 non-GAAP EPS.
- The actual P/E ratios at Feb. 21, 2020, share prices based on FY 2019 non-GAAP EPS. The logic here is the market peaked around Feb. 21, 2020, before any significant impact from COVID-19 became apparent, and after FY 2019 results had been released. This makes the P/E ratios at Feb. 21, 2020, reflective of most recent data before distortion of P/E ratios by the impact of the coronavirus pandemic.
Reliability of EPS estimates (line 16)
Line 16 shows the range between high and low EPS estimates. The wider the range, the greater disagreement there is between the most optimistic and the most pessimistic analysts, which tends to suggest greater uncertainty in the estimates. The range of 2.6% for Southwest is relatively low.
Projected Returns (lines 17 to 35)
Lines 23, 29 and 35 show, at a range of historical P/E ratio levels, Southwest Gas is conservatively indicated to return between 17.2% and 20.9% per year through end of 2022. The 17.2% return is based on analysts' low EPS estimates and the 20.9% on their high EPS estimates, with 19.1% return based on consensus estimates. At the same time, lines 20, 26 and 32 show higher returns of 21.9% to 25.8% could be achieved, based on analysts' EPS estimates and historical P/E ratios.
Review Of Historical Performance For Southwest Gas
Table 4
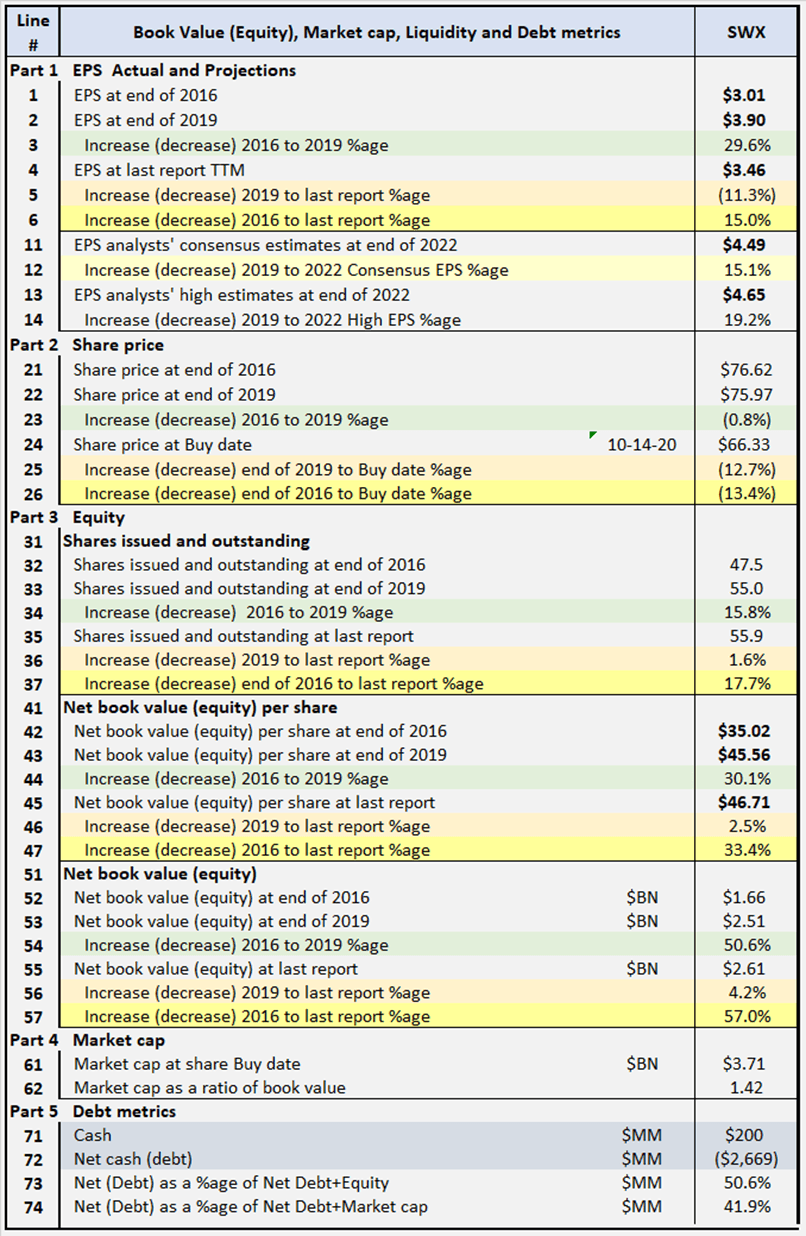
Comments on Table 4 are as follows
Part 1 - EPS - Actual and Projections (lines 1 to 14)
Part 1 shows that analysts' expectations for future EPS growth are below the historical rates of growth. Next earnings reporting date for Southwest Gas is Nov. 6, so it will be important to see how actual results compare to analysts' estimates.
Part 2 Share price
From 2016 to date, Southwest Gas share price has decreased by 13.4% (line 26), resulting in generally poor returns to shareholders. as illustrated in Table 5 below.
Part 3 Equity (lines 31 to 57)
Outstanding shares (lines 31 to 37) have increased by 17.7% since 2016, as a result of issues to grow the business. Net book value (equity) (lines 51 to 57) has grown by $0.95 billion since 2016, partly due to $0.63 billion from capital raising, and $0.70 billion in GAAP earnings offset by $0.38 billion in dividends.
Part 4 Market Cap
Market value is 1.42 times book value, a level that does not raise concerns.
Part 5 Debt metrics
Net debt level appears manageable.
Reviewing Southwest Gas's Historical Shareholder Returns
In Table 5 below, I provide details of actual rates of return for Southwest Gas's shareholders investing in the company over the last six years.
Table 5
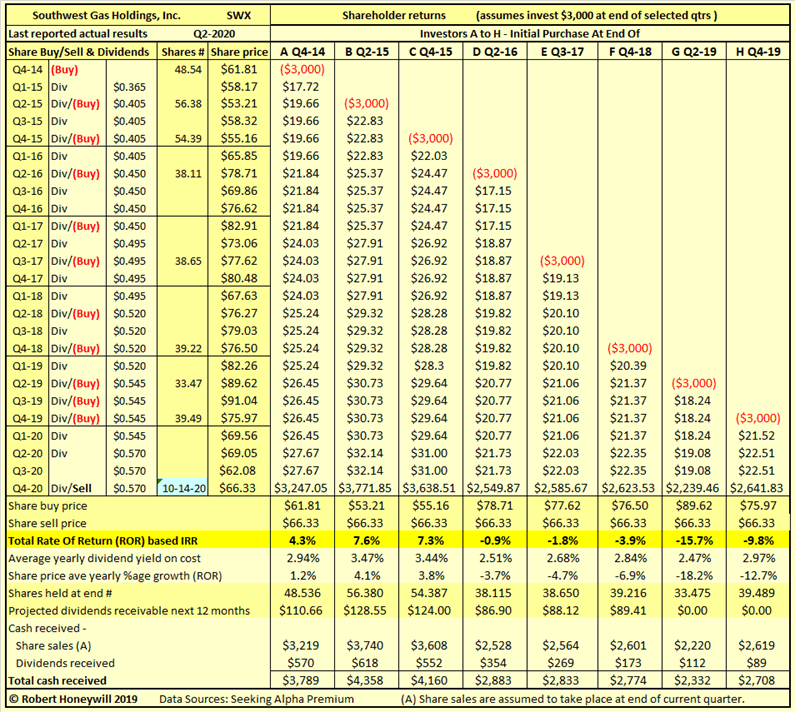
Table 5 shows returns have been poor for investors in Southwest Gas over the last five years. For investments prior to 2016, the returns for range from positive 4.3% to positive 7.6%. For all investments from 2016 onward, the returns are negative ranging from negative (0.9)% to negative (15.7)%. These rates of return are not just hypothetical results. They are very real results for anyone who purchased shares on the various dates and held through to fourth quarter 2020. In the above examples, the assumed share sale price is the same for all investors, illustrating the impact on returns of the price at which an investor buys shares.
Summary and Conclusions
The market appears to be having difficulty with rationally setting share prices at present due to the distortion of usual market metrics by the impacts of the COVID-19 pandemic. A potential combination of EPS growth, based on analysts' estimates, and an increase in the P/E ratio due to a reversion to historical levels offers the opportunity for solid returns. Increasingly negative sentiment towards the company since 2016 appears to be the main driver of poor returns, rather than actual company performance. The main opportunity for improved returns going forward would be an improvement in investor sentiment, reflected in higher P/E ratios.
Your Feedback Is Always Welcome
If you found this article interesting or helpful, please consider "following" me by clicking the button at the top, or "Like this article" below, as this will help me in building an audience and gaining greater fulfillment from sharing my investment ideas with you on Seeking Alpha. And, of course, I welcome you sharing your opinion or perspective by commenting below.
Dividend Growth Income+ Club - Register today for your Free Trial.

Click Triple Treat Offer (1) Your Free 2 Week Trial; (2) 20% Discount New Members; (3) Bespoke reviews for tickers of interest to subscribers.
Disclosure: I/we have no positions in any stocks mentioned, and no plans to initiate any positions within the next 72 hours. I wrote this article myself, and it expresses my own opinions. I am not receiving compensation for it (other than from Seeking Alpha). I have no business relationship with any company whose stock is mentioned in this article.
Additional disclosure: Disclaimer: The opinions in this document are for informational and educational purposes only and should not be construed as a recommendation to buy or sell the stocks mentioned or to solicit transactions or clients. Past performance of the companies discussed may not continue and the companies may not achieve the earnings growth as predicted. The information in this document is believed to be accurate, but under no circumstances should a person act upon the information contained within. I do not recommend that anyone act upon any investment information without first consulting an investment advisor and/or a tax advisor as to the suitability of such investments for their specific situation. Neither information nor any opinion expressed in this article constitutes a solicitation, an offer, or a recommendation to buy, sell, or dispose of any investment, or to provide any investment advice or service. An opinion in this article can change at any time without notice.
