


We recommend buying Bank of Baroda around Rs 47.50 with a stop loss of Rs 43 for higher targets of Rs 53/56 as indicated in above chart.
Shabbir Kayyumi
What is Falling Wedge?
Wedges form when the prices of a financial instrument move within a narrowing range, angled either up or down. Whereas triangles are formed by the price moving sideways, wedges can make significant progress either up or down.
In many cases, when the market is trending, a wedge is developed on charts. This wedge could be either rising or falling. Wedges can also appear at the end of a bullish or bearish trend. When the pattern completes, and the price breaks out of the wedge, it is usually in the opposite direction of the wedge and hence called as a reversal pattern. There are mainly two types of wedge patterns either rising or falling wedge. A falling wedge is generally considered bullish and is usually found in a downtrend.

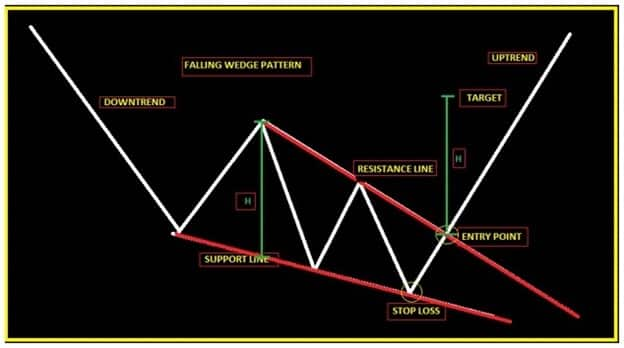 Figure. Falling Wedge
Trend lines are the best way to spot the narrowing of the channel, which is the first key sign that the reversal is on the way ahead.
These reversals can be quite violent due to the complacent nature of the participants who expect the trend to continue.
Though sometimes Wedge pattern are a continuation pattern however, most of the time it is a reversal pattern.
Why to buy Bank of Baroda?
The falling wedge pattern is characterized by a chart pattern which forms when the market makes lower lows and lower highs with a contracting range. Price chart of Bank of Baroda has shown falling wedge pattern since the last two months and very recently there has been break out from the pattern on the opposite side as expected of a falling wedge pattern.
Buy Signal
If you look closely at the below attached chart, you can see a falling wedge pattern in formation and recently stock has given a breakout from upper trend line for higher levels. We suggest buying in this stock, considering bullish technical parameters discussed above. Moreover, momentum oscillators RSI and stochastic is also supportive for positive movement.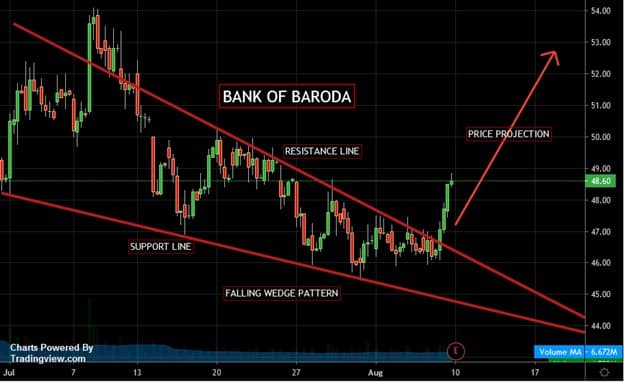 Figure. Falling Wedge and Buy signal on Bank of Baroda
Profit Booking
As per one of the method of Falling Wedge one can use previous swing line for profit booking. These levels are standing around Rs 53 and should provide immediate resistance on higher side, moving further Rs 56 will attract more profit bookings. So one can consider profit booking near Rs 53 and higher side towards Rs 54 mark.
Stop Loss
Entire bullish view negates on a breach of immediate support zone and in a case of Bank of Baroda, we will consider Rs 43 as a stop loss level closing basis.
Conclusion
We recommend buying Bank of Baroda around Rs 47.50 with a stop loss of Rs 43 for higher targets of Rs 53/56 as indicated in above chart.
The author is Head - Technical Research at Narnolia Financial Advisors Ltd.
Disclosure: Narnolia Financial Advisors/Analyst (s) does/do not have any holding in the stocks discussed but these stocks may have been recommended to clients in the past. Clients of Narnolia Financial Advisors Ltd. may be holding aforesaid stocks. The stocks recommended are based on our analysis which is based on information obtained from public sources and sources believed to be reliable, but no independent verification has been made nor is its accuracy or completeness guaranteed. The views expressed in this research report accurately reflect the personal views of the analyst(s) about the subject securities or issues, and no part of the compensation of the research analyst(s) was, is, or will be directly or indirectly related to the specific recommendations and views expressed by research analyst(s) in this report.
Disclaimer: The views and investment tips expressed by investment expert on Moneycontrol.com are his own and not that of the website or its management. Moneycontrol.com advises users to check with certified experts before taking any investment decisions.