The year 2020 has challenged pre-established notions and policy makers have faced real time challenges to rationalize each move. Similar to this flavor, this blog tries to explore the price dynamics of the precious metal – Gold and its outlook. As we move forward in this blog, we will analyze the price movement, forecast prices until end of 2020 and explain what you should do in this scenario. For analysis, we use daily spot prices of (July 2019-20) Gold spot USD/t oz, MSCI World Equity Index, S&P 500 index, USD Index, US 10-year govt bond yields and CBOE Volatility Index (VIX).
Key Takeaways:-
1. YTD returns: Gold 23%, World Equity -1.5%, S&P 0%, 10y yields -69%.
2. Gold is now a unique combination of safety + high returns.
3. Dec 2020 price forecast per 10 grams: Current = Rs. 51000, base case = Rs. 57000, bull case = Rs. 63000, bear case = Rs. 47,000.
1. Performance of Gold
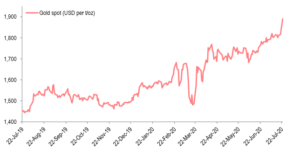
In past one year, gold has returned 30% and has continued the upward trend except a temporary drop in March due to virus uncertainties (Chart 1). As more fiscal and monetary support measures were announced, gold shined brightly due to its safe haven appeal.
Chart 1: Gold spot price in last one year

2. Reason behind the rising prices
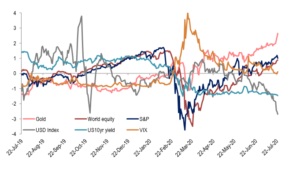
On the supply side, top 5 producers – China, Russia, Australia, USA and Canada are all under pressure due to the pandemic as far as mining activities are concerned. An astonishing fact is, although the prices are rising, miners are delaying/lowering their capex to reap benefits – which should have happened the other way. On the demand side, Fed’s liquidity push and the negative sentiment about US economic growth has pushed the dollar down which increased gold’s demand as safe asset. Negative real interest rates or lower bound nominal rates has decreased the interest of investors to keep money in the banks and invest in gold instead. When cash returns are negative or zero adjusting inflation, gold’s income disadvantage disappears – atleast you can retain the asset value unlike cash. In Chart 2, we plot the Z-scores which depicts whether the actual spot values are returning to long-term average (mean reversion) – Gold (on the upside), USD Index and 10y yields (downside) does not signal mean reversion.
Chart 2: Gold and Dollar are far above/below +/-2 standard deviation respectively

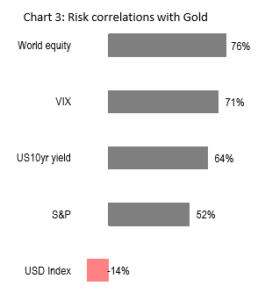
Analyzing the relationships of the indices from the risk management perspective, the divergence between Dollar and gold does not come as surprise. But, in last 1 year, gold and equities have a very high positive risk correlations – as risk in one index rise, gold becomes volatile too (Chart 3). The chart beside depicts that – say, for example, when volatility of MSCI World Equity rises, Gold’s volatility rises too. On the other hand, when USD becomes volatile, gold tends to experience lesser volatility due to its safe haven appeal.
Effort to quantify the relationships via machine learning models generated some interesting results. A basic linear dependent model of Gold vs all this indices was built to see how the movement of these indices influence gold prices and significance of these indices in explaining price of gold. Results suggested that a 10% increase in World Equity, VIX and USD Index will lead to a 4%, 0.25% and 3% rise in gold prices respectively, while a 10% increase in US10y yield will lead to a drop of 1.45% in gold prices. This opposite relationship is quite practical as yields rise, people try to migrate to bonds as it generates a fixed stream of interest income. Coming to S&P and gold relationship, results suggest that gold is not a hedge anymore to equities as S&P was insignificant in explaining the movement in gold prices. This entire model has an explanatory power of 92%.

3. Gold price forecast (India, INR)
Keeping the above relationships in mind + adding some more intutions and building further complex models we try to have an idea about the gold prices in the future. Please note this is exploratory only and should not be used as formal investment advice. Factoring in loose monetary policy, there will be higher demand for gold as value protecting and minimal interest rate generating instrument. Adding to this, the markets are expecting further fiscal measures around the world which can lead to availability of ‘hot money’ – fuelling inflation concerns. When the economic activity begins fully, inflation would be around the corner and we can expect both the stock market and gold price to rally. Geopolitical risks and US elections will also play a role in contributing to flight to safe haven which can lead to higher demand for gold. Currently, the prices are at Rs. 51,000 per gram and Dec 2020 levels can be seen at Rs. 57,000 per gram as a base case. In a bearish case the levels can be at Rs. 47,000 per gram and on a bull case it can be around Rs. 63,000 per gram.
4. What should you do?
So, in this scenario, what should a common man do – In India, a normal middle class house needs gold for marriage and is seen as luck. Retail demand has been muted in this period but gold ETFs, mutual funds and SGBs has seen massive inflows. If you are someone who NEEDS to buy physical gold, enter now. Though prices are very high, it is expected to move higher. If you are an investor, allocate 5%-15% of your total investments to sovereign gold bonds or gold mutual funds. Avoid physical gold at all costs. In past 5 years, gold has outperformed NIFTY but in the long-term say, 15-20 years equity will outperform while gold will only supplement it.
Glitters are good – just don’t get blinded by it!