 Delhi’s PM 2.5 average during the lockdown period was 49 as opposed to 101.3 in 2017, 121 in 2018 and 109.2 in 2019.
According to an analysis of the CPCB Air Quality Index data for the 74 day duration of the lockdown, the lockdown has helped achieved 95 percent of the National Clean Air Porgramme (NCAP) for the four cities of Delhi, Mumbai, Kolkata and Chennai. The analysis, carried out jointly by CarbonCopy and Respirer Living Sciences, is part of the NCAP Tracker project which monitors implementation of the National Clean Air Programme across the 122 non-attainment cities.
The clampdown on all non-essential activities due to the COVID-19 pandemic, from March 25 to June 8, led to a significant decline in air pollution levels for major cities across India. In the Centre’s attempt for cities to have better air quality, the NCAP was notified in January 2019 seeking to reduce particulate matter (breathable pollutants that can easily enter the lungs and cause ailments) by 20-30% by 2024. Over the course of the year, 122 non-attainment cities were added to this list and air pollution action plans were developed and approved for 102 of them.
“The lockdown period helped us understand the effects from anthropogenic (human-generated) emissions to our environment. All four cities analysed managed to better their 2024 NCAP target by around 30%, with Kolkata bettering their target by over 50% during this lockdown. This period is a marker for policy makers on how they can achieve what has been planned for in the coming four years, in a relatively shorter period,” said Ronak Sutaria, CEO Respirer Living Sciences.
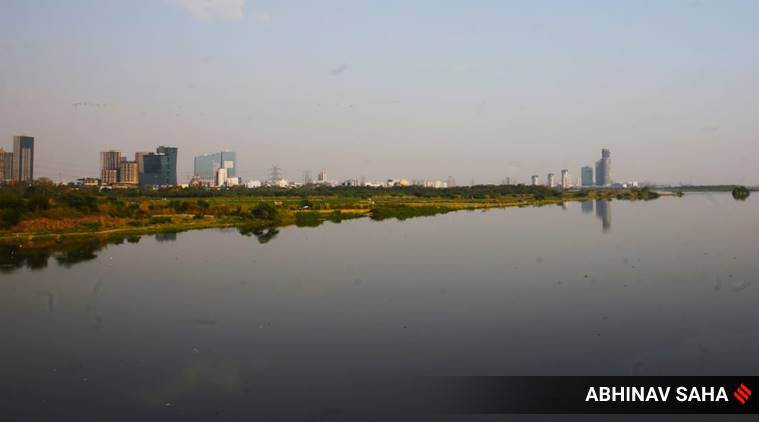
 Visitors enjoying at Sukhna Lake Chandigarh on Friday after unlock 1.0. Express Photo by Kamleshwar Singh
The analysis shows that Mumbai’s PM 2.5 average during the lockdown was 20, whereas it’s average PM 2.5 in 2017 was 40, in 2018 was 47 and in 2019 was 36.1. Mumbai had to achieve a target of 28 PM 2.5.
Kolkata’s average PM 2.5 during the lockdown was 22 as opposed to PM 2.5 average of 69.3 in 2017, 86.2 in 2018 and 57.7 in 2019. Kolkata’s target was 48.5.
Delhi’s PM 2.5 average during the lockdown period was 49 as opposed to 101.3 in 2017, 121 in 2018 and 109.2 in 2019.
Similarly Bangalore’s PM 2.5 average during the lockdown period was 23, as opposed to 46.1 in 2017, 47.4 in 2018 and 36.7 in 2019.
Similar reductions have been found in PM 10 levels during the lockdown period in the four cities. In Mumbai, the average PM 10 level last year was 82.72 as opposed to 59 during the lockdown, Kolkata’s was 108.62 last year to 45 in the lockdown period, Delhi’s was 216.6 in 2019 as opposed to 49 during the lockdown period and Bangalore last year had an average PM 10 level of 77.52 as opposed to just 14 during lockdown.
Dr Sagnik Dey, Coordinator of Centre for Excellence for Research on Clean Air (CERCA) at IIT-Delhi says that the reason behind this drastic fall in pollution levels is that out of the eight primary polluting sources in India, four were completely closed during the lockdown period – vehicular emissions, emissions from industry, construction and brick kilns.
“Besides this since the demand for power was so low, power demand plummeted by 19.9% due to decline in industrial activity, coal fired thermal power plants were also functioning less. PM2.5 levels range between 20-49 µg/m3 across these four major Indian cities during the lockdown, which means that in the best case scenario we cannot go below that. The WHO guideline for clean air level is 10 µg/m3.”
“However this marked fall in pollution has been in urban centers. In our own research, we have found that this impact of falling pollution does not exist in rural areas. The main source of pollution there are emissions from household activities, which not only continued, but is likely to haveincreased. Also, since relaxation had been given to agriculture, we found through satellite data that open burning of crops actually increased in central and southern India, possibly leading to an increase in pollution there. To bring down the average counts of different pollutants, and meet national standards, what the National Policy really needsto look at is how to control pollution in the regions, while focusing on the polluting sectors in urban India,’’said Dr.Dey.