 Comparing the data of the past few months, it was seen that the number of coronavirus cases increased by 75 per cent within half the time in the month of June, as compared to all months from March to May combined. (Photo: Kamleshwar Singh)
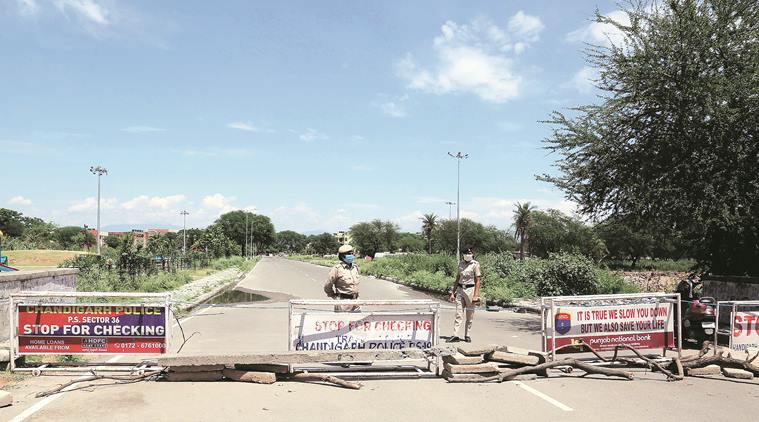
As the Tricity continues to deal with the steep growth curve reported after Unlock 1.0, it braces for the upcoming Unlock 2.0. Comparing the data of the past few months, it was seen that the number of coronavirus cases increased by 75 per cent within half the time in the month of June, as compared to all months from March to May combined.
With allowance of even more activities, threat of a further rise in numbers has also increased.
While the total cases reported from the Tricity stood at 425 on June 1, the number reached 652 on June 29.
Panchkula, meanwhile, has seen an especially steep rise, where cases increased by more than four times in the past month. The coming month will also remain crucial for the district as authorities estimate the district will reach its peak.
How were cases reported and how did they progress in each district?
While the UT had reported less than 100 cases by April end, the number tripled itself and had reached 294 on June 1. Since June 1, 144 more cases have been reported, taking the total number of cases reported from Chandigarh to 434.
The highest spurt though was noticed in the month of May, the cause for the same being the large number of cases reported from a congested area which became the centre of an outbreak. The progression chart shows the numbers still rising, slowly but steadily.
Panchkula: Only 17 people had tested positive in the months of March and April in Panchkula and the total cases had reached 26 by June 1. The unlock, however, caused a sharp rise in the city with cases increasing four times within one month.
Cases as on June 29 in Panchkula, stand at 111. As many as 53 outsiders (people hailing from other parts of country) too have tested positive in the district, taking the total number of cases to 163. Going by the count which includes the outsiders, numbers in Panchkula under lockdown phase I increased by more than six times amounting to a 600 per cent rise in cases.
Mohali: The district of Punjab, had reported more than 100 cases by May end – which may be attributed to the creation of a hotspot in one of its villages. In June, cases increased by 50 per cent in the district.
The month of May saw the least number of cases being reported in Mohali, which gave the authorities a glimmer of hope. While as many as 92 had been reported on May 1, it was only after May 25, that cases started increasing again. The number stood at 116 on June 1 and further increased to 154 on June 29.
Sampling in UT remains lowest
Chandigarh: The sampling in UT has remained the lowest among the Tricity, even though it has the highest population. As on Monday, only 7,548 samples had been collected.
The UT has sampled as little as 629 persons per lakh population – lowest among all the Union Territories of the country. The sampling rate of Chandigarh has also pushed it in the lower bar of tests conducted by UTs and states across the country.
Mohali: With a population of 10 lakh, taking a lead from Panchkula in the month of June, the district has collected as many as 13,300 samples until now. The district has tested 1,330 persons per lakh population.
Panchkula: With a population of six lakh, Panchkula remains ahead in number of samples tested per lakh population with as many as 1,583 persons tested per lakh population. The district has collected 9,500 samples.
Panchkula with its own Covid-19 testing lab, increased its sampling from 100 per day in May, to almost 200 per day in June. However, the facility is not being utilized to full capacity. The lab has the potential to conduct almost 400 tests per day. Panchkula lags behind Mohali with more than a 25 per cent gap in testing.
Mohali had increased its sampling when Punjab had decided to double its sampling rate in the month of June. Mohali sends its samples to Chandigarh’s PGIMER.
UT reports the maximum positive cases per lakh population
Taking a lead in number of people testing positive per lakh population, Chandigarh has reported as many as 36.1 cases testing positive per lakh population, leaving behind both Panchkula as well as Mohali by more than half.
While Mohali has the least number of cases testing positive per lakh population with its numbers standing at 15.4, Panchkula has 18.5 persons testing positive per lakh population.
Even with such figures, Chandigarh is yet to bring about a change to their sampling strategy. Both Panchkula and Mohali have meanwhile increased their sampling by more than double the numbers and plan on doing so again.
Positivity Rate
Positivity rate is the number of cases testing positive divided by total tests.
The lowest rate of sampling, highest number of persons testing positive comes at a time when Chandigarh takes a lead with its positivity rate of 5.7 per cent—third highest among UTs after Delhi and Ladakh, and one of the highest among all UTs and states in the country.
Chandigarh’s positivity rate has also exceeded that of Panchkula and Mohali’s by more than five per cent.
Panchkula and Mohali both have a positivity rate of 1.1 per cent each, going by the numbers reported positive and total samples collected in the respective districts.
If the positivity rate for Panchkula were to be calculated including outsiders, the rate goes up to 1.7 per cent.