


Whenever price candle will be near previous swing high which is near Rs 210-212 levels, then one can book profits in SBI.
Shabbir Kayyumi
RSI stands for Relative Strength Index. It is a momentum oscillator used to identify trend reversal. RSI was invented by Welles Wilder Junior. The default look-back period for RSI is 14, however this can be lowered to increase sensitivity or raised to decrease sensitivity. RSI calculates strength of stock trend and helps to predict their reversals.
Why one should buy State Bank of India (SBI)?
There are a lot of trading strategies using RSI; below mentioned is one of the most popular among trading community which involves buy after completing retracement for higher movement.

In the past few days, RSI had given a breakout by trading above 50 levels from below and made a high of 78 then after it is trading lower or retracing towards center line placed at 50 levels, this behavior is called as RSI Pull Back Buy or RSI PBB setup.
RSI PBB setup indicates that once RSI turns its tail upside after taking support from zone of 45-55 levels, target is previous swing high of RSI which was 78 or previous swing high of prices. Currently the SBI is going through this setup and we expect higher price movement towards Rs 210 levels in coming days.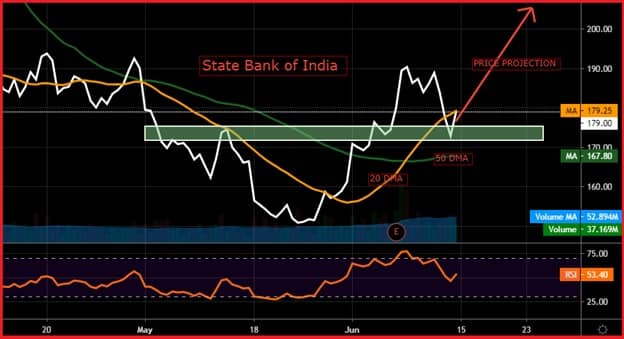 Figure .1. RSI PBB setup and Buy signal on SBI
Buy Signal
1. Recent RSI gave a breakout and published swing top around 78 levels.2. After marking high of 78, RSI is retracing towards mid-line standing around 50 mark.
3. Strong bullish candle formation near buying zone has given us confirmation of retracement complete and original trend begin.
4. Mid- term moving average 50 DMA placed around Rs 168 levels defines mid-term trend is very well augur with bulls as prices are sustained and trading above it.
5. Decent volume participation while forming bullish candle will also give additional confirmation.
Profit Booking
Whenever price candle will be near previous swing high which is near Rs 210-212 levels.
Stop Loss
Entire bullish view negates on breaching of a swing low and one should exit from long position. In case of SBI, it is standing around Rs 161 mark closing basis.
Conclusion
We recommend buying State Bank of India (SBI) around Rs 179-177 levels with a stop loss of Rs 161 on a closing basis for higher targets of Rs 210 and Rs 220 levels as indicated in above chart.
The author is Head - Technical Research at Narnolia Financial Advisors Ltd.
Disclosure: Narnolia Financial Advisors/Analyst (s) does/do not have any holding in the stocks discussed but these stocks may have been recommended to clients in the past. Clients of Narnolia Financial Advisors Ltd. may be holding aforesaid stocks. The stocks recommended are based on our analysis which is based on information obtained from public sources and sources believed to be reliable, but no independent verification has been made nor is its accuracy or completeness guaranteed. The views expressed in this research report accurately reflect the personal views of the analyst(s) about the subject securities or issues, and no part of the compensation of the research analyst(s) was, is, or will be directly or indirectly related to the specific recommendations and views expressed by research analyst(s) in this report.
Disclaimer: The views and investment tips expressed by investment expert on Moneycontrol.com are his own and not that of the website or its management. Moneycontrol.com advises users to check with certified experts before taking any investment decisions.


