 At a given point of time, who will be tested and who will not, is dependent on specificity of testing criteria. (Express photo/Amit Mehra)
Written by Aakanksha Arora, Mahima and Aasheerwad Dwivedi
COVID-19 outbreak has reached every continent besides Antarctica. The disease has upended life across the globe, shutting down entire cities and countries in a span of months. One specific statistics i.e. proportion of people tested positive out of total tests performed lies at the heart of understanding the spread of the pandemic. This number not only tells us about the prevalence of the infection but also about who are actually being tested.
An insightful way to analyze this number is to interpret it in terms of Sensitivity and Specificity of the testing criteria and Prevalence of the virus. In medical diagnosis, test sensitivity is the ability of a test to correctly identify those with the disease (true positive rate), whereas test specificity is the ability of the test to correctly identify those without the disease (true negative rate). Sensitivity tells us how well the tests can pick up patients with disease and specificity measures how well the test rules out people who are tested but aren’t infected. Prevalence is simply the existing rate of infection in the population.
At a given point of time, who will be tested and who will not, is dependent on specificity of testing criteria. During the early stages of any outbreak, as a first line of defense, the testing criteria usually has high specificity; which means only people with very specific conditions are eligible for testing. In case of COVID-19, these conditions include international travel history, high fever, dry cough, shortness of breath, etc. Because of high specificity, fewer people get tested. On the other hand, high sensitivity in testing criteria attempts to capture the majority of infected population, by testing as many as possible, which helps in containment interventions. To get a deeper insight, we use Bayes’ theorem to formulate ‘Proportion of test positive’ in terms of sensitivity, specificity and prevalence.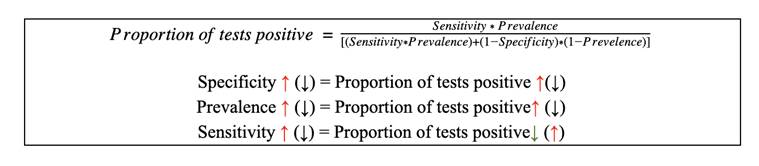
All the efforts related to controlling the pandemic can be seen as an attempt to drive this ratio down. There are only two ways of doing so- lowering the prevalence of the infection and/ or by reducing the specificity of testing criteria i.e. testing more and more population. Most countries, including India, started with ‘highly specific’ testing criteria due to lack of testing kits and related gears, which made economic sense as well. The ‘proportion of tests positive’ would be higher in a ‘highly specific’ testing criteria as only the people who possess specific pre-requisites would be tested. But as we start testing more population including asymptomatic people, this ratio reduces.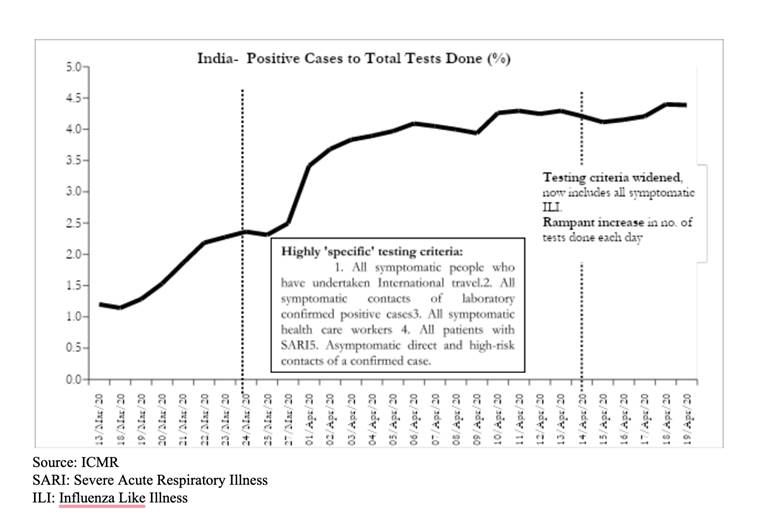
In India, the percentage of positive cases to total tests done was around 1-2 at the beginning. It started increasing over time as testing criteria was highly specific limited to high-risk group. It is a generally noted international trend that this ratio increases before it falls or flattens. In due course, the testing criterion was gradually broadened, and a massive increase in testing was also brought about, after which the positive test percentage has flattened. In the last two weeks number of tests in India rose from 1 lakh to more than 4 lakhs. One possible explanation of this could be that the prevalence of infection did not decline, counter balancing the wide expansion in testing (reducing specificity).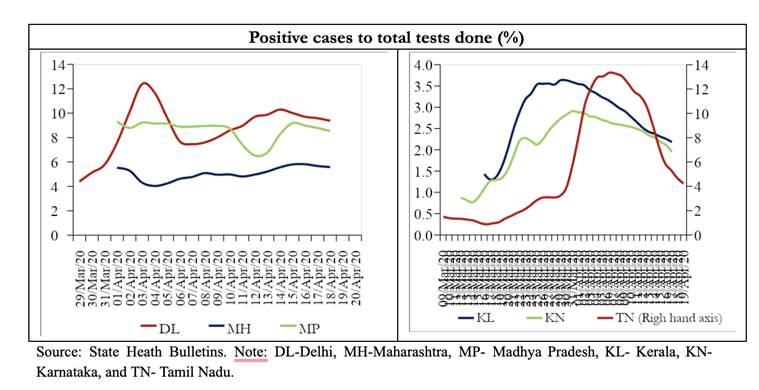
Further, to get a disaggregated picture, we analyse the same ratio for different states in India, as the pandemic unfolded at different rate among states in India. First important observation from the graph is varied positive cases to test ratio across states. Tamil Nadu, Kerala and Karnataka are the states for which this ratio is strictly decreasing as expected with higher testing done now. Since the beginning of this month, in Delhi, Maharashtra and MP this ratio reduced first and has flattened recently. Gujarat is the only state where it is increasing, but this can be treated as an anomaly considering the recent outbreak of the virus in the state. On this basis we can say that for Southern States like Tamil Nadu, Kerala and Karnataka the prevalence of infection has not increased, whereas Delhi and Maharashtra seem to have increased prevalence which is counterbalancing the decreased specificity of the tests being conducted. We must also keep in mind that these states are testing at different rates, with Maharashtra and Delhi conducting more tests in comparison to other states. Of course, many other factors like demography, mobility, health infrastructure and many unknowns need to be accounted for accurately statistical analysis.
What does all this imply for India?
We have relaxed the specificity of testing criteria recently and as an outcome we can see that the proportion of tests positive has started to flatten recently. But it has not yet reduced. It could be due to either that the rate of infection has not yet reduced sufficiently or that we need to keep improving the testing efforts to achieve the optimal testing coverage. In either the case, it was necessary for us to extend the lockdown and follow the principles of social distancing. We must carry on with following these to the T to control the spread of this pandemic.